Solana (SOL): Bullish Continuation after Neckline BreakoutWhat I see:
Chart Patterns (Head and Shoulders): The chart illustrates a classic "Head and Shoulders" pattern. The left shoulder, head, and right shoulder are formed, and the neckline (the blue dashed line) has been broken, which suggests that the price could rise towards the target zone above the broken neckline.
Target Price: Based on the pattern and technical analysis, the potential target for the price could be around $219.84, as indicated by the box in the upper right corner. This target aligns with the upward trend continuation from the broken neckline.
Support Zones: There are several key support levels below the current price, including the lower zone marked in blue around $95.50 and the potential demand area in the middle blue zone (around $136.34). These could act as areas for price to rebound from if there's a pullback.
Trend Line and Movement: The dotted blue trend line suggests an ascending trend, showing higher lows, and the price is likely to continue upward after the recent breakout above the neckline.
Given the broken neckline and the formation of the Head and Shoulders pattern, the bullish scenario appears more likely. A price target of around $219.84 seems feasible if the upward momentum continues. However, if the price fails to hold above the neckline or reverses, the support zones could provide areas for potential price bounces, with the $136.34 region as a significant level to watch for possible buying opportunities. Therefore, the most probable outcome aligns with the bullish scenario (towards $219.84).
SOLUSD trade ideas

Solana Presents Multiple Opportunities on the HorizonContext 1:
Support: $125.50
Resistance: $185.00
Psychological Levels: $150.00 and $190.00
Context 2:
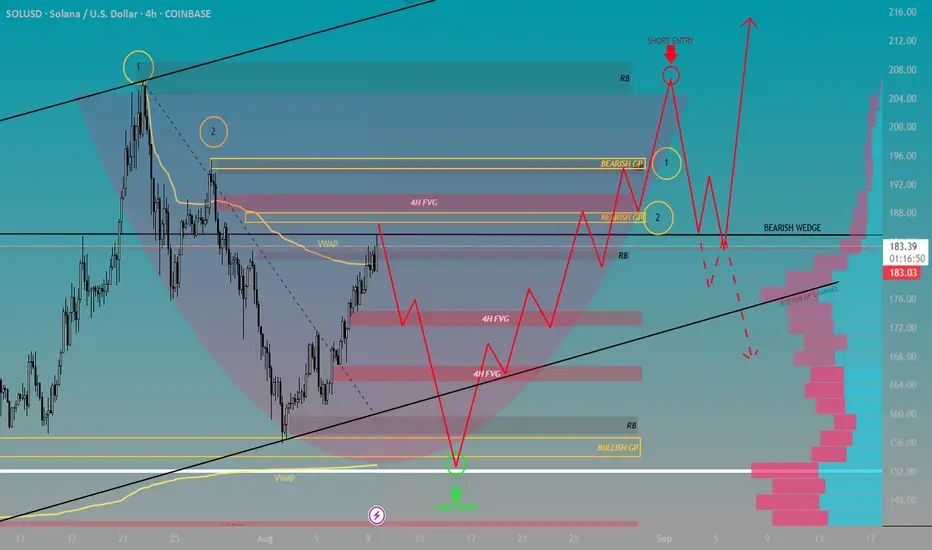
Technical Structure 1: We are in a bearish wedge that has formed the beginning of a bearish channel that has tested support 3 times and tested resistance 4 times.
FVG’s:
FVG Confluence 1: One bearish 4H FVG located bove price. 3 bullish 4H FVG located below price.
Golden Pocket: Sits right below 4H FVG and aligns with the $190.00 Psychological level. Strong confluence.
Context 3:
Volume Insight: Volume Indicator shows a spike in volume from psych level $150.00 and $155.00. Aligning with the POC and a Rejection Block located right above the 0.65 fibbonacci level.
Bullish Scenario: With multiple confluence at the $150.00 psych level, price sweeps the previous low as it bounces off the lower anchored VWAP. This will lead to a completion of a Cup and Handle formation producing enough momentum for a breakout of the Bearish Wedge.
Bearish Scenario: Above the $200.00 psych level remains a Rejection Block. Sweeping this area may lead to enough liquidation to push us back within the Bearish Wedge and allow for a breakout towards the POC.
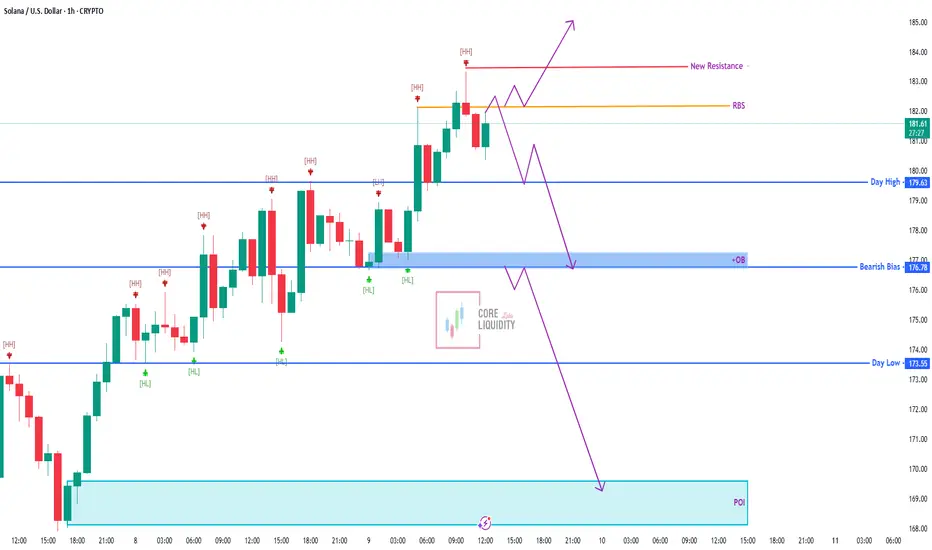
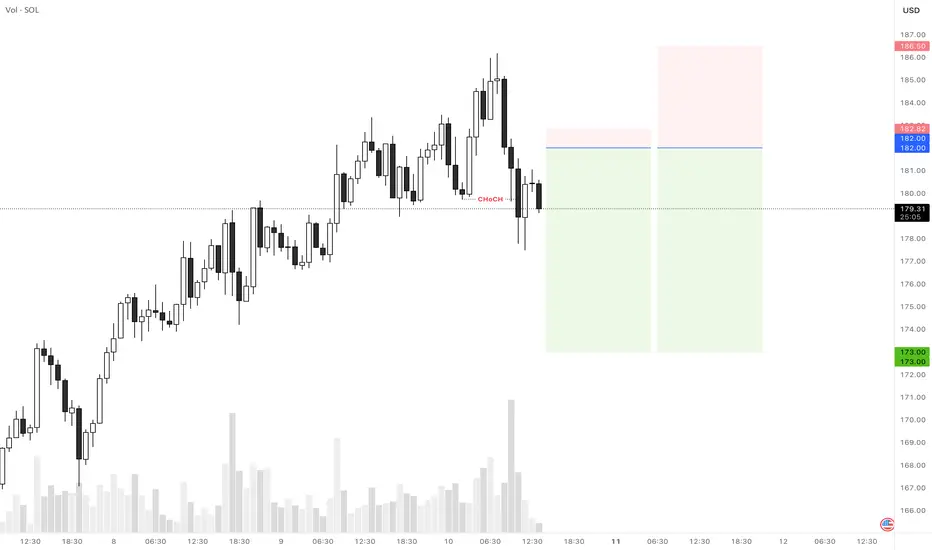
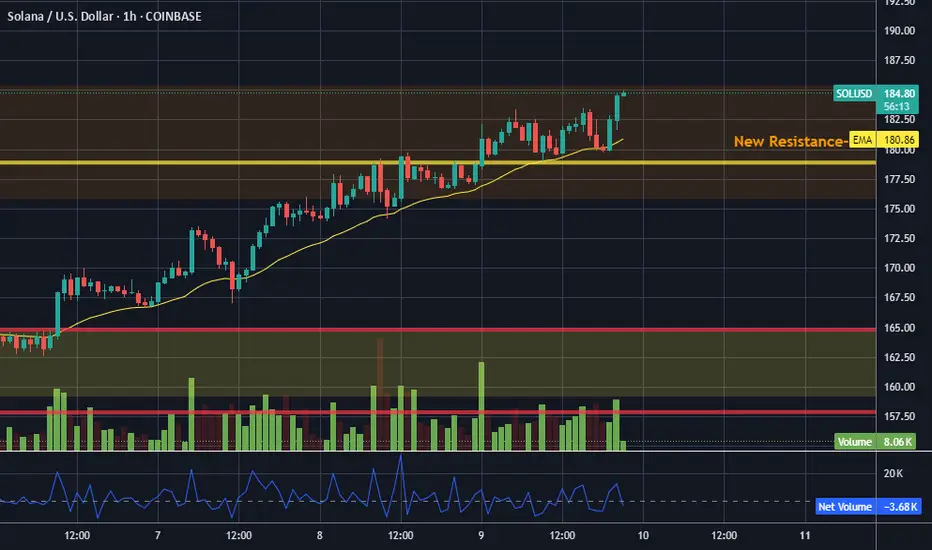
SOL/USD – Key Decision Point SOL is holding just below new resistance (183.00) after a strong push. Price action suggests two possible scenarios:
1️⃣ Bullish Breakout – Clear move above resistance could trigger a rally towards fresh highs.
2️⃣ Bearish Reversal – Rejection here could send price back to 179.63 (Day High), then deeper into the 176.78 OB and possibly towards the 173.55 Day Low / 169.00 POI.
Key Levels:
Resistance: 183.00
RBS: 182.00
Supports: 179.63 / 176.78 / 173.55 / 169.00
Bias: Neutral — breakout or rejection will decide the trend.
📌 Watch closely — the next move could be explosive in either direction.
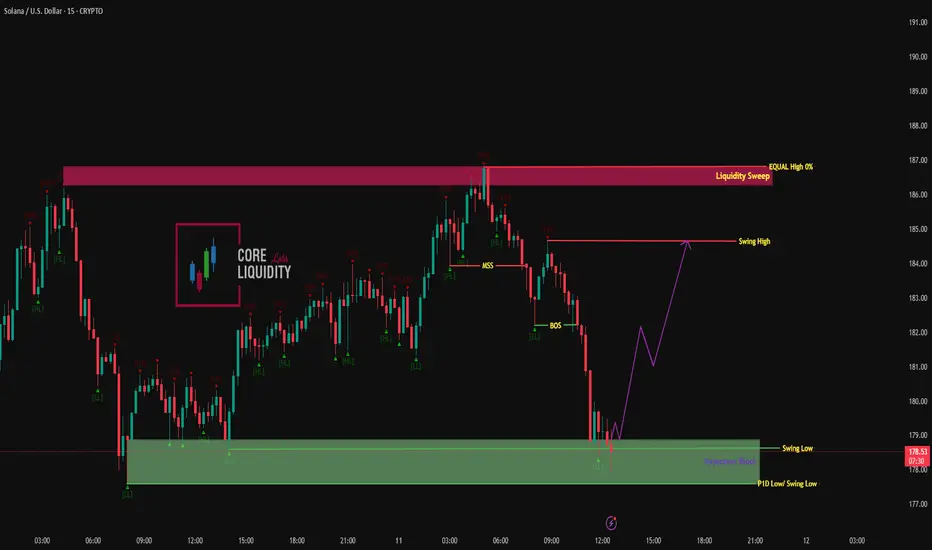
SOL/USD – 15M | Bullish Reversal SetupPrice has tapped into the Rejection Block inside a major demand zone (Swing Low / P1D Low) and is showing signs of holding.
If this structure holds, we could see a bullish push toward the Swing High and possibly higher.
Bullish Roadmap:
1️⃣ Price holds above the Rejection Block → bullish confirmation.
2️⃣ Move toward Swing High (184).
3️⃣ Break of Swing High could open the way for a liquidity sweep toward Equal High / 0% Liquidity Sweep Zone (186–187).
Key Levels:
Demand Zone / Rejection Block: 178.0 – 177.0
Swing High: 184.0
Equal High / Liquidity Sweep: 186.0 – 187.0
🎯 Watching for bullish confirmation inside demand with targets at Swing High and Equal High.
Bulls will be disappointed - Weekly Update August 5-11thSolana appears to be in the final leg of a complex corrective structure. According to the current Elliott Wave count, the larger cycle degree is unfolding in a downward wave c, while the primary degree is in an upward wave B, subdividing into intermediate wave C, which itself is in minor wave C—now developing.
The corrective decline from the July high has retraced toward the 0.618 Fibonacci retracement level (~$157) of the prior move, marking a typical zone for the end of Wave B within a flat or zig-zag formation. From this low, Solana has begun to push higher, indicating the likely beginning of Wave C to the upside. Based on Fibonacci extensions, the potential target zone for this move lies between $236 (1.0 extension) and $254 (1.236 extension).
From a market structure perspective, funding rates across major perpetual futures markets for SOL remain slightly negative or neutral, indicating that the majority of traders are not aggressively long at this stage. This often provides a more stable environment for an upward move, as it suggests the absence of overcrowded long positions that could lead to sharp liquidations. For reference, data from Velo (as of August 5) shows funding on Binance SOLUSDT Perpetual at 6.07%, confirming this neutral-to-slightly-bearish bias in funding.
Additionally, open interest has been neutral since the local low around $157. This is visible on futures data platforms such as Velo.xyz.
However, the liquidity heatmap does not currently support a strong magnet effect toward the $236–$254 zone. There is no significant cluster of stop liquidity or resting orders above $230 that would attract price purely through liquidation mechanics. In contrast, notable liquidity still resides below current levels, making the setup more technically driven than structurally supported by liquidity.
Given these conditions, the case for a C-wave rally remains technically intact, but traders should be cautious: the absence of upper-side liquidity and the corrective macro context imply that this move, even if successful, is likely a countertrend rally within a broader bearish cycle structure.
In conclusion, as long as price holds above the $157–$166 support zone and maintains impulsive structure on lower timeframes, the outlook remains short- to mid-term bullish toward the $236–$254 area. Yet, any breakdown below $157 would invalidate this wave count and suggest that Cycle Wave c may already be resuming to the downside.

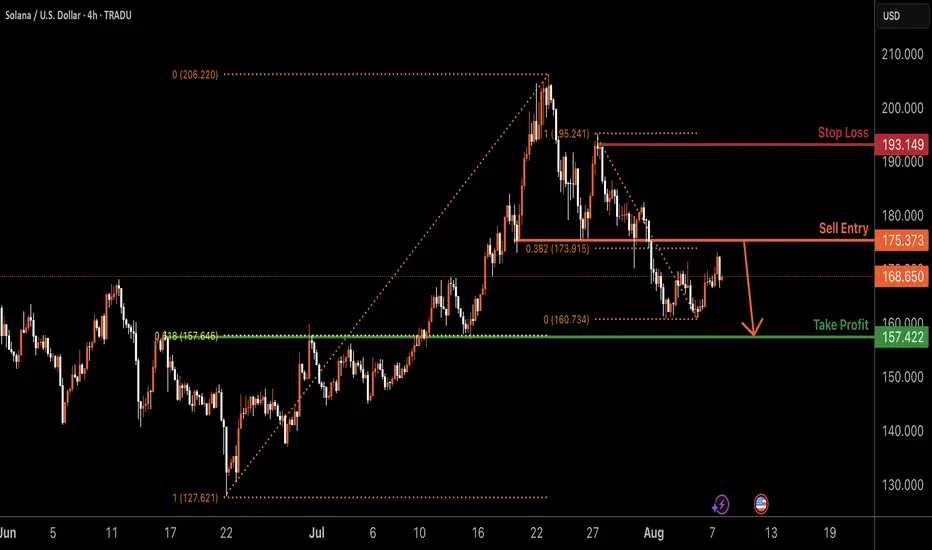
SOLUSD H4 | Bearish dropBased on the H4 chart analysis, we can see the price rising to the sell entry, which acts as a pullback resistance, and it could drop from this level to the take profit target.
Sell entry is at 175.373, a pullback resistance that aligns with the 38.2% Fibonacci retracement.
Stop loss is at 193.149, which is a swing high resistance.
Take profit is at 157.422, which is an overlap support that aligns with the 61.8% Fibonacci retracement.
High Risk Investment Warning
Trading Forex/CFDs on margin carries a high level of risk and may not be suitable for all investors. Leverage can work against you.
Stratos Markets Limited (tradu.com ):
CFDs are complex instruments and come with a high risk of losing money rapidly due to leverage. 65% of retail investor accounts lose money when trading CFDs with this provider. You should consider whether you understand how CFDs work and whether you can afford to take the high risk of losing your money.
Stratos Europe Ltd (tradu.com ):
CFDs are complex instruments and come with a high risk of losing money rapidly due to leverage. 66% of retail investor accounts lose money when trading CFDs with this provider. You should consider whether you understand how CFDs work and whether you can afford to take the high risk of losing your money.
Stratos Global LLC (tradu.com ):
Losses can exceed deposits.
Please be advised that the information presented on TradingView is provided to Tradu (‘Company’, ‘we’) by a third-party provider (‘TFA Global Pte Ltd’). Please be reminded that you are solely responsible for the trading decisions on your account. There is a very high degree of risk involved in trading. Any information and/or content is intended entirely for research, educational and informational purposes only and does not constitute investment or consultation advice or investment strategy. The information is not tailored to the investment needs of any specific person and therefore does not involve a consideration of any of the investment objectives, financial situation or needs of any viewer that may receive it. Kindly also note that past performance is not a reliable indicator of future results. Actual results may differ materially from those anticipated in forward-looking or past performance statements. We assume no liability as to the accuracy or completeness of any of the information and/or content provided herein and the Company cannot be held responsible for any omission, mistake nor for any loss or damage including without limitation to any loss of profit which may arise from reliance on any information supplied by TFA Global Pte Ltd.
The speaker(s) is neither an employee, agent nor representative of Tradu and is therefore acting independently. The opinions given are their own, constitute general market commentary, and do not constitute the opinion or advice of Tradu or any form of personal or investment advice. Tradu neither endorses nor guarantees offerings of third-party speakers, nor is Tradu responsible for the content, veracity or opinions of third-party speakers, presenters or participants.
Solana - Current Technical LandscapeCurrent Technical Landscape
Key Support Zone - 20-day EMA (~$178.25): SOL is trading around $180, and a break below this level could lead to a decline towards $171.78. On the other hand, a bounce back would open the way to the $186.40 and $190.47 areas.
Short-Term Weakness and Cooling Activity: Despite growing by over 40% in July, there is now a decline in on-chain activity:
Active Addresses Down 16%
DeFi TVL Down 8%
This could increase bearish pressure in the short term.
Resistance on the 4-hour chart: According to Seeking Alpha, SOL faces strong resistance at the 20-EMA (~$164.78) and below the 50/100-EMA zones (between $170.73 and $174.14), while the downtrend remains dominant.
Structure overview and signals
TipRanks indicators:
General recommendation: Sell
RSI (~43.05): Neutral
MACD: Buy
Stochastic RSI, Williams %R, CCI: Buy
MA 20/50/200: mostly Sell, except MA100 (was Buy)
TipRanks
Support and resistance by Pivot (TipRanks):
Pivot: $166.49
Support: $163.12, $158.24, $154.87
Resistance: $171.38, $174.74, $179.6
Ideal FBD on SOL with UWAPAug 25. FBD of cluster of lows from July 10-16. 6 day balance.. Combine the FBD with UWAP (Unbound WAP High Timeframe Adjustable Pin. A+ setup

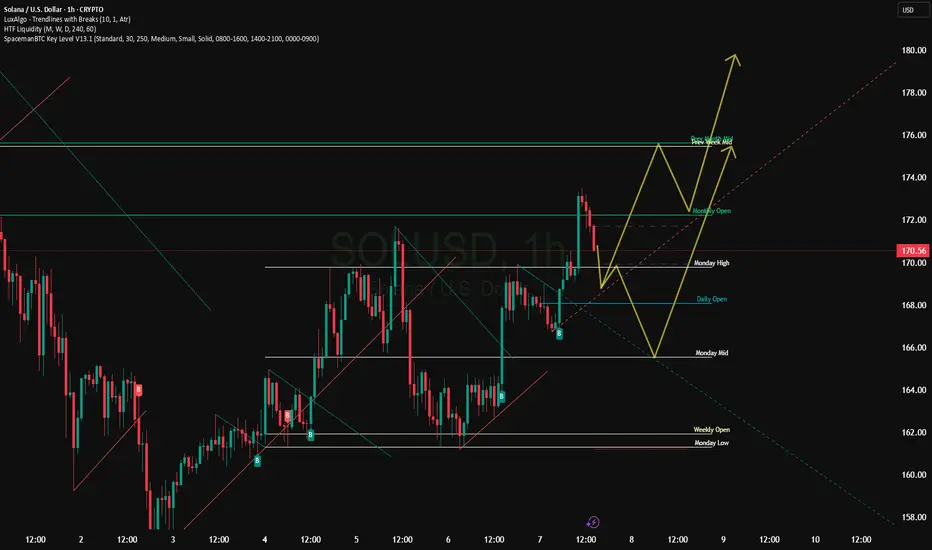
SOL/USDT – Price Action AnalysisKey Levels:
Day High: 171.83
Day Low: 161.46
Retracement Zone: Focus on the yellow zone for possible entry
Key Concepts:
Bullish Bias: The market is currently showing potential to move upward after testing the Bearish Bias zone at 164.16. A breakout above the retracement zone could lead to upward momentum toward the Day High.
CHoCH (Change of Character): The market is hinting at a potential shift after breaking key resistance levels. Watch for confirmation of this shift.
Order Blocks (OB): Key levels to consider for potential entries and exits. Watch closely around the highlighted OB areas.
FVG (Fair Value Gap): Pay attention to any potential gaps forming on the chart for price continuation or reversal.
Potential Setups:
Bullish Setup: Entry above the retracement zone, targeting 170.00 – 171.83.
Bearish Setup: If price retraces and breaks below 161.95, look for targets toward 158.00.
Trading Tip:
Stay patient and observe the price action at critical levels.
If price fails to hold above the Retracement Zone, consider switching to a bearish outlook with targets set around 160.00.
Follow and support us for more Idea's

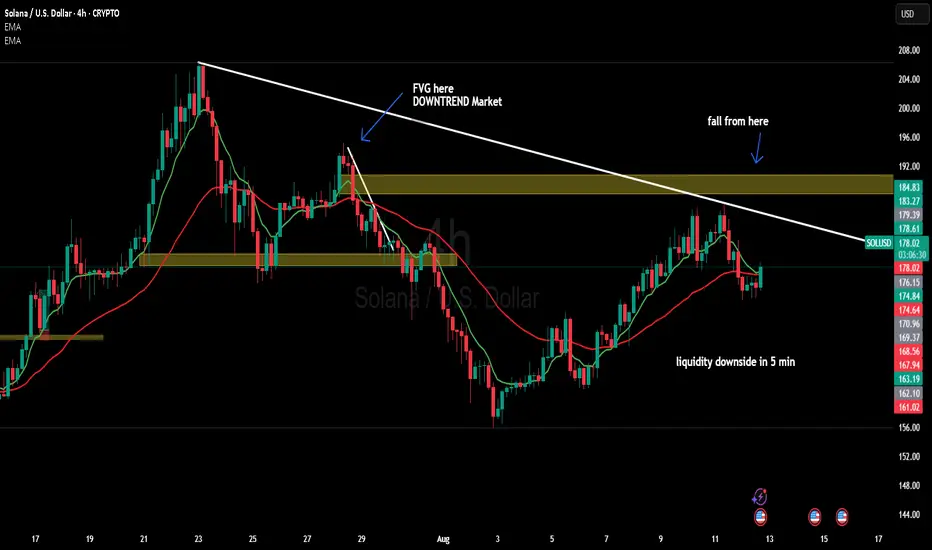
sol will go downward from the marked lineliquidity downside in 5 min,4 hr fbg formed,downtrend market structure and trendline rejection
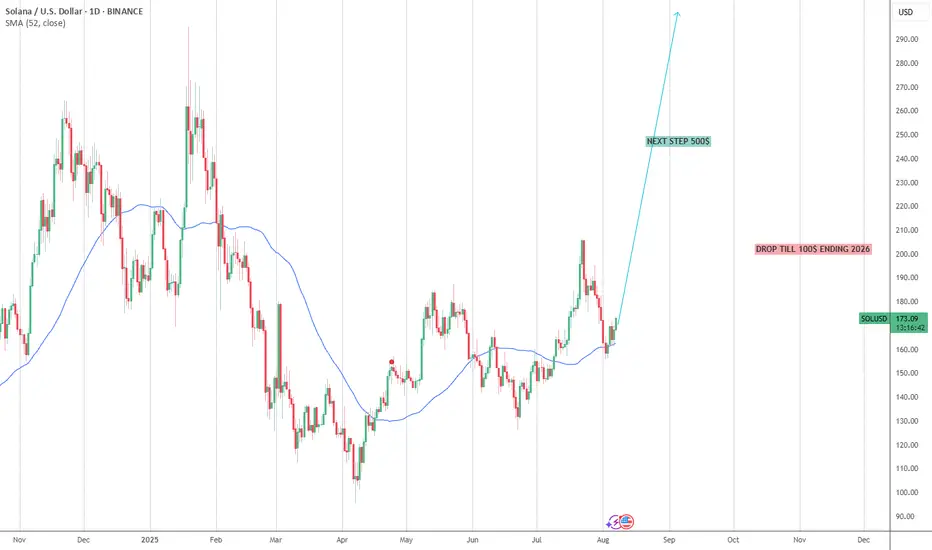
SOLANAIt will go up till 500-600$, then we´ll enter in ETF with PUT options with LEADS to visit 100$, and then spot again till 1200$.
Let´s dance...
GO GO GO.
SolanaSol usdt Daily analysis
Time frame daily
Risk rewards ratio >3.5 👈👌
Target 248$
Green line is a historical up trend for solana

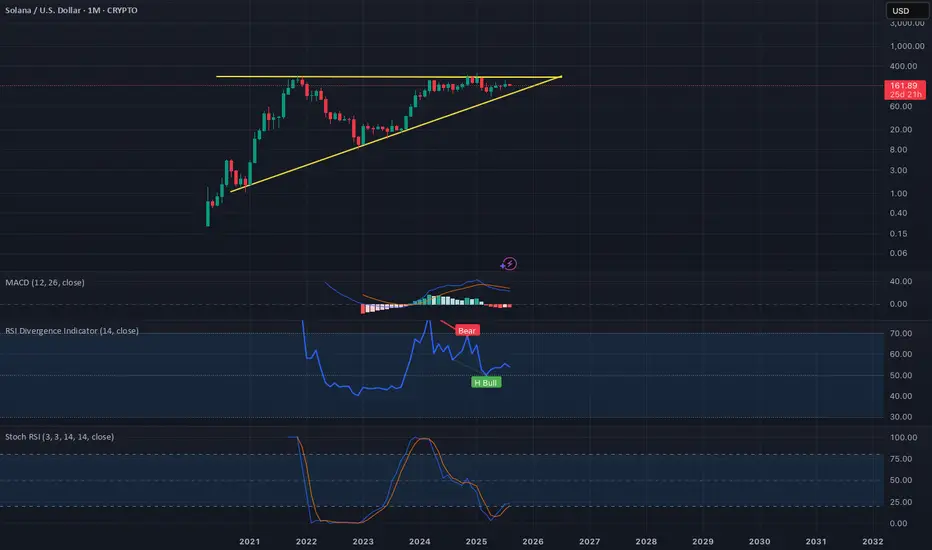
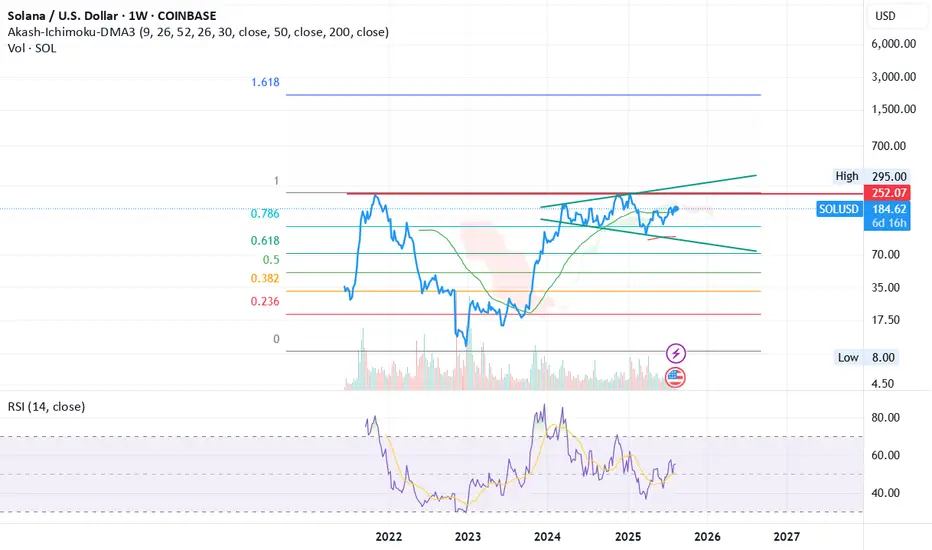
Solana looking bullish for a long trade.Solana has been trading in an ascending triangle since the top of the 2021 bull market. Ascending triangle is a bullish pattern. If Solana can close a few weekly candle and hold support at $250, it would be really bullish for Solana possibly head towards the $500-700 range.
Watch the stochastic RSI on the monthly closely, once it closes above the 20 level it will be bullish as momentum picks up, the last time it did this was in Jan 2023 than solan went from $8 to $295.
Happy Trading
Solana Short SetupHi everyone.
As I see a CHoCH in 1H TF, so I think this entry level has a good potential to set two sell order.
One with a tight SL that I suggest don't enter more than 0.5% of your capital for this, and the second one with a larger SL level.
I'll update the TP levels later...
Please consider the risk management.
Let's see the market reaction..
Dear traders, please support my ideas with your likes and comments to motivate me to publish more signals and analysis for you.
Best Regards
Navid Nazarian
Solana - The bullish background remains strongCurrent Technical Signals
SOL is trading around $180-$181, holding above the key 20-day EMA, which is around $178.25. A break below this level could open the way to support around $171.78, while holding above this level creates potential for a rise towards $186.40-$190.47.
A golden cross is forming between the 100- and 200-day EMAs on the daily chart - a classic bullish signal, strengthening the chances of a rise to $200.
Your network volume and balances on exchanges are showing a decline, which indicates a decrease in supply - easing pressure on the price and supporting bullish sentiment.
Support and Resistance
Support:
$178.25 (20‑EMA)
$171.78 — lower limit in weak market
The Currency analytics
Resistance:
$180–$190 zone — critical for further gains
Upper resistance at ~$200 — critical for rally continuation
Structural and Valuation Signals
A test of the daily bullish divergence on SOL indicates potential for further gains after correction.
SOL recently broke out of its ascending channel, indicating a possible reversal and the beginning of a new move higher.
Finance Feeds

On our way to a new ATH for SOLUSD?This is a possible scenario idea I have in mind for SOLUSD that I want to share with everyone.
Keep in mind that this is not an advice to buy, it should be your decision to buy this specific asset.
There are 4 reasons I am thinking that we are (still) on our way to a new ATH for Solana and why I am extremely bullish on this specific crypto asset:
1. The orange man is pushing the FED for rate cuts for weeks: there already are some numbers (f.e. low inflation) out there that this might happen THIS week!
2. There is enough volume on 150$ & 170$ levels. We will are still on our way up!
3. The common crypto cycle is still happening: BTCUSD have bounced perfectly from the 112$k level and continued to move up, whales and other big guys are still buying BTCUSD at this time which is very bullish (another ATH is inevitable!) -> if the cycle repeats itself, BTCUSD will probably crash afterwards just like previous cycles -> this will be followed by a new ATH for ETHUSD -> after that, SOLUSD will be the next one to set a new ATH afterwards, just like back in Q4 2024 & Q1 2025. The higher ETHUSD will go the better it will be for alt coins like our baby Solana.
4. Solana is not even close to its former ATH: stepping in right now, will make larger profits later.
5. Last but not least: ETF approvals are still on the way!
The ATH I have in mind that will be set for Solana will be between 400$-600$ or with some luck, even higher.
Some people might not be happy in the way SOLUSD is performing right now, but I only learned one thing: that patience makes money when it comes to crypto. For everyone that is thinking about stepping in, I think there is still time to make profit from here on (but then again, of course at own risk, at all times!).
Another thing I want to add to this idea is to watch out for the first retracement/resistant level: this might be around 225$-234$ as shown in this Graph. Because there was more selling volume in Q1 2025 at that level.
Hope you liked my idea & graph about SOLUSD. Good day and happy trading everyone!

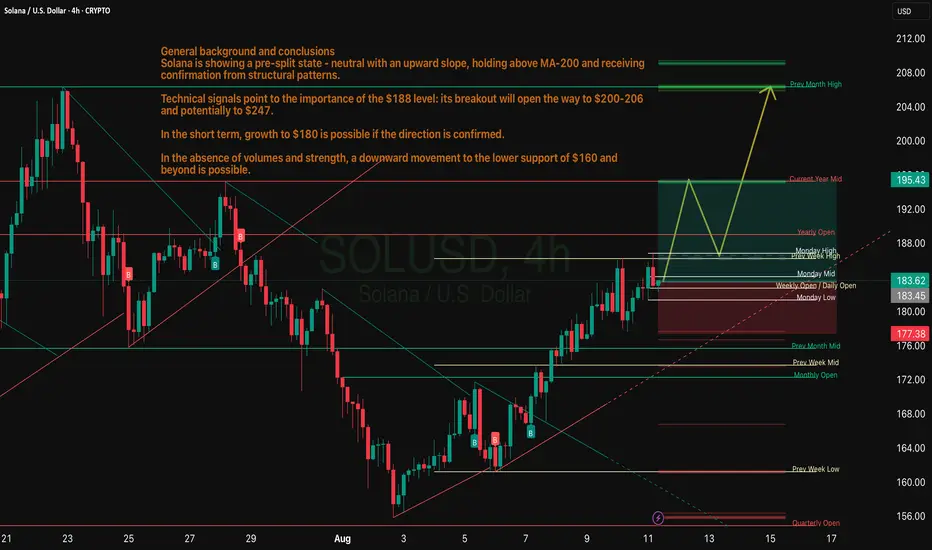
Solana - Don't miss it General background and conclusions
Solana is showing a pre-split state - neutral with an upward slope, holding above MA-200 and receiving confirmation from structural patterns.
Technical signals point to the importance of the $188 level: its breakout will open the way to $200-206 and potentially to $247.
In the short term, growth to $180 is possible if the direction is confirmed.
In the absence of volumes and strength, a downward movement to the lower support of $160 and further is possible.
Recommendations
Strategy "buy on breakout": entry at the close and holding above $188 with a target of $200-206. Alternative: buy on dip to $160 in case of a technical rebound.
Stop loss: it is reasonable to place it just below $160.
Additional monitoring: It is important to monitor the dynamics of volumes, price behavior around $188, as well as the development of fundamental drivers (ETF, Firedancer, etc.) in order to clarify the movement scenario.
SOLUSD🐊 SOLUSD – Alligator Entry (Buy Call)
📈 HHs & HLs in formation
🔍 Wait for resistance breakout ➡️ retest ➡️ bullish candle confirmation
🎯 Entry: 🔼 Marked on chart
🛡 SL: ⛔ Marked on chart
💰 TP: 🎯 Marked on chart

$200 soon - SOL weekly update August 12 - 18thFrom an Elliott Wave perspective, the scenario for Solana has been slightly adjusted from previous counts. Current price action suggests that SOL is already in an impulsive upward move, which aligns well with the broader correlation observed across the altcoin market. As with many other altcoins, the structure shows a completed 1–2 sequence at the Primary degree and another 1–2 sequence at the Intermediate degree. At the Minor degree, price is in the final stages of Wave 1, specifically in Minute Wave 5.
An alternative scenario — less likely but still possible — is that the move is actually a corrective structure, with the Minor degree currently forming Wave C. This would become more probable if price extends significantly beyond the 1.618 Fibonacci extension, as such behaviour would be atypical for a standard fifth wave.
From a liquidity standpoint, short- to medium-term bias points upward. The liquidity heatmap shows a large concentration of liquidity at the local high of Wave 3, as well as significant order clusters near the 1.0 extension target for the current Wave 5. However, substantial liquidity is also accumulating below current price, which will likely be targeted during the subsequent Wave 2 retracement.
Funding rates have shifted from slightly negative toward positive territory, and open interest is climbing — both signs of a stable and sustained upward move.
Macro conditions also support the current market tone. The latest CPI data came in at 2.7%, better than expected, boosting sentiment. As the FOMC meeting approaches, retail traders are increasingly positioning for a potential “altseason” — a dynamic that raises the probability of a sell-the-news event if expectations are overextended.
Given the current wave structure, liquidity positioning, and macro backdrop, the 1.0 Fibonacci extension level has been set as the primary target for the completion of this Minor Wave 5. This area aligns with heavy order clustering and fits the typical profile for a fifth wave termination before a corrective phase.
Do your own research — and trade safe.

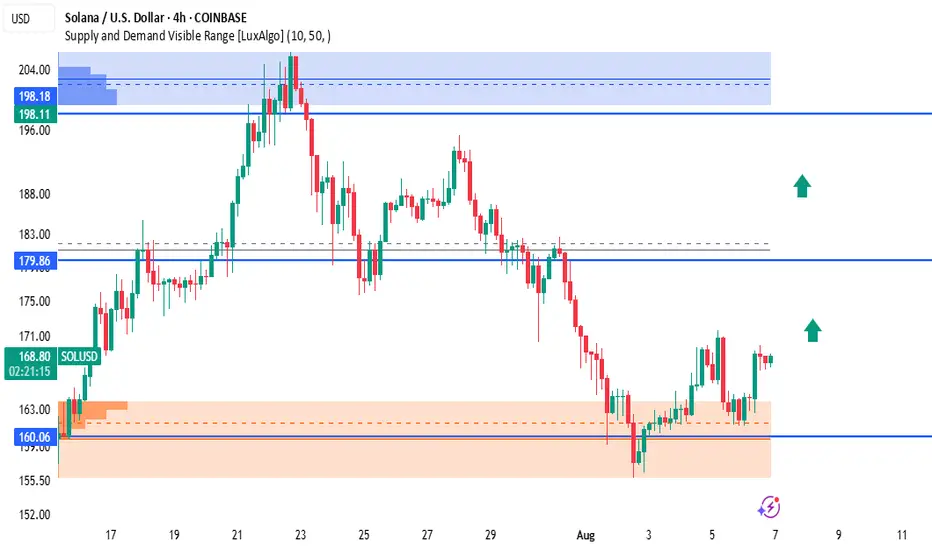
SOLUSD – Demand Zone Reversal in ProgressSolana is showing strong bullish signs after rejecting the demand zone around $160.06, forming a short-term higher low and beginning to climb. The current structure suggests momentum is shifting back to the upside, targeting key resistance levels.
🔹 Key Zones & Levels:
🟠 Demand Zone (Support): $157.00 – $160.06
🔵 Mid Resistance: $179.86 – Prior support turned resistance
🔵 Major Supply Zone: $198.11 – $198.18 (Previous peak area with strong sell pressure)
🟢 Bullish Outlook:
If SOLUSD maintains this upward momentum:
Target 1: $179.86
Target 2: $198.18
Green arrows on the chart highlight the expected bullish path as long as price holds above the demand zone.
📌 Trade Setup (Example):
Long Setup:
Entry: $165 – $169 (current zone)
SL: Below $159
TP1: $179.86
TP2: $198.18
⚠️ Risk Note:
A 4H close below $157 would invalidate this bullish bias.
Wait for strong bullish confirmation like a break and retest above $170 before going heavy.
💬 Follow for more Solana price action updates.
📊 #SOLUSD #Solana #CryptoAnalysis #DemandZone #PriceAction #SmartMoney #TradingView
Solana – Momentum Continues After \$155 LaunchpadTrend:
SOL rallied from \$155 support and is now trading well above both the 50 EMA and 200 EMA on 4H/Daily charts.
Strong uptrend with higher highs and higher lows in place.
Pattern:
Breakout from ascending channel retest at \$155 triggered fresh buying.
Price is currently approaching resistance near \$185–\$188, which, if broken, opens the path to \$200+.
Key Levels:
Support: \$172, \$165, \$155 (major swing low)
Resistance: \$185, \$200, \$215
Breakout Trigger: 4H close above \$185 on strong volume
Indicators:
RSI remains in bullish zone (65–70), showing strength without extreme overbought conditions.
MACD still in bullish crossover with widening histogram.
Volume increasing on upswings, confirming buyer dominance.
Trade Plan:
Entry: Buy pullbacks to \$172–\$175 OR breakout above \$185 with volume
Stop-loss: Below \$165 (swing low)
TP1: \$200
TP2: \$215
TP3: \$230 (if momentum accelerates)
Bias: Bullish while price holds above \$165.
📈 SOL’s rebound from \$155 has shifted market sentiment firmly bullish. A breakout above \$185 could be the ignition point for a run into the \$200–\$230 range.
"SOL/USD BULLISH HEIST! Steal Profits Like a Pro"🏆 "SOLANA HEIST ALERT! 🚨 Bullish Loot Ahead – Thief Trading Style (SOL/USD)" 🏆
💸 Steal Profits Like a Pro – Day/Swing Trade Plan 💸
🌟 Greetings, Market Pirates & Profit Raiders! 🌟
Hola! Bonjour! Hallo! Marhaba! 🤑 Dear Thieves & Trend Snipers, the SOL/USD vault is WIDE OPEN! Time to execute the heist with precision.
🔥 THIEF TRADING MASTER PLAN 🔥
🎯 Mission: LONG SOLANA (Escape Near Blue ATR Line)
⚠️ Danger Zone: Overbought | Consolidation | Bear Trap Ahead
🏆 Rule: "Take Profit & Treat Yourself – You’ve Earned It!" 💪💰
📈 ENTRY STRATEGY (The Heist Begins!)
"SWIPE THE BULLISH LOOT!" – Enter at any price, but smart thieves use:
Buy Limit Orders (15-30min timeframe)
Swing Low/High Pullbacks for optimal entry
DCA/Layering Strategy (Multiple limit orders for max loot)
🛑 STOP-LOSS (Escape Plan)
📍 Thief SL: Below nearest low (Daily MA @ $160.00)
⚠️ Adjust SL based on: Risk tolerance, lot size, & DCA layers.
Pro Tip: Tighten SL if market flips bearish!
🎯 TARGETS (Profit Escape Routes)
🎯 Main Take-Profit: $220.00 (or exit earlier if momentum fades)
🧲 Scalpers: Only LONG! Use trailing SL to lock gains.
💰 Big Bank Thieves: Go all-in. Smaller Raiders: Join swing traders.
📰 WHY SOLANA? (Fundamental Boosters)
Bullish Momentum (Tech + Sentiment Driving Price)
Macro Trends, On-Chain Signals 👉 Check Liinkss 🔗
Intermarket Analysis: Crypto & equities syncing for gains!
⚠️ TRADING ALERTS (News & Risk Control)
🚨 News = VOLATILITY! Avoid new trades during major releases.
🔒 Protect Running Trades: Use trailing stops to secure profits.
💥 SUPPORT THE HEIST! (Boost & Win Together) 💥
🔥 Hit the "LIKE" & "BOOST" button to strengthen our Thief Trading Squad!
🚀 More Heist Plans Coming Soon – Stay Tuned! 🤑🎉
📌 Reminder: This is NOT financial advice – DYOR & manage risk!
