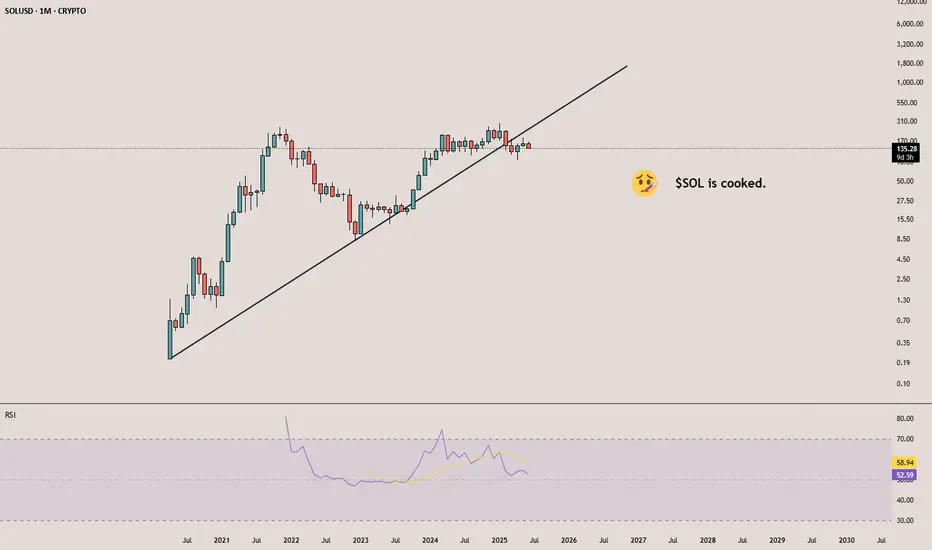
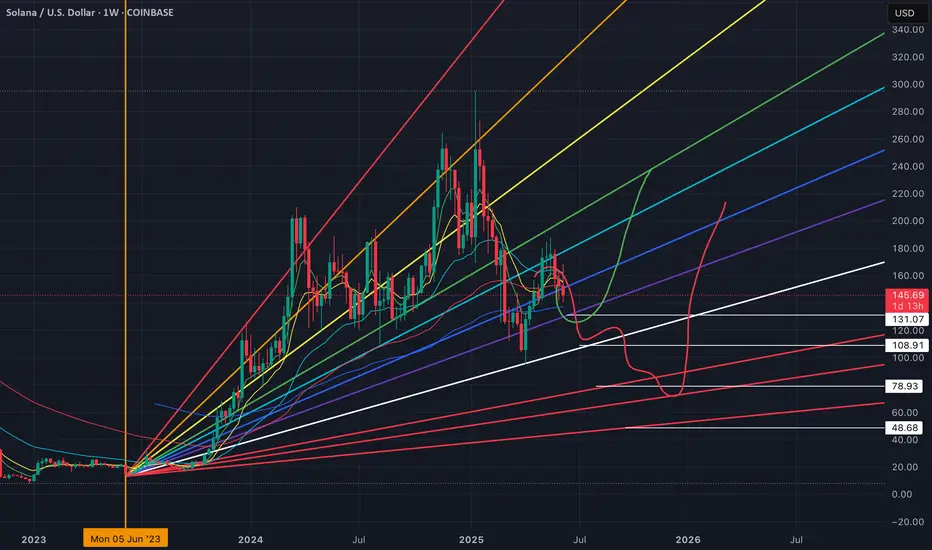
Solana is cookedYou can clearly see that in the monthly timeframe, CRYPTOCAP:SOL retests the support trendline after breaking it and now, it's joever - Solana is now cooked.
SOLUSD trade ideas
$SOL Local Bottom FormingCRYPTOCAP:SOL closed the day back within the POI.
RSI oversold.
Should see a retest ~$136 to confirm the local bottom.
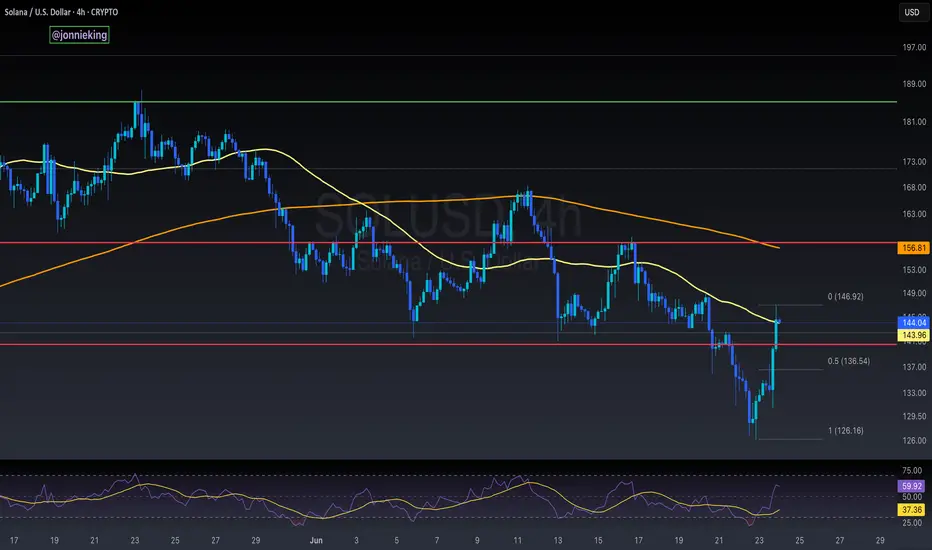
Daily EMA 55 needs to move above EMA 200!!
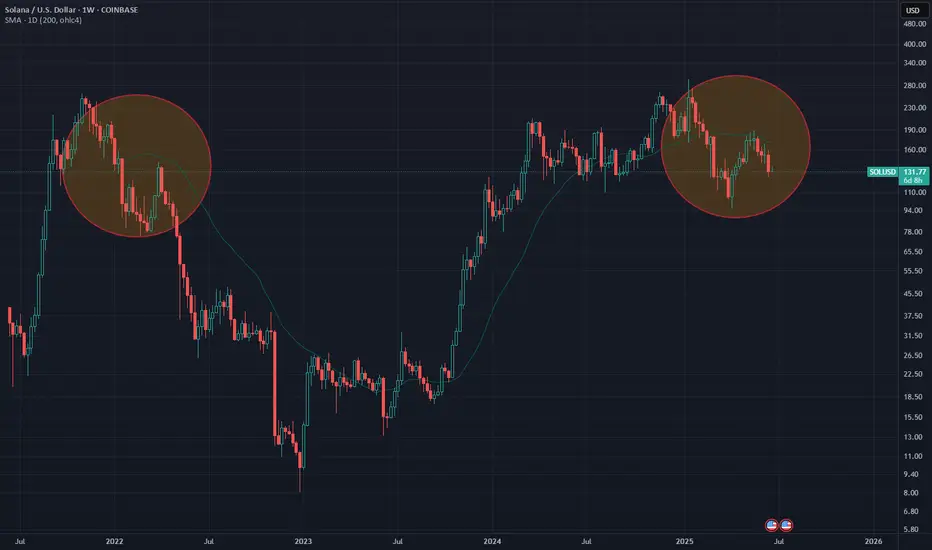
My general bias for Solana is bullish. However, the current setup is very similar to the setup in Feb-Apr 2022 before Solana started a macro bear trend. (see blue rectangular box)
I am still waiting for a long trade opportunity. I am not looking for a short trade. I just need to sit tight and see how the price is going to unfold in the next few months in the daily chart.
The 2022 setup (see blue rectangular box in the chart):
1) EMA55 crossed below EMA 200 on 16th Feb 2022. (red vertical line in the chart)
2)The price found the temporary floor around $80 and sharply moved above both EMA55 and
200. (see light blue rectangular box)
3) It was the dead cat bounce. It was the beginning of the macro down trend.
4)The price spent months and months under $40 in 22 and 23, however, the price eventually
broke above both EMA 55 and 200 and when EMA55 crossed above EMA 200 in Oct
2023 (red vertical line in the chart), the macro bull trend started.
The current setup (see orange rectangular box in the chart):
1) EMA 55 crossed below EMA 200 on the 4th March 2025.
2) The price moved down to $95 area and sharply moved above both EMA 55 and EMA200. However, it failed to stay above them.
3) The price has been oscillating between $140 and $18. The price is still below EMA55 and EMA200. (see orange rectangular block)
In order to start a strong bull trend,
1) the price needs to close and stay above EMA 55 and EMA200.
2) EMA 55 needs to cross and stay above EMA 200. EMA55>EMA200
3) MACD and RSI need to enter the bull zone.
EMA55 and EMA200 do not cross easily (I mean decisively cross). It only happened three times since 2022, however, when they cross, the price moves very aggressively in one direction.
I think Solana is bullish fundamentally. I am not suggesting it is going to start the macro bear cycle. I am pointing out the price is still not showing a clear direction. From a technical analysis point of view, it might take some time before the trend forms. For now, it is only testing my patience!

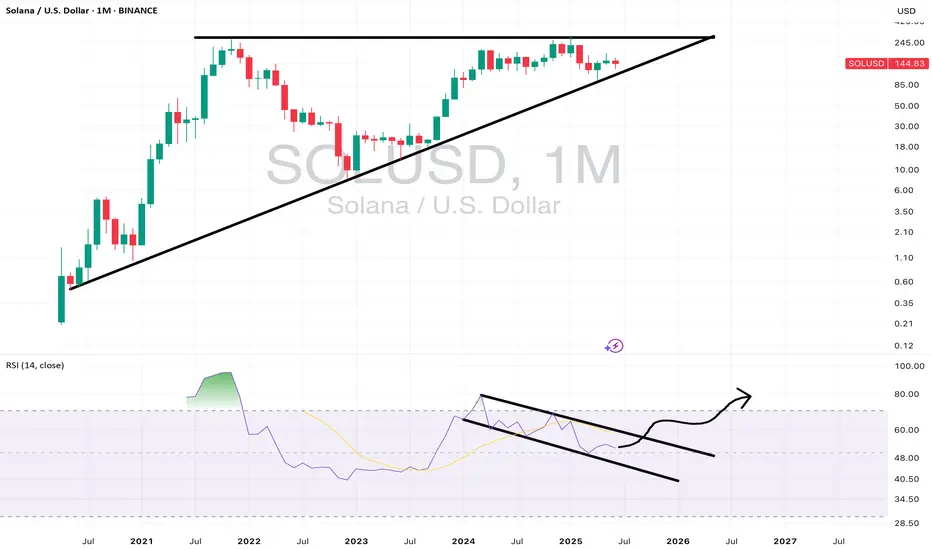
Solana is ready to pumpYou can clearly see that in the monthly timeframe, SOL is holding macro support and is well-positioned to push to new ATH into 2026 as the Fed cuts rates, BTC trends higher, and we see an alt season of sorts. Solana is read to pump.
Solana looks scary. I don't like this rejection from the 1D 200MA.
Looking at the the weekly chart, it is very easy to see the similarity to 2022.
Maybe we should brace for impact?
Solana: Still bullish about this cryptoHello,
I see the current price is at a great value price for Solana investors. The market has corrected by over 22% over the recent 36 days. The MACD is also showing signs of bullish zero crossover further reinforcing that the price is at a good place for bullish investors to begin coming in.
We urge investors who would like exposure to this coin to consider entering at the current price. Please have your stop loss below the trendline and your short-term target at $191.
Disclosure: I am part of Trade Nation's Influencer program and receive a monthly fee for using their TradingView charts in my analysis.

Wait for SOLSOL has been attempting to break through its current all-time high.
At present, price action is pulling back and may soon retest the long-term support trendline.
It’s best to patiently wait for SOL to reach the identified buy zone, as outlined in the chart.
Disclaimer:
This analysis is based on my personnal views and is not a financial advice. Risk is under your control.
SOLUSD – Eroding Support, Soft Fade ModeSolana rejected from just above $150 and has been sliding gradually. Price is forming a descending channel, and intraday momentum remains weak. Support near $145 is being tested frequently, suggesting that buyers are losing strength. Expect either a breakdown below $145 or a bounce that will be critical to determine next direction. Short-term traders may look to fade rallies toward $148.50.

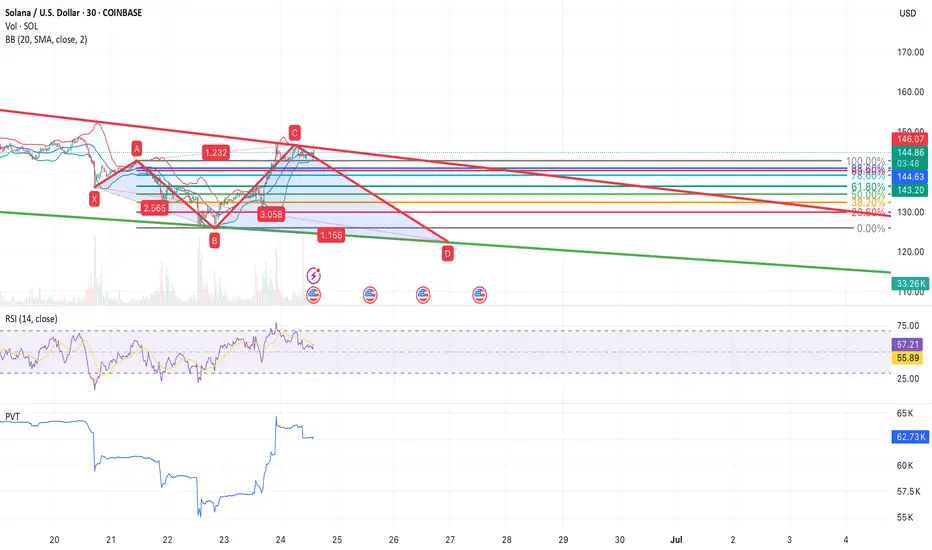
SOL/USDT – Bearish Harmonic Completion Near 144–145The 2H chart shows an extended X‑A‑B‑C‑D harmonic structure (an extended Bat/ABCD). Leg XA was the initial down-leg (from the recent swing high down to A), AB was a corrective pullback, and BC retraces sharply into the 88.6–100% zone of XA (around $144–$145). In a classic Bat/ABCD, the CD leg often completes near an 88.6% retracement of XA, so this C zone is a potential reversal point (PRZ). Importantly, C also sits on the chart’s long-term red descending trendline – a confluence of fib and trendline. A break below this level would “validate the bearish harmonic pattern,” with the downtrend line amplifying selling pressure. The projected D-point is ~$122.63 (late June/early July), which coincides with the lower green channel support on the chart.
Harmonic pattern (2H SOL/USDT): XA and AB moves set up a deep BC up into the 88.6–100% fib zone (around $144–145) at C. This confluence of fib levels and the macro descending trendline makes C a strong Potential Reversal Zone (PRZ). The CD leg targets ~122.63, aligning with lower channel support (green). Across timeframes the momentum is waning into point C. RSI is rolling over – price made a lower high while RSI failed to confirm (a classic bearish divergence). Meanwhile, the PVT (Price Volume Trend) line has flattened even as price crept higher, indicating the rally is not supported by volume.
Volume patterns also signal distribution: rallies into C have occurred on declining volume, a textbook sign that buying interest is drying up. Wyckoff distribution theory notes that as a top forms, “rallies during this stage often show lower volume” and ensuing drops on higher volume. In short, weakening RSI, a flat PVT, and thinning volume all confirm the selling pressure around $144–$145, consistent with a bearish reversal at C. Momentum and volume (15m SOL/USDT): RSI has peaked lower while price nears $145, and PVT has flattened (highlighted). Rallies into C come on lower volume, matching Wyckoff distribution cues. These divergences suggest the upward move into C is exhausted.
Trade Plan & Risk Management
Entry: Short initiated at $145.00 (near the PRZ around C).
Stop Loss: $146.20 (just above the red trendline and invalidation of point C).
Take Profit Targets:
TP1 : $129.00 (minor fib support, ~61.8% retrace of the last swing).
TP2: $122.63 (harmonic D projection and channel support).
TP3: $120.00 (extension to lower channel boundary).
Confirmation: Watch for a break of the short-term support at ~$139.50 for added conviction before letting profits run.
Note: A short position was opened at $145. This outline is for informational purposes – it is not financial advice. Trade with proper risk management.
Each target corresponds to technical levels (fib retracements and channel support). The first target aligns with a ~61.8% retracement (common fib TP level), and the final targets sit on the longer-term channel floor. If price breaks under $139.50, it would further confirm the bearish thesis.
SOLANA Eyes Recovery After Retesting Monthly LowFenzoFx—Currently, SOL/USD trades at approximately $148.37, testing the previous monthly low, which aligns with a bullish fair value gap and is backed by a high-volume node area.
A close and stabilization above $149.3 can spark the uptrend. In this scenario, the next bullish target could be the $168.38 resistance.

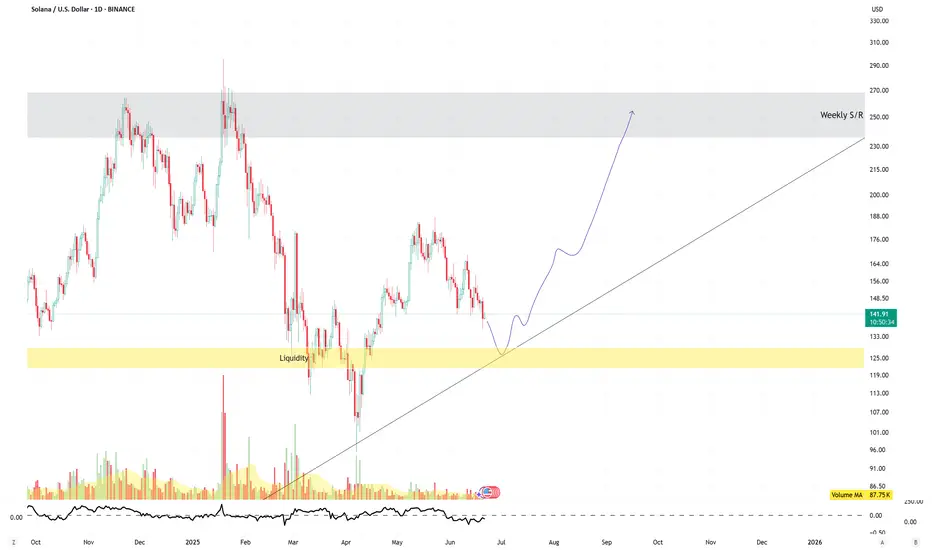
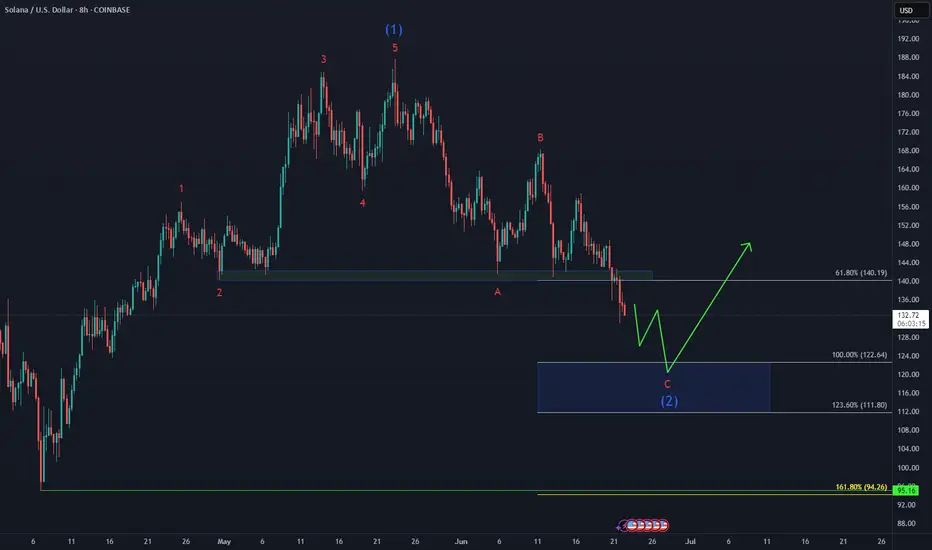
Solana Next Buying Zone on WatchCRYPTO:SOLUSD is correcting the 5 waves advance from April low within a 3 waves ZigZag structure and as price slipped to a new marginal low beneath last week’s support, signaling potential weakness toward equal legs area$122 - $111 before buyers look to step in again.
Keeping an eye on reactions in this zone—could set up for a bullish reversal once demand kicks in!
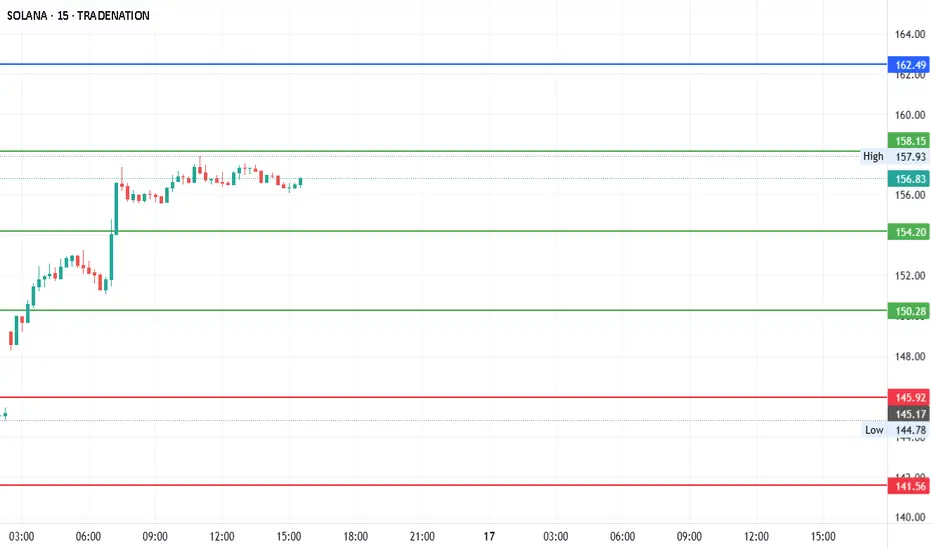
#SOLANA - Pivot Point is $154.20Date: 16-06-2025
#Solana Current Price: 156.37
Pivot Point: 154.20 Support: 150.28 Resistance: 158.15
#Solana Upside Targets:
Target 1: 162.49
Target 2: 166.84
Target 3: 171.58
Target 4: 176.32
#Solana Downside Targets:
Target 1: 145.92
Target 2: 141.56
Target 3: 136.82
Target 4: 132.08
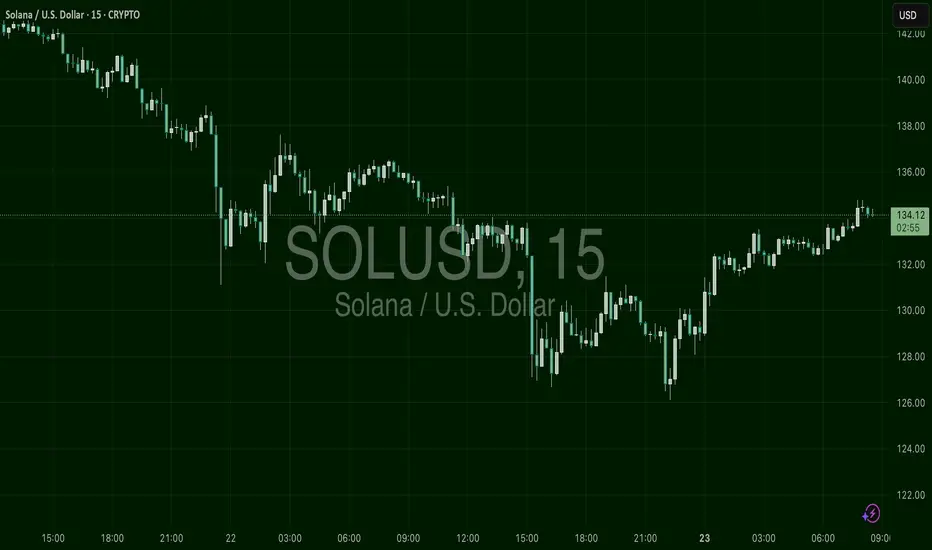
SOLUSD – Reversal Ignition ZoneSOL printed a textbook reversal. After getting slammed down to $126, it found strong support and printed a clean stair-step rise back into $134. Momentum is solid, and higher lows are stacking. The $132.50–$133.00 region now acts as demand. If price pulls back slightly and holds, expect a measured move toward $135.50–$136.50.
Solana bag holders could soon be under pressureSOL prices are getting squeezed, and the price appears stuck in a descending triangle pattern, with a 20% downside potential if key levels break. Weighing on prices are the US economic slowdown and the Israel-Iran war. On the flip side, we may soon hear from the US government, with the President’s Working Group on Crypto expected to release their report before 22 July.
What’s your take on SOL? Will bullish or bearish forces prevail?
This content is not directed to residents of the EU or UK. Any opinions, news, research, analyses, prices or other information contained on this website is provided as general market commentary and does not constitute investment advice. ThinkMarkets will not accept liability for any loss or damage including, without limitation, to any loss of profit which may arise directly or indirectly from use of or reliance on such information.

Hey, investors on crypto, All what do you have to know if really If really you want invest your money in crypto SOLANA . This simple analytics but safely for your wallet.
This is best area you should be waiting to buy if you are investor.
price between 84.00$ to 52$.

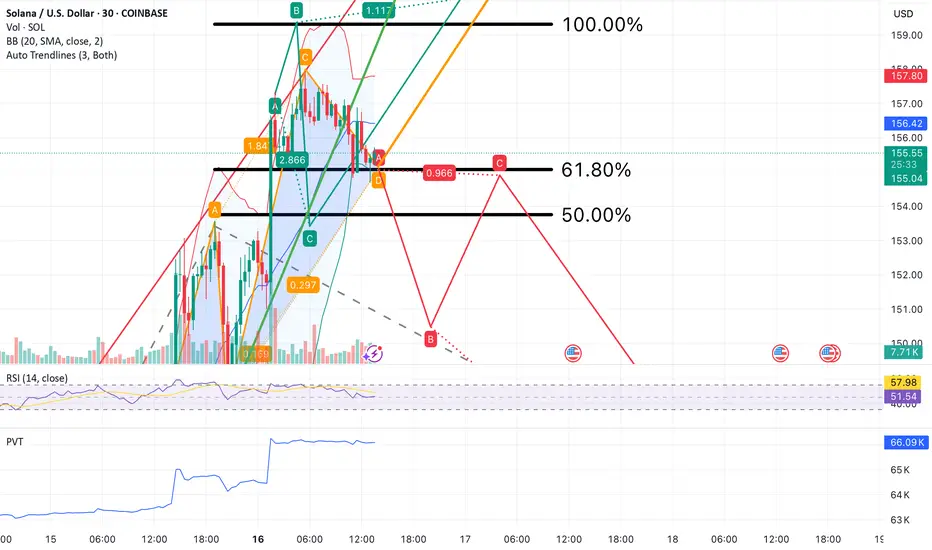
SOL/USDT at Key Inflection Point – Breakout or Rejection?Solana (SOL) is trading at a pivotal zone where price structure, harmonic patterns, and key technical indicators converge. This setup outlines three potential scenarios, guided by fib levels, auto trendlines, and momentum indicators.
Orange Scenario (Moderate Bullish):
Price has recently bounced off the 0.618 Fibonacci retracement (~$149.50), suggesting short-term bullish momentum. However, the orange path indicates a likely move toward resistance around $153–$154.50, where previous structure and upper Bollinger Bands align. Without strong confirmation (e.g., volume spike or RSI breakout), this area may reject further upward movement and trigger a reversal.
Green Scenario (Confirmed Bullish Breakout):
A decisive break and close above $154.50, supported by increasing volume and RSI holding above 60, would signal a breakout continuation. In this case, price may target $158 to $160, completing the bullish harmonic projection and extending the current trend structure.
Red Scenario (Bearish Breakdown):
Failure to hold the $148–$149 zone would validate the bearish harmonic pattern. If confirmed, this breakdown opens room toward lower support zones at $142.50 and $136, especially if PVT weakens further and RSI dips below 50. Downside pressure would likely be amplified by the prevailing downward trendline.
Indicators Used:
Bollinger Bands (BB 20, 2)
Relative Strength Index (RSI 14) with moving average overlay
Price Volume Trend (PVT)
Auto-generated trendlines
Harmonic Patterns (ABCD and XABCD)
Fibonacci retracement and extension levels
Bias:
Neutral at the moment. Awaiting confirmation via price reaction at key support and resistance levels.
Strategy Outline:
Bullish if price breaks and holds above $154.50 (targets: $158–$160)
Bearish if price breaks below $148 (targets: $142.50 / $136)
Short-term scalping opportunity within $149–$153.75 zone pending further clarity
*This analysis is for informational and educational purposes only and does not constitute financial or investment advice. Trading cryptocurrencies involves significant risk and may not be suitable for all investors. Always conduct your own research and consult with a licensed financial advisor before making trading decisions. The author is not responsible for any losses incurred from reliance on this analysis.*
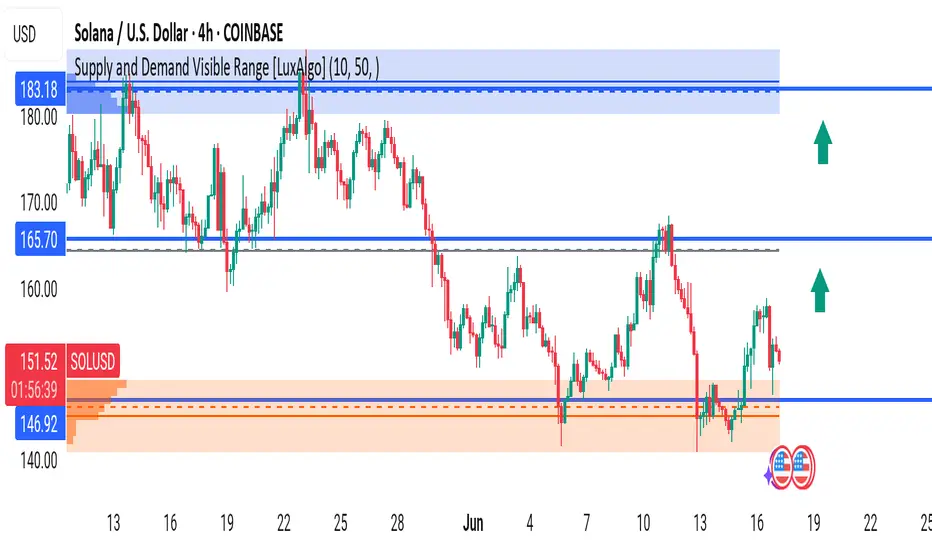
Solana (SOLUSD) 4H Analysis – Rejection From Demand ZoneSolana is showing strong signs of accumulation after tapping a key 4H demand zone. Price is now stabilizing above $146 and may be preparing for a bullish push toward key resistance levels.
📌 Key Technical Highlights:
🔸 Strong Demand Zone – $146.92 to $140.00:
This orange zone has served as a launchpad in the past, and recent bullish rejection suggests buyers are active again.
🔸 Mid-Range Resistance – $165.70:
A previous flip zone and potential short-term target. If SOLUSD holds above $146, this level is likely to be tested again soon.
🔸 Major Supply Zone – $183.18:
This level marks a strong overhead resistance from previous highs. A break above $165 would bring $183 into focus.
🔄 Current Market Behavior:
SOL recently formed a double-bottom structure at demand.
Price is now pulling back slightly after a short-term bounce.
If buyers defend the $146 level again, expect a new wave toward $165.
🎯 Trade Setup:
Buy Zone: $146–$150
TP1: $165
TP2: $183
Stop Loss: Below $140
🧠 Insights:
With market sentiment gradually improving across altcoins, Solana is looking primed for a relief rally. A breakout above $165 would invalidate the lower high structure and confirm a trend reversal on the 4H chart.
---
💬 What’s your take on SOL this week? Bullish or still cautious? Drop your thoughts below 👇
📍 Don’t forget to follow for real-time crypto setups and insights!
#Solana #SOLUSD #CryptoTrading #TechnicalAnalysis #FrankFx14 #PriceAction #DemandZone #BullishSetup #LuxAlgo #Altcoins #TradingView
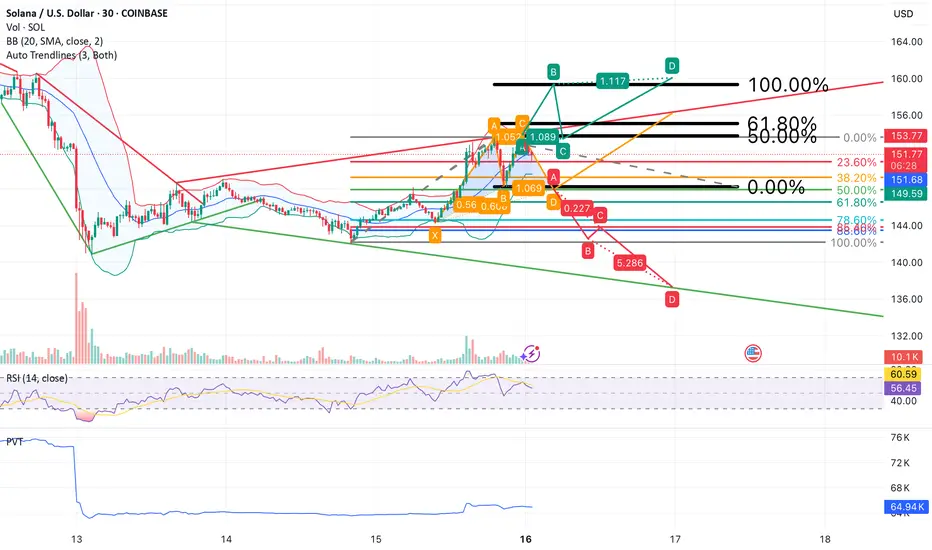
SOL/USDT at Key Inflection Point – Breakout or Rejection? Part 2Solana (SOL) is trading at a pivotal zone where price structure, harmonic patterns, and key technical indicators converge. This setup outlines three potential scenarios, guided by Fibonacci levels, auto trendlines, and momentum indicators.
Green Scenario (Confirmed Bullish Continuation)
A sustained hold above $155, especially if followed by a breakout through $156.50 with rising volume, would confirm the green path. This scenario reflects short-term bullish momentum strengthening, as RSI remains near 60 and PVT continues to climb. If confirmed, price may extend toward $160, with secondary targets in the $165–$172 range, aligning with the upper ascending trendline and harmonic extension.
Orange Scenario (Sideways-to-Bullish Consolidation)
This scenario becomes increasingly likely if SOL remains range-bound between $153.50 and $157.80. This consolidation zone overlays the 50–61.8% Fibonacci levels, Bollinger Band basis, and several key trendline intersections. With RSI holding in the 55–65 range and PVT stable, this setup would favor re-accumulation before another breakout attempt. Price action above $155 continues to support this scenario as the base case.
Red Scenario (Bearish Breakdown)
A breakdown below $153.50, especially if followed by a breach of $150 on high sell volume, would invalidate the bullish thesis. This scenario opens downside risk toward $147.35 and potentially $144.00–$140.00. RSI would likely drop below 50, and a flattening or declining PVT would confirm distribution. This path aligns with the broader red trendline and would indicate a rejection of the recent bullish breakout.
Indicators Used:
Bollinger Bands (BB 20, 2)
Relative Strength Index (RSI 14) with moving average overlay
Price Volume Trend (PVT)
Auto-generated trendlines
Harmonic Patterns (ABCD and XABCD)
Fibonacci Retracement and extension levels
Bias:
Short-term bullish if price holds above $155. Market structure, RSI, and PVT favor upward continuation or consolidation. A break below $153.50 would shift the bias toward neutral or bearish.
Strategy Outline:
Bullish if price breaks and holds above $156.50
Targets: $160 / $165 / $172
Bearish if price breaks below $150.00
Targets: $147.35 / $144.00 / $140.00
Scalping opportunity in the $153.50–$157.80 zone while awaiting directional confirmation
**This analysis is for informational and educational purposes only and does not constitute financial or investment advice. Trading cryptocurrencies involves significant risk and may not be suitable for all investors. Always conduct your own research and consult with a licensed financial advisor before making trading decisions. The author is not responsible for any losses incurred from reliance on this analysis.**
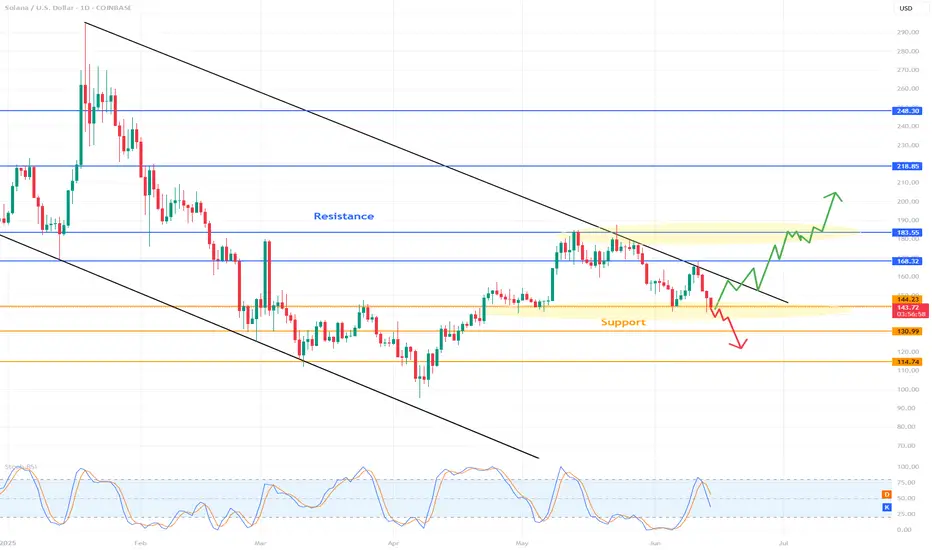
SOLUSD 1D Chart Review1. Main Trend
Downward Channel: Price moving in wide, downward channels (black trend lines), which means that the medium and long term remains bearish.
The upper trend line is a strong dynamic resistance, the lower one – support.
2. Key Horizontal
Resistance (Resistance):
$168.32: Strong resistance level, which it has responded to many times in the past.
$183.55: Another important resistance, confirmed by historical highs.
$218.85: Further resistance with an interval obligation.
$248.30: Very strong, long-term resistance (far from the current price for now).
Support (Support):
$144.23: actually occurs close to this support – very level.
$130.99: Another potential level where price could look for a rebound.
$114.74: Strong support, last bastion of bulls near March/April low.
3. Price action (Price action)
Last candles emitted pullback from downtrend line and down to support area of $144.23.
that any attempt to grow above trend line is limited by sellers.
$144.23 level currently existing short-term support - its loss may be available in case of $131 or possibly existing.
4. Indicator
Stochastic RSI (at the bottom of the chart):
Stochastic RSI indicator stated that airlines (blue and orange) were in power (overbought) in recent devices, but suddenly started to turn down.
Currently occurs in neutral zone, however application of protection (oversold). In case of threat occurrence now, it may suggest risk of attack, but it is not yet decided.
It is worth noting whether to go to the area of 20 and start turning back - in case of a necessary necessity.
5. Scenarios for the days
Bullish (growth):
Maintaining support at 144.23 USD and hitting the downtrend line (around 160-165 USD).
Breaking the trend line and resistance at 168.32 USD will give a signal to load in the area of 183-218 USD, but for the tenth time it seems to be less important, attention given the market structure.
Bearish (fall):
Breaking support at 144.23 USD and closing below on the daily candle - the next target to 131 USD, and then 114 USD.
The downtrend channel is still working against the bulls.
6. Summary
Main trend: downtrend.
Price: Close to support, but the risk of you leaving a big one.
Key horizontals: $144.23 (short-term support), $168.32 (main resistance).
Stochastic RSI: Heading towards oversold zone, but not yet giving a clear conclusion about a breakout.
Recommendation: Observe the application of price at $144.23 and the behavior of Stochastic RSI. In case of a breakout - it is possible that they will occur.
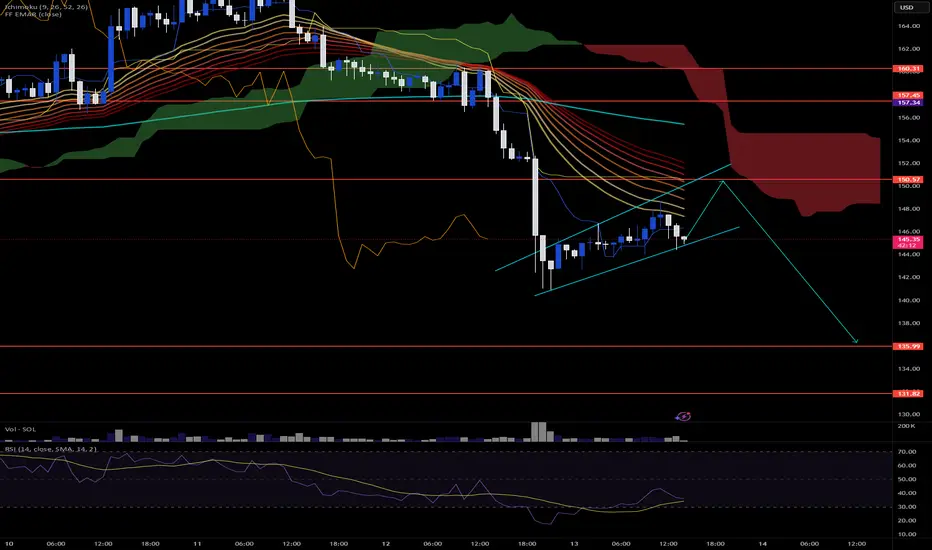
SOLUSD AnalysisFollowing the recent geopolitical tensions between Israel and Iran, we saw a sharp sell-off, which broke down from a key support zone. Currently, price action is consolidating within a rising wedge (bearish structure) on declining volume.
The trend remains bearish overall. I expect a potential relief bounce toward the $150 zone, where multiple EMAs and the edge of the Ichimoku cloud could act as resistance. If rejected there, my first downside target is $136 a key horizontal level from previous structure.
Keep in mind: this move is heavily news-driven, so headlines could continue to impact price action significantly.
RSI is still below 50 and struggling to break trendline resistance, which supports the bearish bias.
SOLANA SOL/USD Here's an important fan which shows me all the supports and resistances. Depends on the short-term move we'll realize the future. Ok thanks I'll try and call me back in time to see what the sho and I have no clue I think we
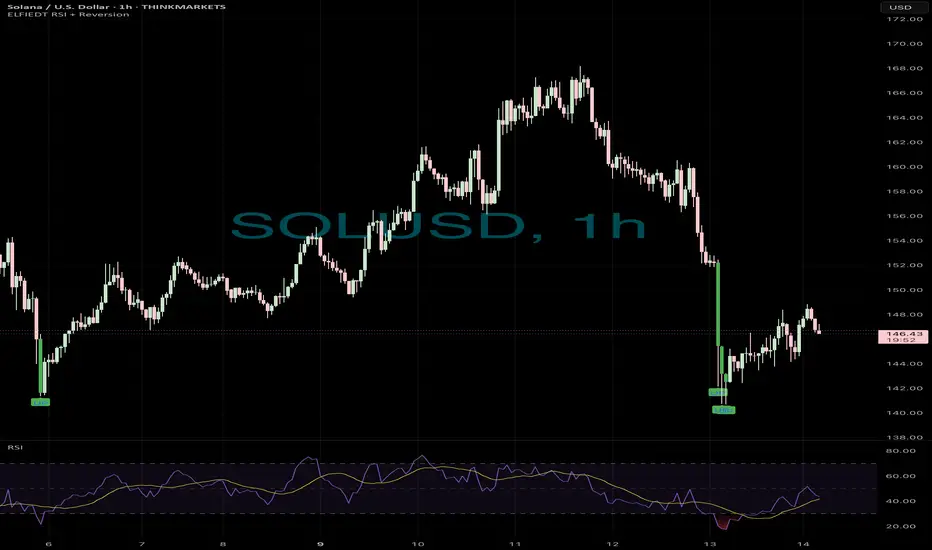
Boom📉 SOLUSD Reversion Entry – Capturing the Recovery
This chart shows a textbook example of how the ELFIEDT RSI + Reversion Strategy can help identify panic-driven lows and offer early reversal signals for a clean intraday recovery.
⸻
🟢 Signal Breakdown:
1. Sharp Drop into Oversold Territory
Solana (SOLUSD) experienced a large, fast selloff, breaking multiple support levels and triggering a flush in price. This type of move often represents emotional or news-driven liquidation — perfect for statistical reversion setups.
2. First “UP” Signal Printed at the Low
The strategy fired a buy signal just as price reached peak selling pressure:
• Price closed well below the lower volatility band
• RSI reached an extreme oversold zone
• The reversal candle marked the turning point
3. Second “UP” Signal on Confirmation
A follow-up signal printed one candle later, offering traders a second chance to enter the reversal with RSI already starting to recover upward.
4. Bounce Followed Shortly After
Price rallied from the lows, recovering several dollars in value and offering a strong mean reversion trade with limited downside risk.
⸻
✅ How Traders Could Have Used This Setup:
• Wait for the first “UP” label to print on a fast drop — especially after a vertical move like this
• Confirm with RSI turning up from deeply oversold conditions
• Use the low of the signal bar as your stop
• Target previous minor support/resistance or the moving average reversion zone as your first TP
⸻
💡 Why This Worked:
The trade worked well because:
• It was a statistical outlier move (rare volatility event)
• Volume and momentum exhaustion were confirmed by RSI
• The script visually identified the moment where price had likely stretched too far
⸻
This is exactly what the ELFIEDT strategy is designed for — catching those high-stress extremes where most traders panic, but structured reversion logic finds opportunity.
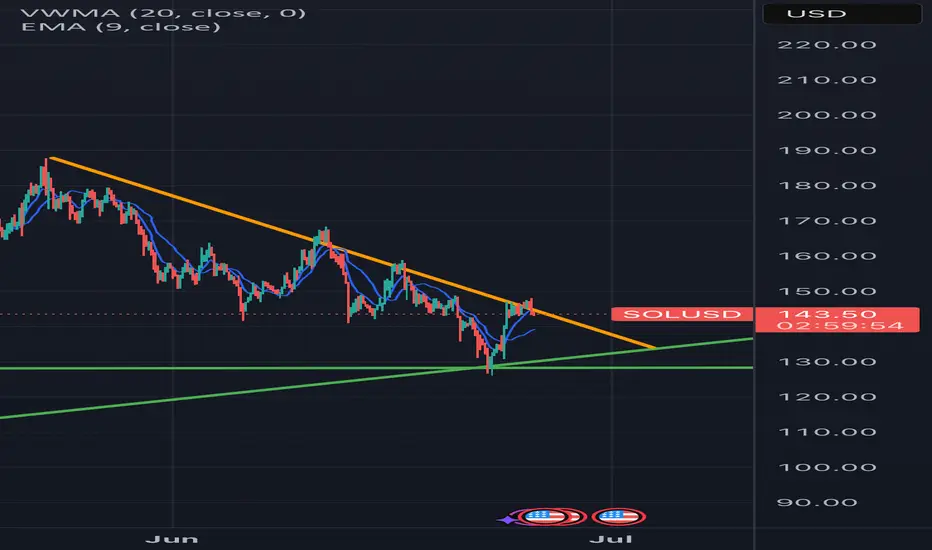
Possible retest of 130$ support line incomingLooking at the downtrend (shown in orange) the 130$ support line will probably be retested again. When we hold the same support line, we can expect another retest of 146$. Hopefully with a good result 🚀! Anyway, I am buying some more if this will happen (going long from 130$) because there was enough volume at that level.