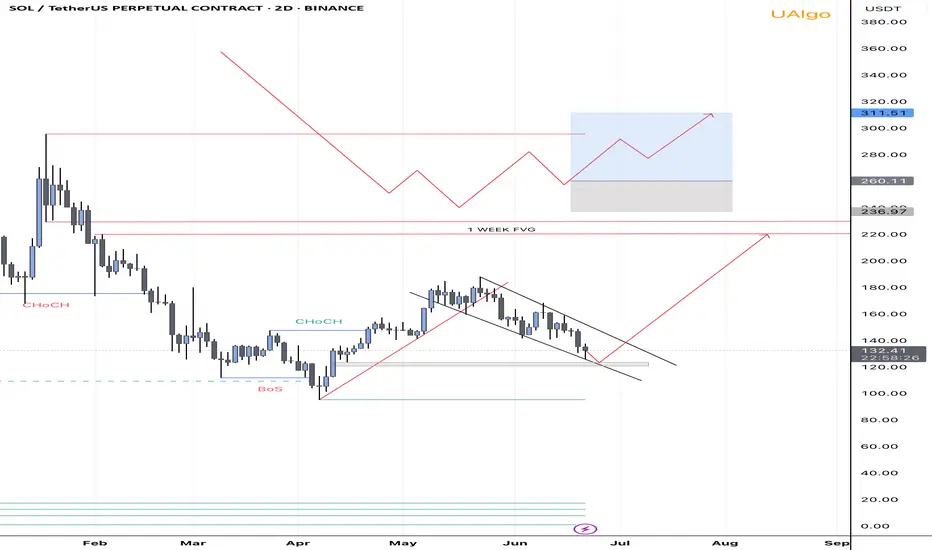
SOL 2D BULLISH, Entry points New HH coming up?So guy as we have seen a downtrend SOL from 180 price resistance and so now price trading on very critical area. We have fvg on 2D around 120-123 and still haven’t not been taken. So there is two scenarios and mostly like price will reject from fvg and head toward to W fvg which we have Above on Weekly TF. The confirmation will be respect to fvg and overall market conditions. Also I am bearish on SOL 2 weekly TF, which we should not forget. If price respect to fvg and overall market conditions was bullish then we can enter around 120-130 and TP will be 210-220
SOLUSDT.3S trade ideas
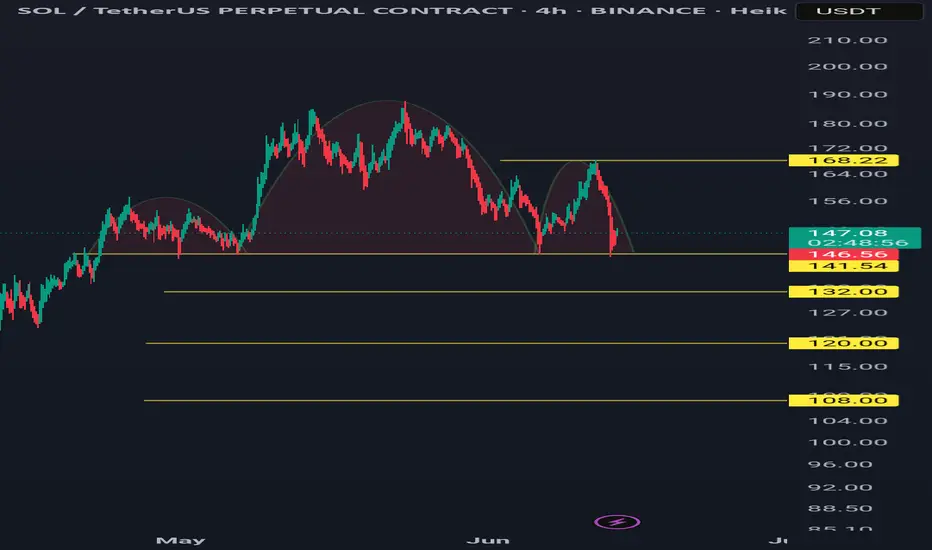
Solusdt 4hr tf bearishA bearish head and shoulders pattern is forming.
If it closes below 141.54 on the 4-hour timeframe, the pattern may be activated.
Targets are 132, 120, and 108.
Invalidation occurs if the high of the right shoulder (168.22) is broken.
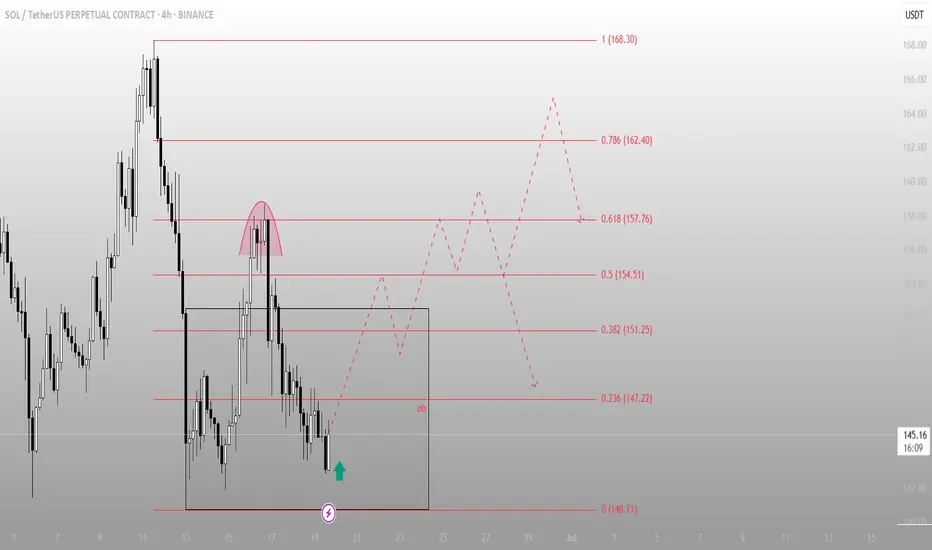
SOL – Sweep & Spring Play at Local DemandWe’ve got a clean rounded top → breakdown → demand sweep setup.
Current price action suggests a potential reversal is brewing.
🔍 What’s happening on this chart?
Rounded top marks a local distribution — aggressive short entries
Price broke lower, swept the demand zone (gray box), and now shows rejection wick + bullish reaction
Fibonacci levels mapped out the structure
0.5 = 154.51
0.618 = 157.76 = key resistance liquidity zone
🎯 Trade idea:
Entry: inside demand zone (OB marked on chart)
Target 1: 151.25
Target 2: 157.76 (0.618)
Full fill: 162.40 – 168.30 (complete inefficiency sweep)
🧠 Mindset:
This setup is classic spring + reclaim. If price consolidates and flips 147.2, upside becomes favorable.
If you like clean trade setups with logic and clear invalidation, check the account bio for more updates and live breakdowns.
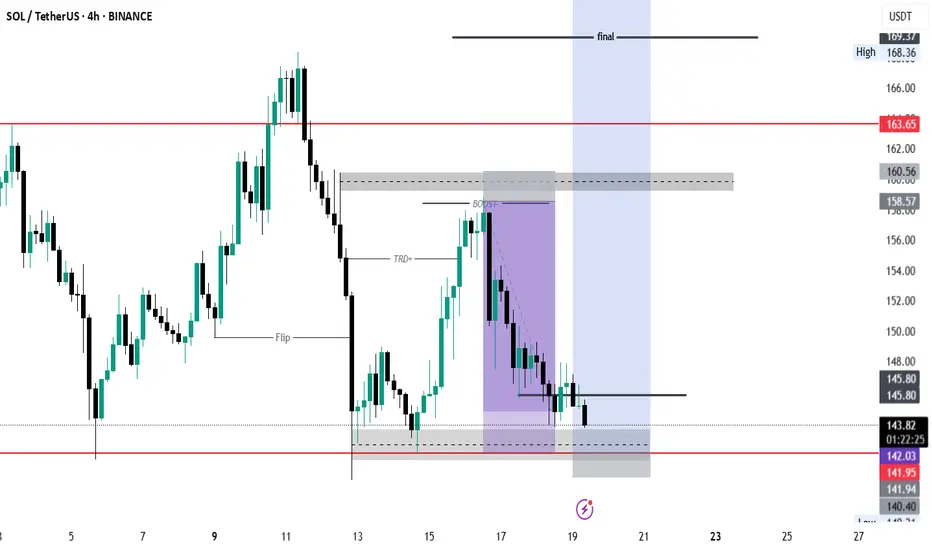
Looking at this SOL/USDT chartKey Levels Identified
The chart shows several important institutional levels:
Supply Zone (Bearish Order Block): The upper gray/purple rectangle around 158-160 USDT represents a strong supply zone where institutional selling likely occurred, evidenced by the significant bearish move that followed.
Demand Zone (Bullish Order Block): The blue rectangle at the bottom around 142-145 USDT appears to be a demand zone where buying interest emerged, showing potential institutional accumulation.
Flip Level: The horizontal line around 150 USDT marked as "Flip" represents a key level that could act as support or resistance depending on market structure.
SOL/USDT LONG OPPORTUNITY Looking at the current structure of SOL/USDT and the Fib retracement, there's the likelihood that price will get to the 0.618 area where there will be a great opportunity to LONG

Give me your SOL!!SOL not SOUL!! Just look at it and understand your stances whats gonna happen if it happens!
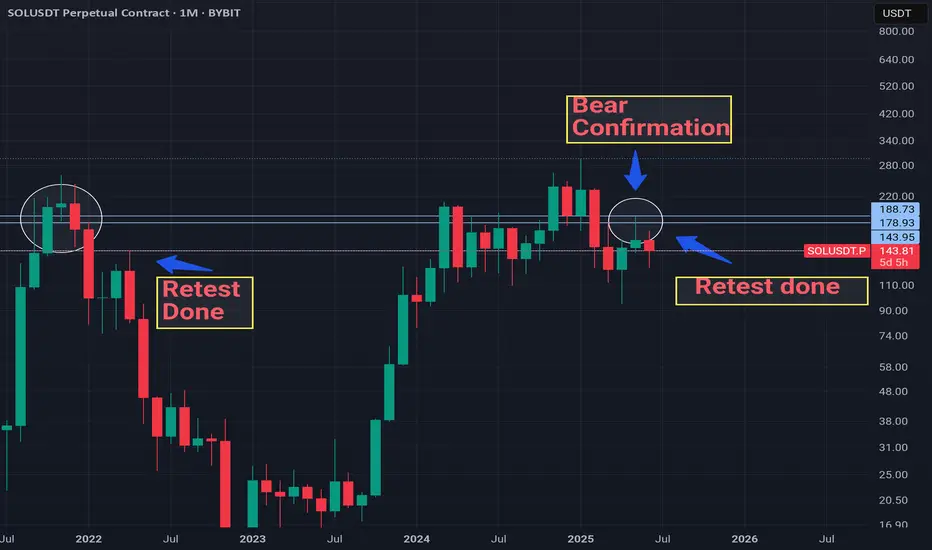
SOLANA BEAR SEASONCurrently i believe that Solana already confirmed bear season last month.
Monthly candles show us that price retest completed to previous 3 candles and turned direction down.
In my opinion highly likely $295 was all-time-high for this cycle and price will continue to drop until the end of year.
Weekly trading plan for SolanaBINANCE:SOLUSDT The price is already below the weekly pivot point. After updating the last bottom, the price may continue its downward movement. There are some level crossings so it is possible to reach them. More details in the video idea
Write a comment with your coins & hit the like button and I will make an analysis for you
The author's opinion may differ from yours,
Consider your risks.
Wish you successful trades ! mura

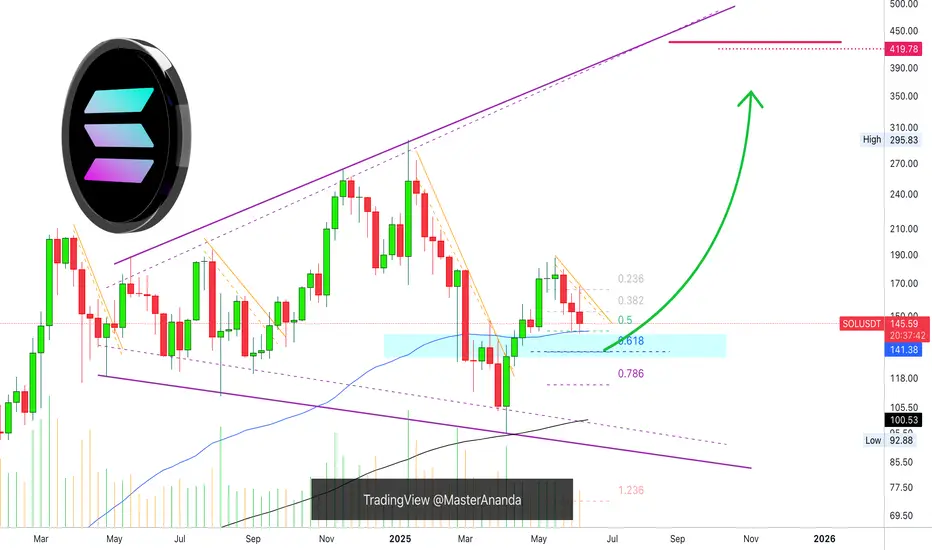
Solana Weekly TF, Good NewsI've gone deeper into Solana's chart and I have good news... You are looking at the weekly timeframe.
I looked at EMA34 and MA200 for some of the major Crypto projects, Bitcoin, Dogecoin, XRP, Cardano and Ethereum. You can find these in my profile @MasterAnanda.
Some were clearly bullish as the action was happening above both moving averages, others were mixed and one was bearish.
Solana is trading below EMA34 weekly but safely above MA200.
MA200 weekly sits at $100 for SOLUSDT.
There is another level of relevance, EMA89. On this chart shown as a blue line and this is the good news. EMA89 is working as support, it worked last week and this week it still holds. This same level matches perfectly the 0.5 Fib. retracement support relative to the move from 7-April to 19-May.
This is all to say that we are looking at a strong support zone, which means that it is likely to hold. If it breaks, it should be brief followed by a recovery right away.
Namaste.
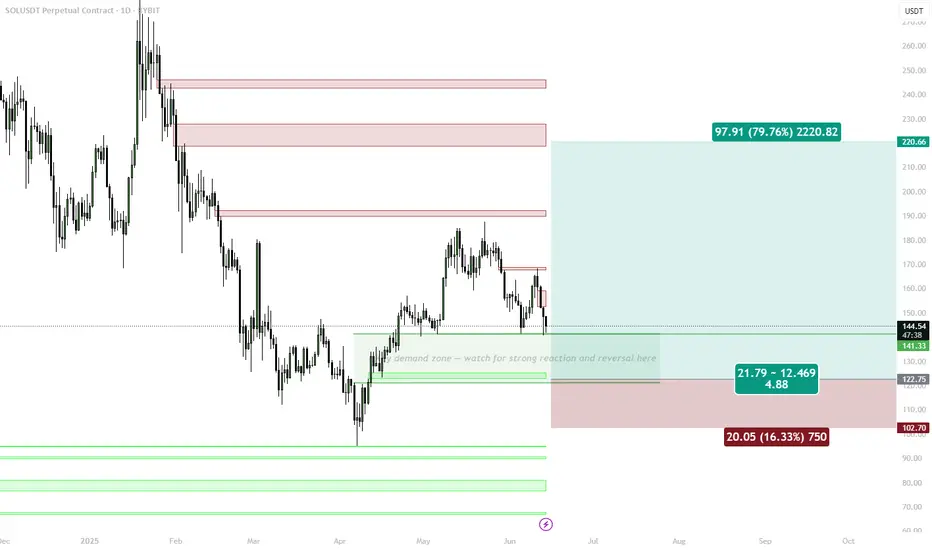
SOL | Key Demand Zone Retest in PlayBINANCE:SOLUSDT has pulled back into a major demand zone, following rejection from a local supply block. This zone previously acted as the base of the last impulsive move and now presents a critical level for a bullish reversal.
🟩 Key Demand Zone: $135–$125
• Valid demand cluster from April expansion
• Looking for bullish reversal signs or SFP before confirming entry
• Invalidates below $122.75
📌 Trade Setup (if confirmed):
• Entry near $125–130
• Target: $220 (79% upside)
• SL: Below $122.75
• R:R ≈ 4.88
🟥 Invalidation:
• Clean break below $122.75 = structure break
• Bearish continuation toward $102–105 zone
📌 This is the zone to look for strength — weak bounce = stand aside. Strong reaction = high R:R opportunity.
#SOL/USDT#SOL
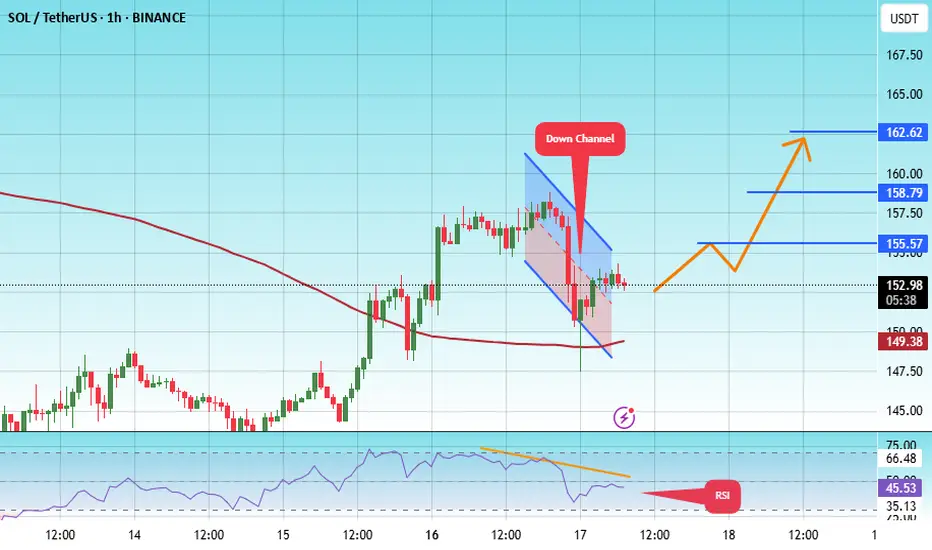
The price is moving within a descending channel on the 1-hour frame, adhering well to it, and is heading for a strong breakout and retest.
We are experiencing a rebound from the lower boundary of the descending channel. This support is at 149.
We are experiencing a downtrend on the RSI indicator, which is about to break and retest, supporting the upward trend.
We are heading for stability above the 100 moving average.
Entry price: 153
First target: 155
Second target: 159
Third target: 162
an eye for an eye! a SOUL for a SOLI dont know i like that SOL and what i wish it moves in the way, just wait for a sweep below to move, keep targets of 160 on the sweep!

HolderStat┆SOLUSD accumulation before growthOKX:SOLUSDT respects the $140 axis and tests the roof of its falling channel. Holding that shelf lets bulls aim for 160-170 and keeps the broader up-channel alive; a dip under 135 would postpone the rally but not derail the long-term trend ⚡️

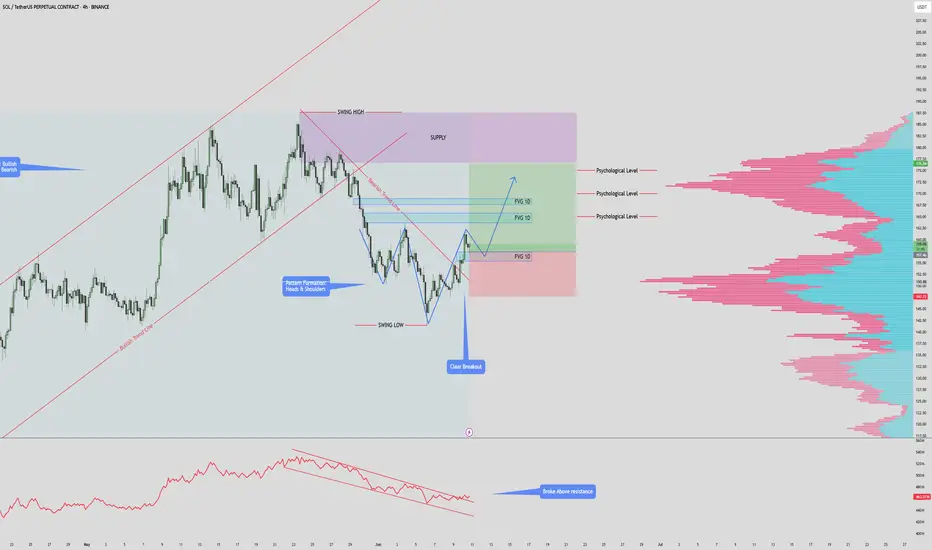
$SOLANA $180 PUMP INCOMINSOL/USDT – 4H Chart Summary
Market Structure:
HTF: Bullish trend remains intact.
LTF: Previously bearish, now showing early signs of a bullish reversal.
Pattern Formation:
Potential Inverse Head & Shoulders forming.
Neckline at $157 — must hold for pattern to complete.
Break above previous high will invalidate Inverse Head & Shoulders.
Trendline & Breakout:
Price has broken above the descending bearish trendline.
Indicates a momentum shift from bearish to bullish.
Fair Value Gaps (FVG):
1D FVG below current price – potential retest & long entry zone.
2x 1D FVG above price – act as targets or supply areas.
Psychological Levels & Volume:
Key levels at $165, $170, $175.
Volume profile shows high liquidity at each of these levels – strong TP zones.
OBV Indicator:
OBV has broken above resistance – supports bullish continuation.
Trade Scenarios:
Bullish Setup:
Long on retest of lower FVG zone ($142–$145).
Target TPs: $165 → $170 → $175 (align with psychological & high-volume areas).
Invalidation:
Break below FVG support or failure to hold above $142.
SOL (Weekly timeframe): Trend structure Price is approaching a key macro support zone. However, as long as it remains below the $148 level, I cannot rule out the possibility of one more corrective leg toward the $76–$55 range before a medium-term bottom is established and a potential resumption of the broader uptrend begins.
A breakout and sustained close above the $148 level would serve as the first technical signal that either:
- a corrective wave B (preceding a deeper correction toward the macro support zone) is unfolding, or
- a new long-term bullish trend aiming for all-time highs is beginning.
Monthly outlook:
My previous idea from November 2024 has fully realized its structure:
Thanks for reading and wishing you successful trading and investing decision!

Solana (SOL): Re-Testing Major Moving Average Line | 200 EMASolana has reached the 200EMA line on the daily timeframe, which has been broken recently after a long rally to upper zones. We caught 2 possible trades here, where one would be 1:5 RR and the second one would be 1:3 RR.
More in-depth info is in the video—enjoy!
Swallow Academy

SOLUSDT Perpetual–High R:R Short Setup from Key Resistance ZoneSOLUSDT printed a strong bullish impulse candle, reaching a key resistance zone around $151.76, where a short position has been opened, anticipating a potential reversal.
Trade Details:
Position: Short
Entry: $151.76
Stop Loss: $153.17 (0.88%)
Take Profit: $142.05 (6.44%)
Risk/Reward Ratio: 7.3, highly favorable for intraday or swing shorts
Setup Rationale:
Price tapped into a potential supply zone / previous resistance
Sharp move up without pullback may indicate overextension
Ideal for traders using a fade-the-pump or reversal-based strategy
This setup relies on a quick rejection from resistance, with tight risk control and a deep profit target — a clean and efficient play for high-risk:reward traders.
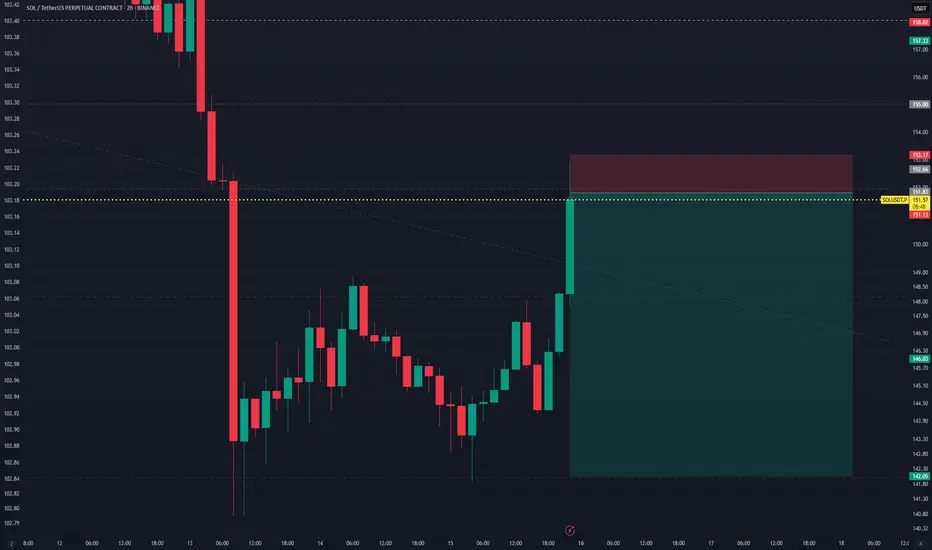
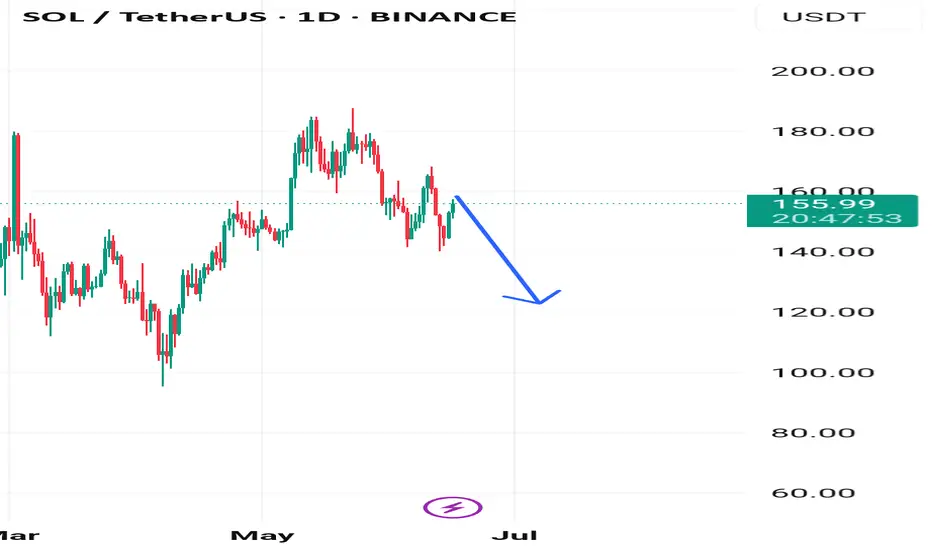
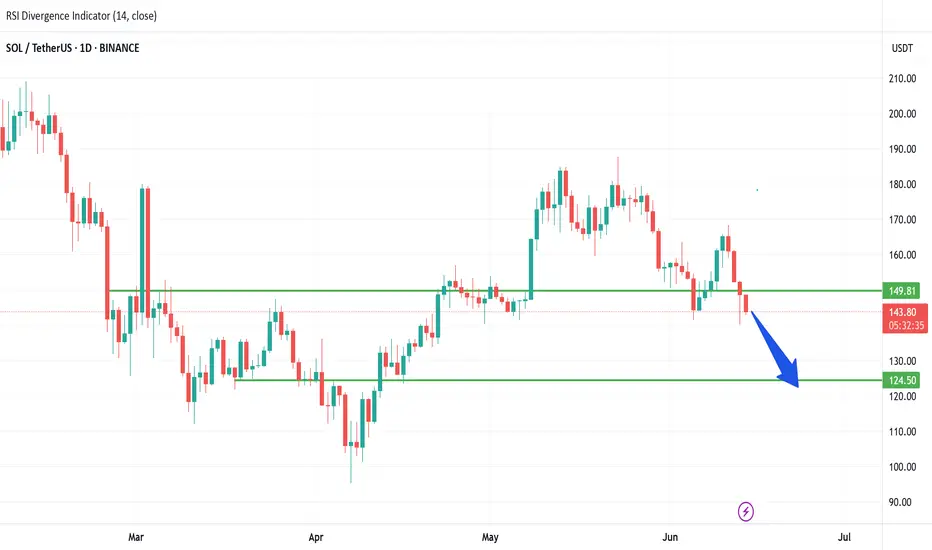
War Shakes Markets: SOL Dips Below Key Support — What’s Next?Solana (SOL) bulls are sweating. After a rough 3% daily drop, SOL has decisively broken below the critical $149–$150 support zone, with price currently hovering around $144. A powerful rejection from the $160 level last week now appears to be more than just a dip—it’s starting to resemble a trend reversal.
But that’s not all. There’s a geopolitical tremor behind the technicals.
Macro Heat: Israel–Iran Conflict Sends Shockwaves
Global markets are rattled after Israel’s latest strike on Iranian military facilities, prompting a missile-heavy retaliation from Tehran. As investors flee risk assets, the “war premium” is being priced into everything—from oil and gold to crypto.
This risk-off sentiment is putting extra pressure on altcoins like SOL, especially those already at key technical inflection points.
The Chart in Focus
Here’s the real-time breakdown:
Price Action: SOL has closed below the $149.81 support (a previous consolidation base). That zone is now likely to flip into resistance.
Volume: 24H volume remains elevated (273M+), suggesting sellers are still active—not just a low-liquidity dip.
RSI: The RSI is sitting at 37.99, creeping toward oversold territory but not there yet—leaving room for further downside.
Next Target: If momentum continues, all eyes are on the $124.50 level — a well-tested demand zone and potential bounce point.
The blue arrow on the chart isn’t just aesthetic—it’s a warning.
What to Watch Next
A daily close below $142 would solidify the breakdown and make a drop to the $124–$125 range highly probable.
However, if SOL reclaims $149 with strong volume, it could trap bears and launch a relief rally.
Keep an eye on macro headlines. If the Israel–Iran conflict escalates, expect more risk-off moves across the cryptocurrency market. Solana, like most altcoins, doesn't thrive in global uncertainty.
Conclusion:
The break below $149 isn’t just technical—it’s emotional. As fear grips markets globally, SOL is caught in the crossfire. Risk management matters now more than ever.
Solana - Your chance to be a millionaireThere is a 50/50 chance that we have topped...
The wave structure is very indicative of a completed impulse. However, i'm betting that we are just in a complex wave 4 and if this is the case, we should see a wave 5 taking out the high.
The risk to reward is pretty nice and playing spot will pay off.
Impulse without purpose? Not in Smart Money termsSOL didn’t just break structure — it filled inefficiency and positioned above. Now price is sitting in the upper FVG, where decisions are made — not guesses.
What just happened:
Price rallied from the OB below and left an IFVG in its wake
Current price is hovering at the edge of a higher FVG, right where liquidity rests from trapped shorts
The move is complete — now it’s about what price does next in this zone of intent
From here, two paths:
Sweep into FVG, reject, and rotate back down toward the 154–147.4 range
React bullishly from mid-FVG, reclaim structure → break to new internal high and keep running
The OB down at 145 is still valid if price unwinds — that’s where Smart Money bids.
Execution view:
Rejection from 158–159 = short bias down to 147–145
Clean invalidation above FVG high
If price consolidates at 154 and reclaims → setup flips bullish
The setup isn’t about what price did — it’s about what it’s preparing for.
You want more trades like this — precision zones, mapped logic — check the profile description.
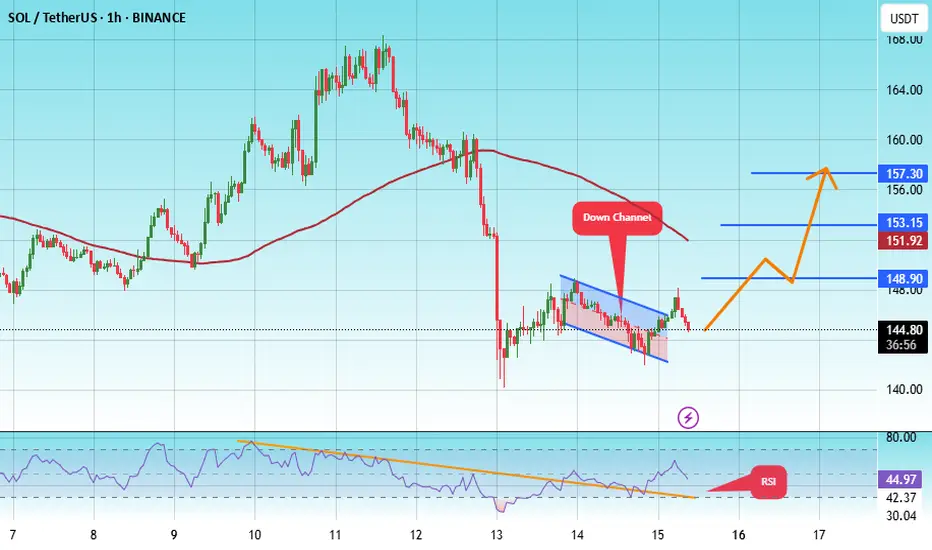
#SOL/USDT#SOL
The price is moving within a descending channel on the 1-hour frame, adhering well to it, and is heading for a strong breakout and retest.
We are experiencing a rebound from the lower boundary of the descending channel. This support is at 142.
We are experiencing a downtrend on the RSI indicator, which is about to break and retest, supporting the upward trend.
We are heading for stability above the 100 moving average.
Entry price: 144
First target: 149
Second target: 153
Third target: 157
Solana to crash with btc 97k pullback?Solana could have been bottomed, but since btc likely to crash next. Then Solana 130$ is likely next