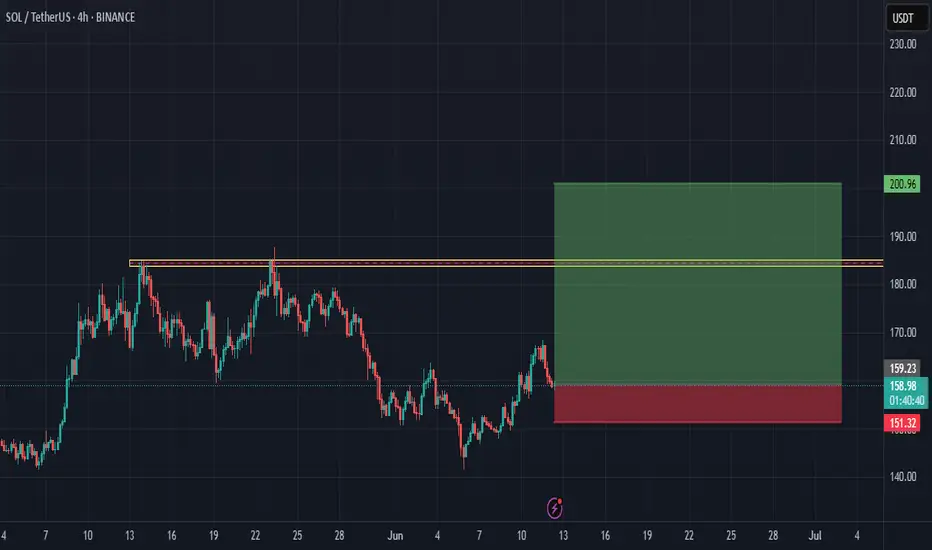
SOLUSDT H4 12th Juneresistance specified which is touched two times. I think that the resistance would break and SOL hit 200$
SOLUSDT.3S trade ideas
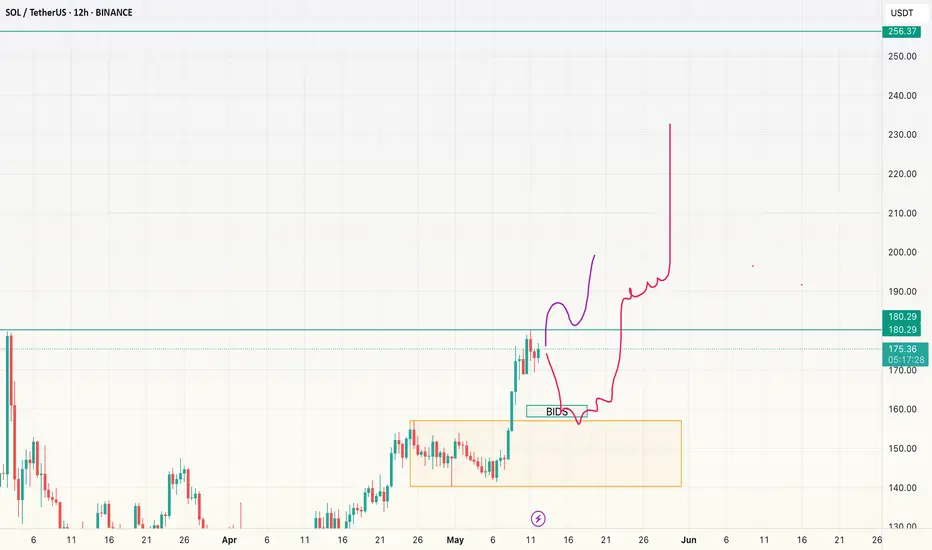
SOL-Long planCurrently at S/R ~180. Either we break past today or post-CPI or we get a little whipsaw around CPI for which setting bids at 12H OB marked (yellow box) is a good idea. Either way, midterm target remains at $256, hopefully sometime in June.
$sol long 🧠 Trade Thesis
SOL has pulled back into a key demand zone around the $144–$145 range, forming a potential bullish reversal setup after a steep drop. This level coincides with previous structure support and could act as a springboard for a bullish bounce targeting higher resistance levels.
🎯 Trade Setup
Entry: $145.06 (current price)
Stop Loss: $139.21
Take Profit Targets:
TP1: $160.65 (recent structure high)
TP2: $168.22 (local resistance)
TP3: $179.32 (supply zone)

SOLUSDT | Short-Term Target = $185Today, we got reports that the SEC requested SOL ETF issuers to update their filings which ignited the rally past $165. This boosts investor confidence- we should see good bullish volume in the near term, targeting $185.
US-China talks have also came back positive, awaiting both presidents' approval.
The first hurdle, still, is the 200SMA. Ideally, we want to see a bullish close above $168. This should be easily taken this week, if not today. From there, we aim for the near term high of $185 before zooming out to aim for $250.

Very strong bearish trend is ahead!We expect after a pull back to the order block solusdt fall atleast 10-20%!
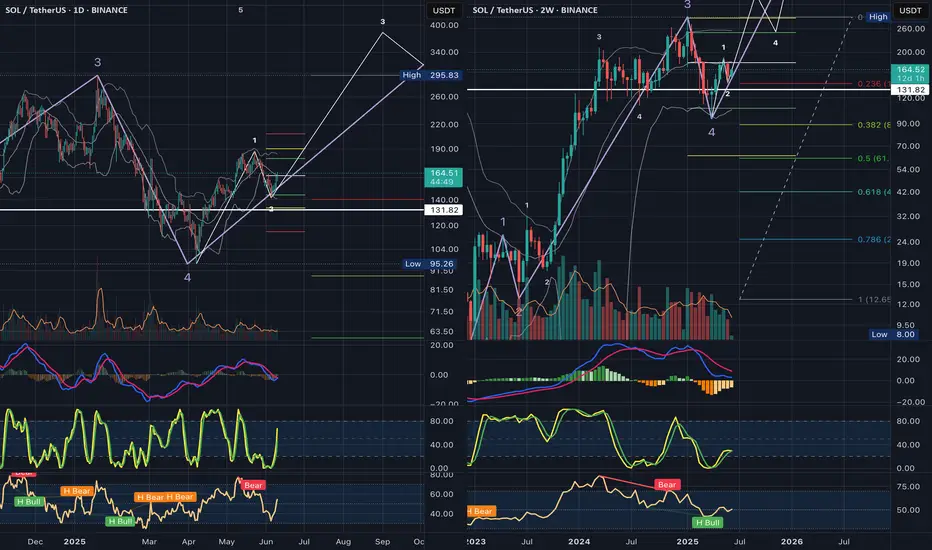
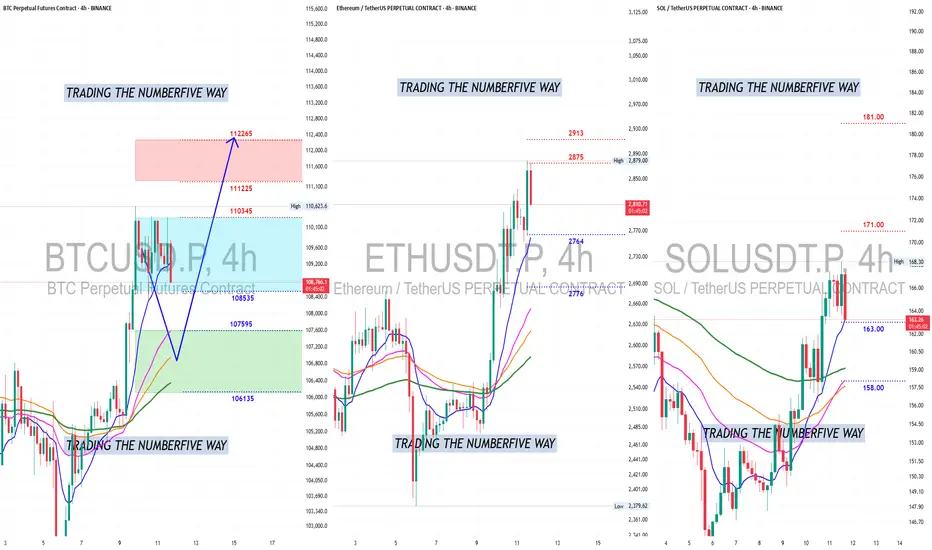
Get Ready For Next MoveThese is a re-post chart from a couple of days ago, nothing has changed just the numbers and TIME but direction still the same and that is UP....UP and away.
Bitcoin is about to enter its 2nd stage UP move in the next 12 to 16hrs (if not sooner).
Once the 4 hrs prints its BIG red candle it will mark the start of next move UP.
That RED BIG candle that will print is just to get rid off greedy high lev Longs.
Be prepared for bulls to take over to continue to the ATHs.
Place your bets ladies and gentlemen and grab your popcorns cause we are heading
into wild ....wild volatility again.
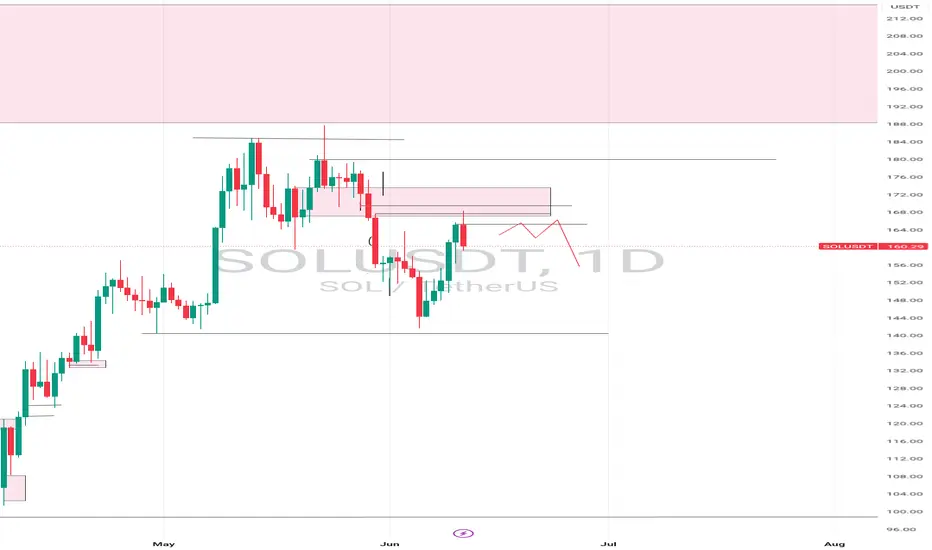
Possible bearish outlook After mitigation of the breaker block, I would love to see Solana resume it's bearishness to the downside
Solana's Retrace Isn't Over, Lower HighSolana's retrace is not over, some weakness is showing up on the chart. Here we have a strong lower high on the daily timeframe coupled with very low trading volume. Low trading volume at this point signals that buyers are just not present. When no new buyers are present, the market will continue in the same trend. The trend is the drop that started 19-Jan, confirmed 23-May with a lower high. Today, a local lower high points to even lower prices.
Once the retrace is over, we can expect a new wave of growth; for now, we have to step back and watch (SHORT) until a new support level forms. When support is in, we can again buy (go LONG).
Sell at resistance, buy at support.
Adapt live to market conditions.
Thanks a lot for your continued support.
Choose wisely. Be smart.
Namaste.
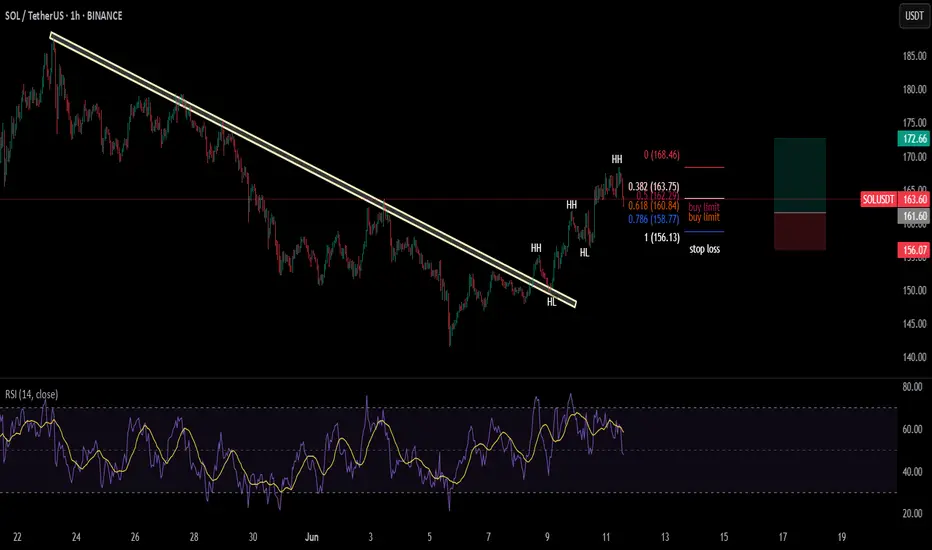
Solana(SOL) in bullish trend!!!the coin has broken the trendline and then also retested it to confirm its bullish rally right now the price action is simply following DOW theory by making HHs & HLs. I have opened a long position on the chart with 1:2 RR.
MY ANALYSIS IS HITTING THE TARGET! WHAT A CATCHING VIEW!🎯🔥 MY ANALYSIS IS HITTING THE TARGET! WHAT A CATCHING VIEW! 🔥🎯
✨📈 Everything is playing out as I expected – let’s keep riding this wave! 🌊💹
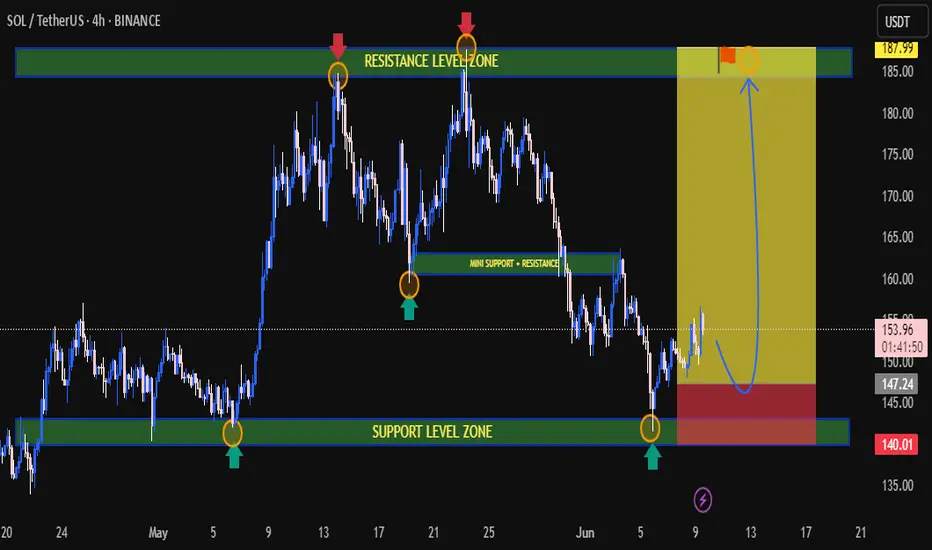
🚀 SOL/USDT Analysis Update 🚀
📅 Date: June 11, 2025
📊 Timeframe: 4H
✅ Key Zones & Levels:
🟢 Support Level Zone: 144.00 – 147.24
🔴 Resistance Level Zone: 184.00 – 187.99
⚠️ Mini Support/Resistance: Around 160.00
🎯 Current Price Action:
The price has respected my previously marked Support Zone (🟢), resulting in a strong rebound. After forming a bottom at the support level (marked with green arrows), SOL/USDT is now on an impressive upward move.
🟡 The current upward momentum is targeting the Resistance Level Zone near 187.99.
💡 Expected Movement:
If the price approaches the Resistance Zone (🔴), a reversal may occur, creating a potential short-term sell opportunity. Conversely, if it breaks above, we might see further bullish momentum.
🟦 Potential Path:
🔁 Expect a retest of the resistance zone → Possible rejection → Revisit the mini support (~160.00) before a decisive move either back to support or a breakout above 187.99.
💪 Key Takeaways:
Support Zone held strongly, confirming my analysis.
Mini Support/Resistance acts as a pivot for short-term reactions.
Watch closely as the price nears the Resistance Zone – this will be a key area for possible reversals or breakouts.
🔥 Let’s keep an eye on the next moves! Your feedback and thoughts are always welcome. Happy trading! 💪📈

SOL/USDT 4H Chart Analysis📊 SOL/USDT 4H Chart Analysis
🟢 Key Zones:
🔴 Resistance Level Zone:
Marked at approximately 185–188 USDT
Multiple rejections in this area (red arrows 📉), confirming it as a significant supply zone.
🟩 Support Level Zone:
Found around 140–147 USDT
Price has previously bounced off this zone (green arrows 📈), indicating strong demand.
⚖️ Mini Levels:
🟡 Mini Support/Resistance:
Around 157 USDT, previously acted as both support and resistance (yellow box).
Price reacts to this zone during its downtrend and uptrend, highlighting its significance.
🔮 Current Price Action:
The price is currently at 153.36 USDT.
The recent low was just above 140 USDT, confirming a higher low formation.
A small pullback is visible after testing the support zone.
📝 Trade Outlook & Scenarios:
🔵 Bullish Scenario (Main Bias):
If the price maintains above the support zone (140–147 USDT) and breaks the mini resistance (~157 USDT):
Possible continuation towards the resistance zone (185–188 USDT).
Target 🎯 at 187.99 USDT (highlighted in the yellow zone).
🔴 Bearish Scenario:
If the price breaks below the 140 USDT support:
Downward continuation to 132 USDT or lower, as shown in the chart (red zone).
🔧 Risk Management:
🛑 Stop Loss:
Conservative traders: below 140 USDT (red zone 🚨).
Aggressive traders: below the last swing low (~144 USDT).
💡 Professional Takeaway:
✅ Support and resistance zones are well-defined.
✅ Current bounce from support zone suggests a possible reversal.
✅ A break and close above the mini-resistance at 157 USDT would confirm strength.
✅ Risk management and patience are key for this potential upside move.
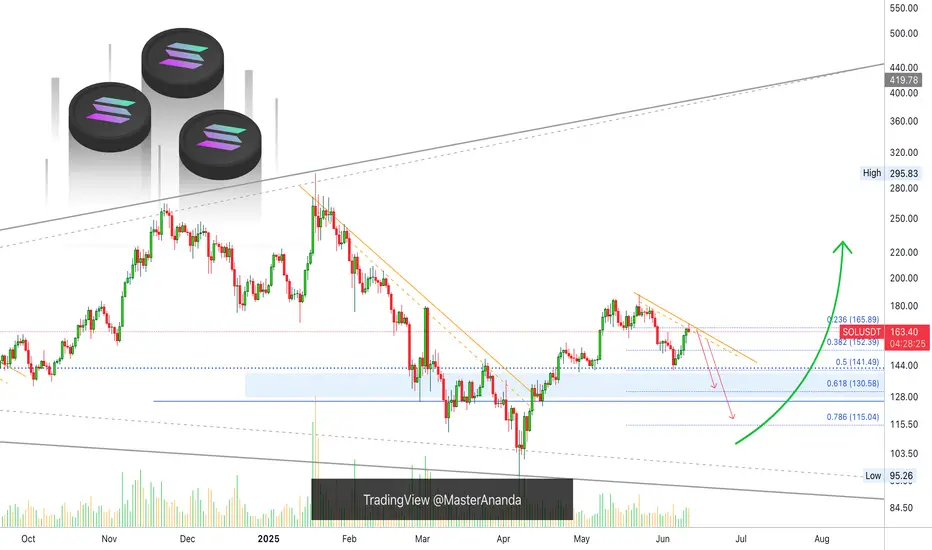
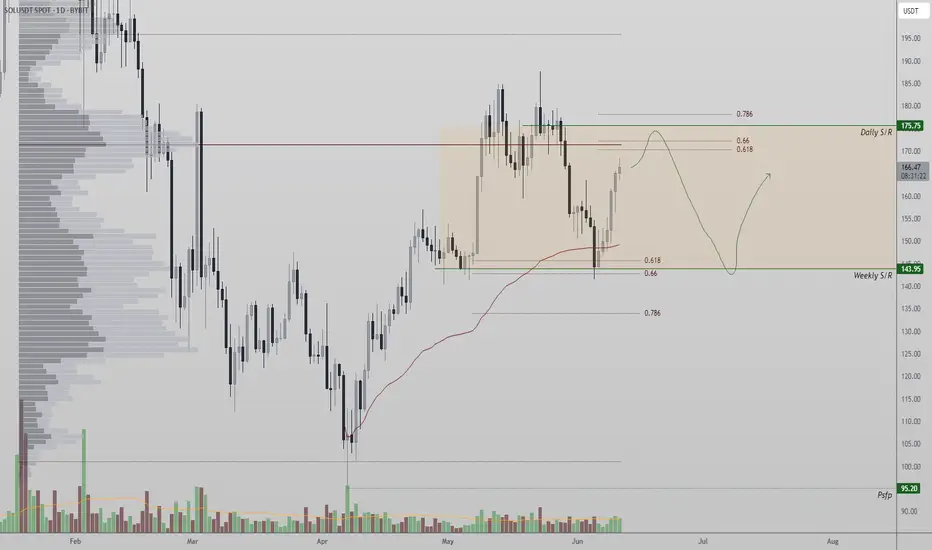
Solana Hits Major Resistance After 17% Rally — Decision PointSolana (SOL) has posted an impressive 17% rally from the $143 region, which held firmly as a high-confluence support zone. This level aligned with the 0.618 Fibonacci retracement and the weekly support, leading to a strong bullish reaction.
Price is now approaching a significant resistance zone near $176, where multiple technical levels converge:
The point of control from the recent volume profile
The 0.618 Fibonacci retracement from the previous swing high
A critical daily support-turned-resistance level
This area presents a key inflection point for Solana’s trend. A clean breakout above $176 could confirm continuation of the bullish move and likely open up a push toward higher resistance targets. However, if Solana rejects this zone, it could simply result in a healthy pullback to form a higher low—a typical structure within an uptrend.
That said, failure to hold a higher low and loss of momentum may bring price back into the broader range between $143 and $176, which has acted as a containment zone on the high time frame.
How Solana reacts at this level in the coming sessions will be critical for determining whether this is just a short-term rally or the start of a larger bullish expansion.
Key Levels to Watch:
Support: $143
Resistance: $176
Breakout Confirmation: Close above $176 with strong volume
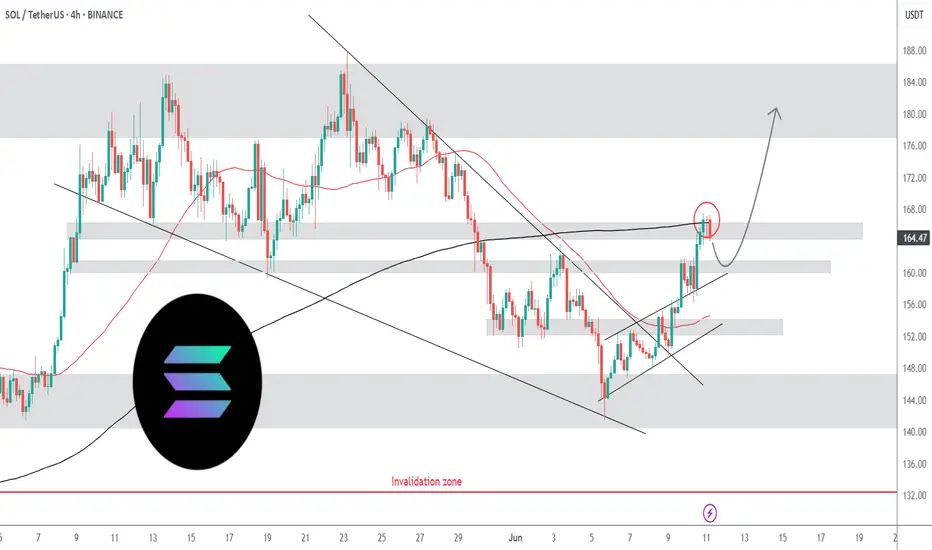
Solana (SOL): Good Buying Opportunity Incoming | June 2025Solana is gathering buyside volume, and we are back near daily timeframes of the 200 EMA, which might be our breakout for an upcoming long position.
More in-depth info is in the video—enjoy!
Swallow Academy

SOL USDT LONG TRADE SETUPSOL/USDT is currently holding at a strong support zone, with a high probability of an upward price move.

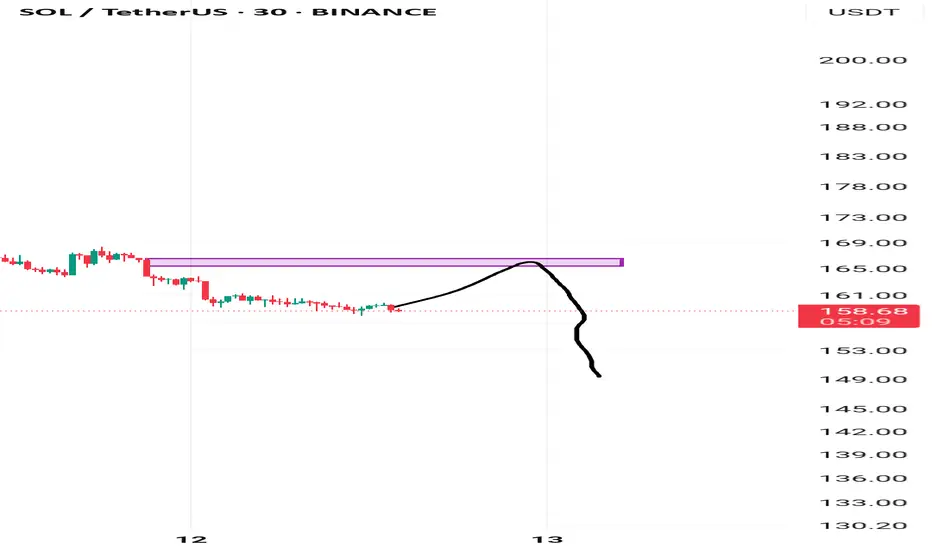
HolderStat┆SOLUSD reached resistance lineCRYPTOCAP:SOL just flipped the 157 pivot into support after escaping a falling channel and retesting the up-trend. Holding here fuels a run toward the 170 trend-cap and 180 supply shelf; failure invites 150 again. Growing channel, consolidation clusters, breakout watch.

sol updateentry price 169.14
stop loss update 169.14
take profit 160.1
145.1
131.5
result for now we hit 2 target and risk free

BUY OPPORTUNITYTrade Setup: SOL/USDT
Entry: $161.13
Stop Loss: $156.57
Take Profit: $176.53
Time Frame:4H
Technical Analysis:
SOL price has decisively broken out above a strong resistance zone between $160.48 and $162, confirming bullish price action. This breakout is likely to trigger a retest of the broken range to confirm support before continuation higher.
Key resistance to target is at $177.20, which aligns with a significant supply zone. Traders should consider scaling out or taking profits near this level due to potential selling pressure.
Risk-Reward: Approximately 1.3 favoring the trade.
RSI: Currently at 63, showing sustained bullish momentum without being overbought.
MACD: Bullish crossover present, indicating upward momentum is intact.
Fundamental Update:
The U.S. Securities and Exchange Commission (SEC) has requested prospective Solana ETF issuers submit amended S-1 forms within the next week. The SEC will review and comment within 30 days of submission. Importantly, the SEC appears open to including staking within Solana ETFs, having asked issuers to clarify language on in-kind redemptions and staking mechanisms. This regulatory openness could add significant bullish catalyst for SOL, supporting increased institutional interest and demand.

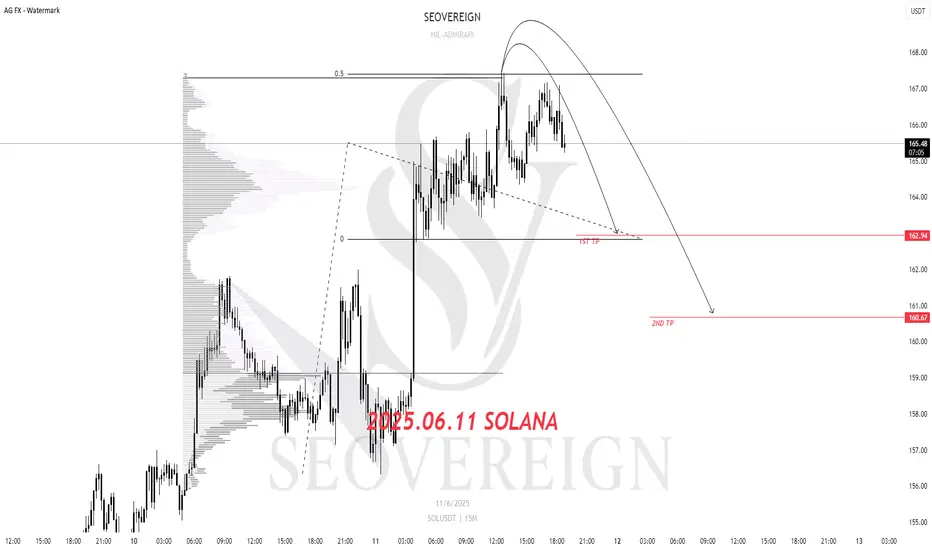
SOLANA Short Position Update – June 11, 2025We are the SeoVereign Trading Team.
With sharp insight and precise analysis, we regularly share trading ideas on Bitcoin and other major assets—always guided by structure, sentiment, and momentum.
🔔 Follow us to never miss a market update.
🚀 Boosts provide strong motivation and drive to the SeoVereign team.
--------------------------------------------------------------------------------------------------------
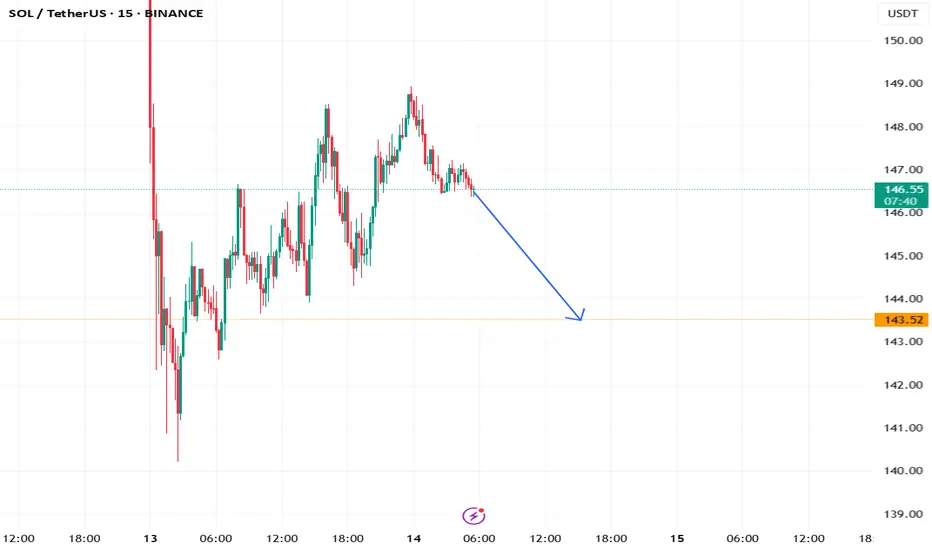
Solana downside perspective shared.
The first target is set at 162.94.
The bearish outlook is based on the Elliott Wave structure and volume flow.
Currently, upward momentum appears to be exhausted, and decreasing volume is increasing the possibility of a trend reversal.
Additional analysis will be shared through an idea update once the first target is reached.
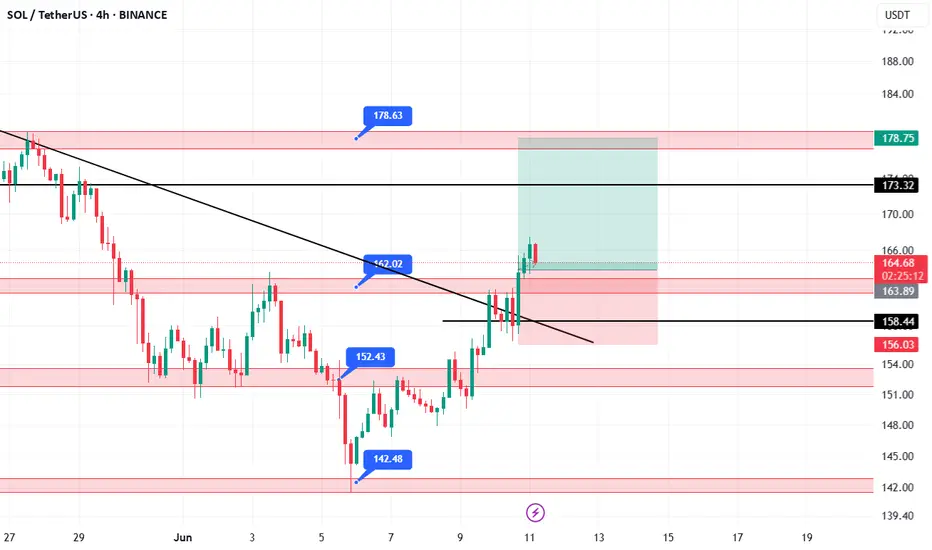
SOLUSDT UPDATEBUY 165
SECOND BUY 158
1.TP 173
2.TP 178
Normally, if it drops 5% after the second purchase, I stop. Read BIO for more.