Solana UpdateHello friends🙌
After the price growth we had, the price hit the resistance level of $160 twice and failed to break it, which caused a double top pattern to form, which if confirmed, there is a possibility of falling to the specified areas.😉
The specified areas are good prices for buying in steps, of course, with capital and risk management.✔
🔥Join us for more signals🔥
*Trade safely with us*
SOLUSDT.3S trade ideas

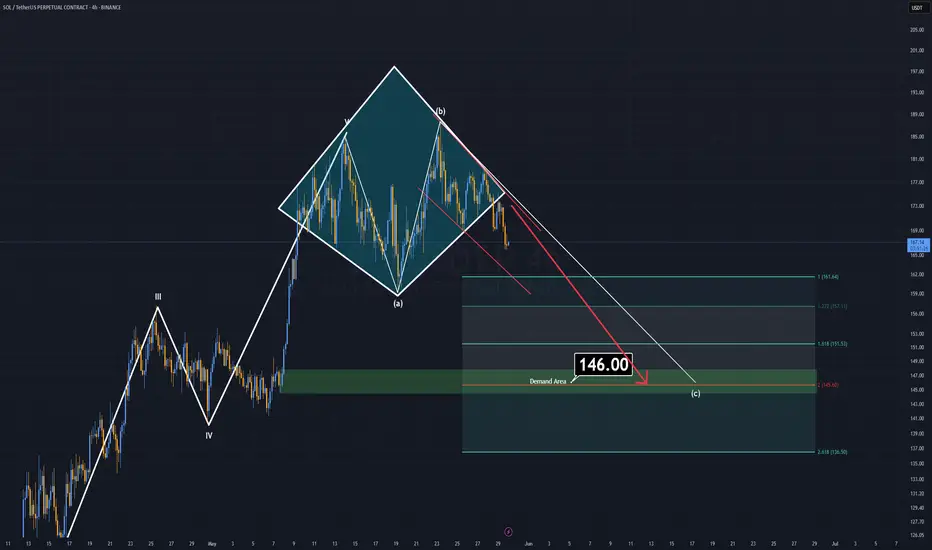
Red Lights for SOLANASolana has recently completed its 5-wave impulsive rise, and now a correction phase appears to be underway. Notably, a diamond top formation has formed and already broken to the downside, further supporting the short-term bearish outlook.
As long as SOL trades below the $180 resistance, this corrective scenario remains valid.
I currently do not expect a drop below the $146 support zone, making this a structured micro pullback within a larger bullish macro trend.
This setup offers opportunities for both short-term short and long entries, depending on how the price reacts near key levels. While the macro structure and fundamentals remain highly bullish for Solana, this correction could provide an ideal re-entry point before the next major leg up.
— Thanks for reading.
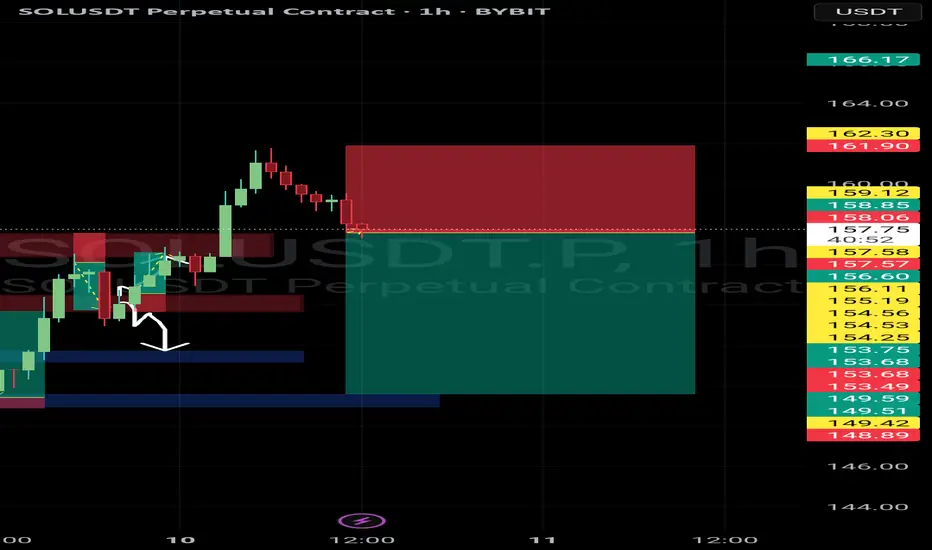
Sol will it drop again?Shorting sol with the Profit we made from last trades.
Having tight sl
Book profit wisely. Im going to sleep now
SOL UPDATE - BOXES STILL VALID (ANALYST CRYPTO TANTRIK)boxes provided in the group earlier , had 2 good trades , still looking for a move
boxes are still valid , look for opportunities

Bearish flag on the 4H timeframe for SOL/USDT.Key Characteristics of a Bearish Flag:
1. Sharp downtrend before the flagpole – You can see a strong downward move leading into the pattern, forming the “flagpole”.
2. Consolidation in an upward-sloping channel – The price then moves upward within parallel trendlines, which is the “flag”.
3. Volume often decreases during the flag – While not shown in your chart, volume typically drops during the flag consolidation.
4. Bearish continuation expected – A break below the lower trendline often signals continuation of the previous downtrend.
Additional Notes:
• RSI is rising but still below overbought territory, suggesting there’s room for price action in either direction. However, if a breakdown occurs from this channel with an uptick in volume, it would strengthen the bearish thesis.
• The target for a bearish flag breakdown is typically the length of the flagpole, projected downward from the breakdown point.
Watch for:
• A confirmed break below the lower channel.
• Increased bearish volume during the breakdown.
• Potential support levels around $150 and $145.

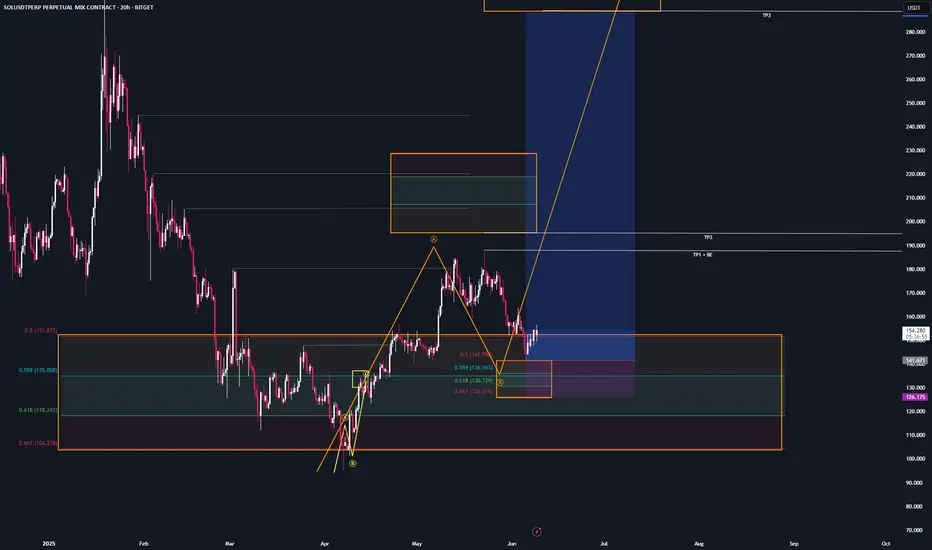
SOL next target is 216, after filling this GAP⚡️ Hello everyone! I decided to update my thoughts on SOL. Everything is happening exactly as I wrote last time.
We went down and gathered some liquidity, and also closed the GAP. And now we are near strong resistance at 160-161.
Whether we can consolidate above this level is what will determine the direction of the next price movement.
⚙️ Let's take a look at the most likely direction going forward:
Money Flow - there was an outflow of liquidity at levels above 160, as profit-taking began after a strong rally from the April correction.
However, the inflow ratio is still neutral.
Liquidity Depth - a large accumulation of liquidity has gathered directly above us, at levels 187-200. And as we know, the price moves from one liquidity zone to another.
Overall, liquidity at the top is only increasing, with the difference now almost 5 times greater in favor of short positions.
DSRZ - strong resistance at levels 156-164. This must be overcome and turned into support in order to continue the momentum. As long as we are below it, this is a more bearish signal.
The next nearest liquidity zone is at 130 and below.
📌 Conclusion:
The next move now largely depends on the market as a whole. Historically, markets have frozen in the summer due to a lack of liquidity. However, this cycle has already shown many deviations, and another one would not be a surprise.
I am keeping my position open and continuing to monitor the situation. So far, the overall mood is bullish, and I continue to stick to my thesis that a move to at least 187 is likely, gathering liquidity from shorts in such an obvious place.
Have a great start to the work week, everyone! ☀️

SOL - TradeOur CRYPTOCAP:SOL setup was triggered perfectly.
Now I’ll let it play out and stick to my trading system.
A short-term drop is always possible —
but from here, we should be heading higher in the near future.
soluusd for short *The content on this analysis is subject to change at any time without notice, and is provided for the sole purpose of assisting traders to make independent investment decisions.
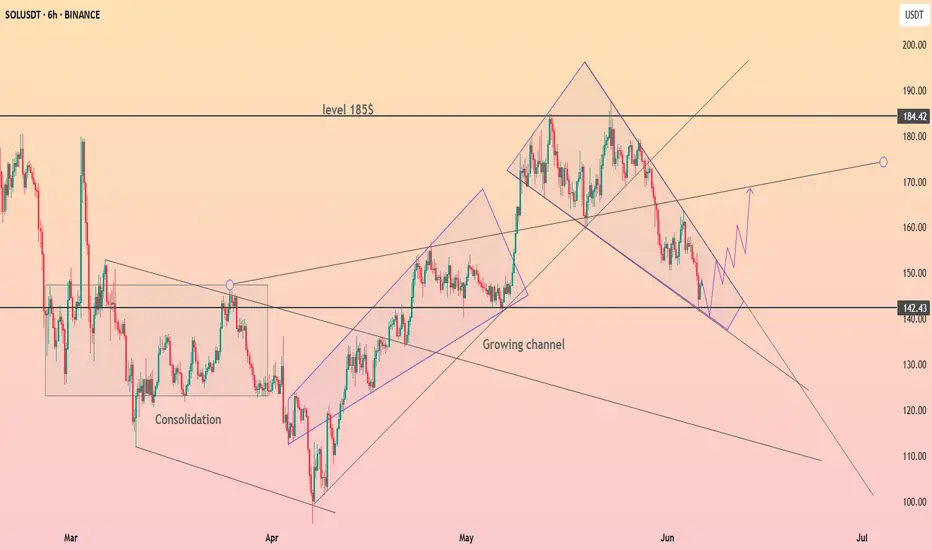
HolderStat┆SOLUSD rebound from 142CRYPTOCAP:SOL just kissed 142 support at the base of its growing channel. Solana price slips from a descending wedge, and holding above trend could propel bids toward 155, then the 170-184 supply band; lose the line and 125 beckons.
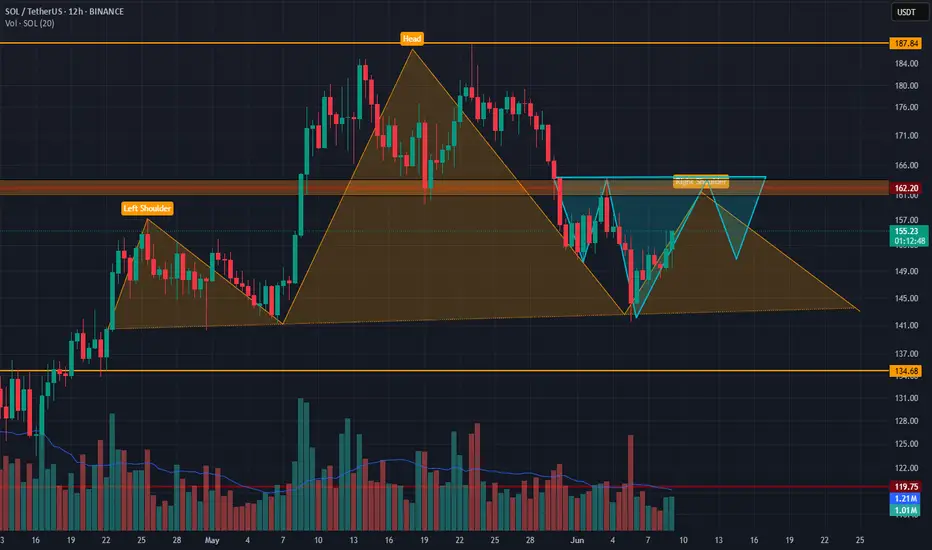
On Solana, 162$ is criticalBINANCE:SOLUSDT
On Solana we are see 2 possible head ans shoulders pattern. İf we cant go past 162$ and the bigger pattern works, things for solana is not so good.
But if we can past beyond 162$ dollars with or without a reverse head and shoulders pattern, the bigger patterns is breaks and we can look for a further bullish movement.
İf you look to my analysis from past, you see a falling wedge on solana too.
I think if Btc dont give any harm, solana wants to go up but one piece of news can change everything.
They took the low — now let’s see if they deliver the high.BINANCE:SOLUSDT just tapped into the BTS 15M zone sitting right above the 0.786 retracement — this isn’t your typical dip, it’s a stop-run with intent.
Here’s the setup:
Sweep of liquidity below 149.47 (key 0.786 fib)
Immediate rejection candle and reclaim of the OB 15M zone
Volume surge near the bottom = likely Smart Money entry
Price is following a textbook schematic. Manipulate, mitigate, and then distribute or expand.
Targets:
TP1: 151.59 (0.5 level — OB 15M reclaim test)
TP2: 153.55 (0.236 + inefficiency fill)
TP3: 155.35 (full expansion to STB 15M zone)
Invalidation: close below 147.88 (sweep without follow-through)
The move has already begun — this isn’t about predicting, it’s about recognizing.
For full market narratives and more setups like this, check the profile. No fluff — just smart structure.

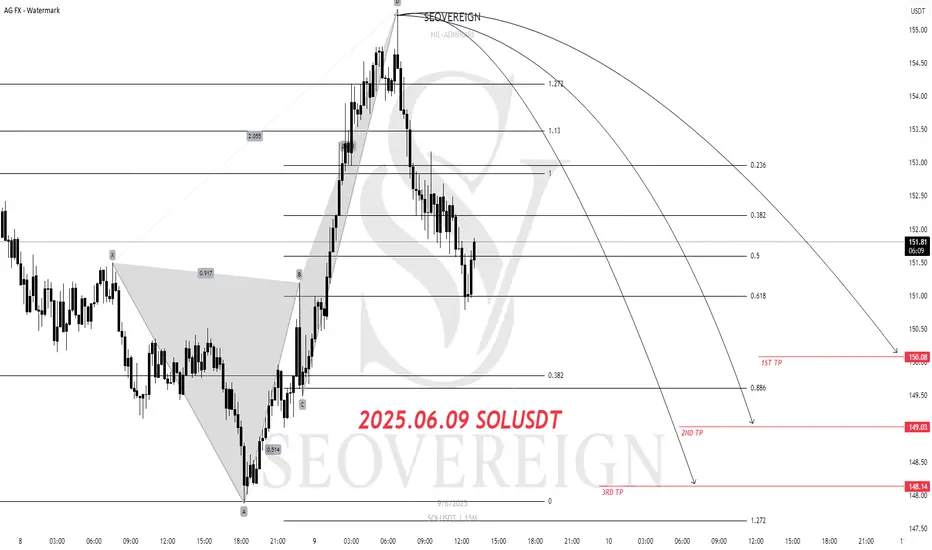
Solana Short Position Update – June 9, 2025We are the SeoVereign Trading Team.
With sharp insight and precise analysis, we regularly share trading ideas on Bitcoin and other major assets—always guided by structure, sentiment, and momentum.
🔔 Follow us to never miss a market update.
--------------------------------------------------------------------------------------------------------
Solana (SOL) Short Position Strategy
DEPP CRAB Short
1st Target: 150
Analysis Summary:
Recently, SOL's price movement faced downward pressure after a short-term rebound and resistance in the overbought zone. From a technical perspective, a short position was taken near the Fibonacci retracement zone and previous resistance level, with targets set based on a gradual decline.
Each target is considered a zone with a high probability of support testing, and a partial take-profit strategy may be effective depending on market conditions. Risk management is essential, and a stop-loss should be set in case of an unexpected rebound.
SOL - Whats next?Planning the move as drawn, just moving it up and then down as depicted - Its a small short scalp
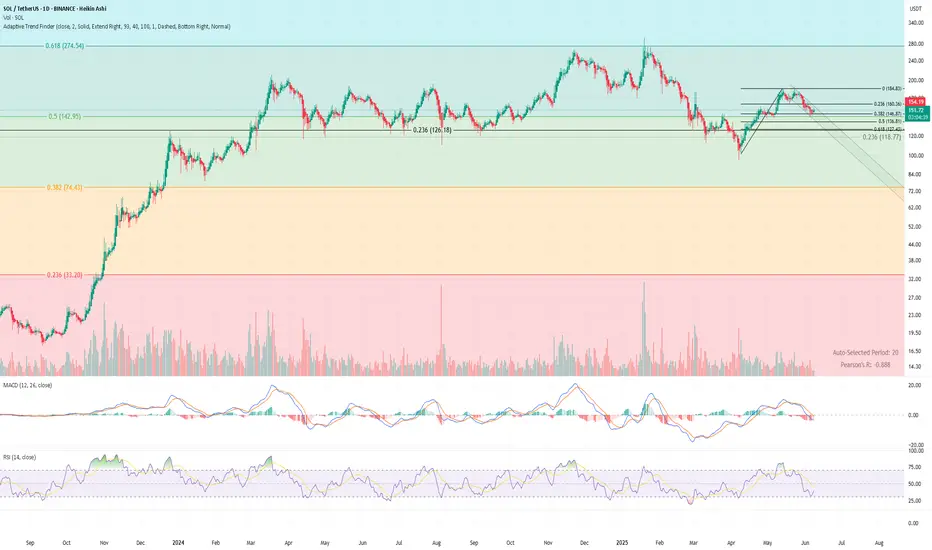
$SOL Tight Range. Big Move Loading? Full Multi-TF Breakdown📊 CRYPTOCAP:SOL Daily Chart
Price bounced from confluence support around $126 (0.236 fib + local structure), but remains below all key retracements from the $184 high.
– RSI hovering around 39 → oversold but no bullish divergence
– MACD still below signal line, weak momentum
– Structure remains inside a descending channel
BTC is testing $106K into weekly close.
If Bitcoin confirms a breakout, SOL could follow with a push above $160.3 (0.236 fib).
Reclaim of $160 → $184 next
Failure → $126 retest, with risk of break toward $118
Trend bias: bearish → neutral
Watching BTC for confirmation.
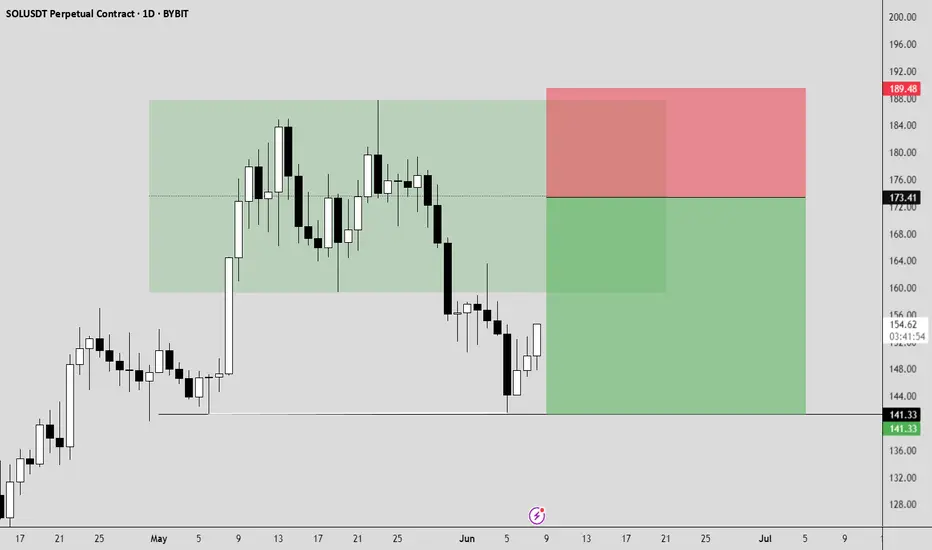
SOLANA SHORT SETUP The price has induced the pml and did not sweep it, by that it acumullated large ammount of liquidity at the relative equal lows.
I think we are going to retest the orderblock that I marked by the green box which essentialy is the wick on previous monthly candlle, after that the price should break to the downside taking out the acumulated liquidity.
Entry at 173.41
TP 141.33
SL 189.48
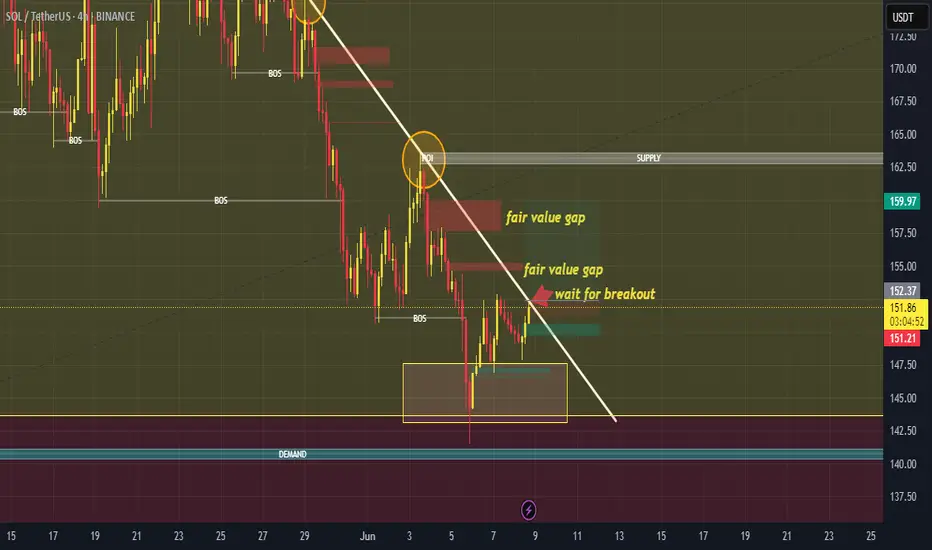
SOL/USDT Technical Analyse📉 Downtrend Line: SOL has been following a strong downtrend line, but now the price is consolidating near it and looks close to a potential breakout.
🔁 Fibonacci Support: According to the Fibonacci retracement tool, SOL is currently sitting on a key support zone (you can mention the exact level if you want), which could act as a potential reversal point.
🕯️ Candle Pattern: Today's candle is neutral — neither bullish nor bearish — but the overall structure suggests a possible breakout. Waiting for a confirmation candle would be wise.
📌 Next Move: If the price breaks above the trendline with good volume, a bullish momentum might follow.
⛔ This is not financial advice. Always DYOR (Do Your Own Research).
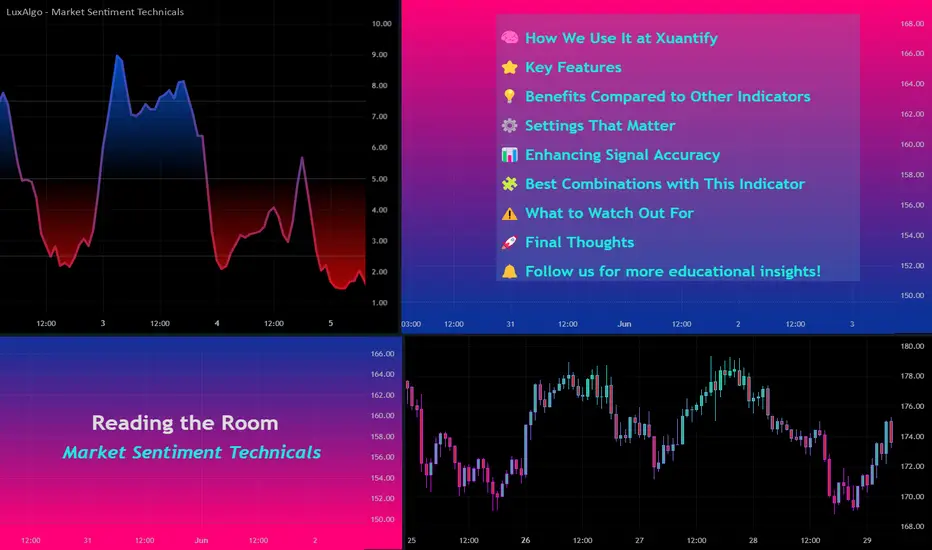
Reading The Room: Market Sentiment TechnicalsThe Market Sentiment Technicals indicator, created by LuxAlgo , is a powerful tool that blends multiple technical analysis methods into a single, easy-to-read sentiment gauge. It’s designed to help traders quickly assess whether the market is bullish, bearish, or neutral by synthesizing data from trend, momentum, volatility, and price action indicators.
🧠 How We Use It at Xuantify
At @Xuantify , we integrate this indicator into our multi-layered strategy stack. It acts as a market context filter , helping us determine whether to engage in trend-following, mean-reversion, or stay on the sidelines. We use it across multiple timeframes to validate trade setups and avoid false signals during choppy conditions. This example uses MEXC:SOLUSDT.P , symbols like BINANCE:BTCUSDT or BINANCE:ETHUSDT are fine to use as well.
⭐ Key Features
Sentiment Panel: Displays normalized sentiment scores from various indicators.
Market Sentiment Meter: A synthesized score showing overall market bias. (Below image)
Oscillator View: Visualizes trend strength, momentum, and potential reversals.
Divergence Detection: Highlights when price action and sentiment diverge.
Market Sentiment Meter: A synthesized score showing overall market bias.
💡 Benefits Compared to Other Indicators
All-in-One : Combines multiple indicators into one cohesive tool.
Noise Reduction : Filters out conflicting signals by averaging sentiment.
Visual Clarity : Histogram and oscillator formats make interpretation intuitive.
Adaptability : Works across assets and timeframes.
⚙️ Settings That Matter
Smoothing Length: Adjusts how reactive the sentiment is to price changes.
Indicator Weighting: Customize which indicators influence the sentiment more.
Oscillator Sensitivity: Fine-tune for scalping vs. swing trading.
📊 Enhancing Signal Accuracy
We pair this indicator with:
Volume Profile: To confirm sentiment with institutional activity.
VWAP: For intraday mean-reversion setups.
Breakout Tools: To validate momentum during sentiment spikes.
🧩 Best Combinations with This Indicator
LuxAlgo Premium Signals: For entry/exit confirmation.
Relative Volume (RVOL): To gauge conviction behind sentiment shifts.
ADX/DMI: To confirm trend strength when sentiment is extreme.
⚠️ What to Watch Out For
Lag in Consolidation: Sentiment may flatten during sideways markets.
Overfitting Settings: Avoid tweaking too much—stick to tested configurations.
False Divergences: Always confirm with price structure or volume.
🚀 Final Thoughts
The Market Sentiment Technicals indicator is a game-changer for traders who want a 360° view of market psychology . At Xuantify, it’s become a cornerstone of our decision-making process—especially in volatile conditions where clarity is key.
🔔 Follow us for more educational insights and strategy breakdowns!
We break down tools like this weekly—follow @Xuantify to stay ahead of the curve.
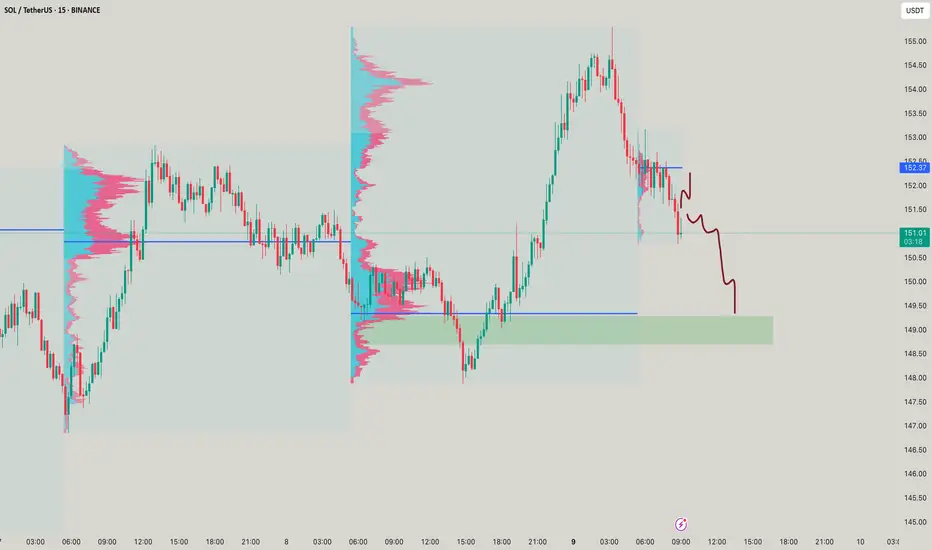
Sell signal by tiqgptMARKET NARRATIVE: The analysis across the four timeframes for SOL/USDT reveals a coherent narrative of smart money activity and price manipulation. Starting with the 1-hour chart, we observe a descending price action indicating a potential distribution phase. This is characterized by a series of lower highs and lower lows, a classic indication of a market structure shift towards a bearish bias. The presence of a significant Order Block (OB) around the $150.50 level, which has not been revisited, suggests that this level may act as a ceiling for future price actions.
Drilling down to the 15-minute and 5-minute charts, we see a continuation of this bearish sentiment with a clear Break of Structure (BOS) to the downside, confirming the shift in market structure observed on the higher timeframe. The 5-minute chart shows a rapid descent through previous low points, indicating liquidity sweeps below these levels. This action is typical of smart money inducing positions before a potential reversal or continuation.
The 1-minute chart provides a more granular view of the price action, showing recovery attempts being capped by lower highs, which aligns with the bearish market structure set by the higher timeframes. This micro-level view is crucial for pinpointing precise entries and understanding the immediate market sentiment.
INSTITUTIONAL THESIS: The overarching smart money intent appears to be a continuation of the bearish momentum, with potential liquidity targets below the current lows. The repeated failure to break above previous minor highs suggests an accumulation of sell-side pressure. Smart money may be positioning for a further push downwards, exploiting the liquidity pools formed below recent lows as retail traders are likely to have placed stop losses in these regions.
LEARNING POINT: The key concept here is the Break of Structure (BOS) on multiple timeframes confirming a bearish market structure shift. This is complemented by liquidity sweeps below recent lows, which are indicative of smart money's manipulation to trigger retail stop losses before potentially driving the price lower.
SIGNAL: SELL SYMBOL: SOL/USDT ENTRY PRICE: $148.60 STOP LOSS: $149.10 TARGET PRICE: $147.10 CONDITION: LIMIT ORDER: Place sell limit at $148.60 after a retest of the minor high on the 1M chart confirms rejection. RATIONALE: The trade is predicated on the bearish market structure across timeframes, with a recent BOS and liquidity sweeps indicating further downside. The entry at $148.60 is chosen based on the recent rejection points on the 1-minute timeframe, providing a tight stop loss just above the minor high at $149.10 to protect against potential whipsaws. The target is set at $147.10, near the next significant liquidity pool, offering a favorable risk/reward setup. STRATEGIES USED: 1H Bearish OB Continuation, Multi-Timeframe BOS, Liquidity Sweep Execution URGENCY: MEDIUM TIMEFRAME: Short-term CONFIDENCE SCORE: 75%

Solana >>> all trendlines are brokenHello guys!
As you can see, all of the trendline is broken, and after forming a double top in Solana, we can see a bearish trend is running!
I believe this downward movement will continue until the price touches the mentioned area!
The pointed area is the target level!
And the blue area has its own potential for getting long!

Solana Short Position Update – June 7, 2025We are the SeoVereign Trading Team.
With sharp insight and precise analysis, we regularly share trading ideas on Bitcoin and other major assets—always guided by structure, sentiment, and momentum.
🔔 Follow us to never miss a market update.
--------------------------------------------------------------------------------------------------------
Solana Short Position Share
Currently, Solana appears to have entered an overbought zone after a technical rebound, and the pattern is reaching the completion area of a 0.382 ratio ALT BAT (Alternative Bat) pattern.
This pattern typically appears in areas with a high possibility of price reversal, and especially the 0.382 retracement is an early reversal form unique to the ALT BAT, indicating conditions where selling pressure in the market may strengthen again.
Accordingly, entering a short position at the current level is considered meaningful in terms of pattern reliability and risk-reward ratio.
The first target price is set at $150, which corresponds to a structural support level and the target range of a short-term corrective wave.
After entry, additional downside targets can be reviewed depending on market flow and candlestick development.

Solana Approaches the Breaking Point.Solana is currently testing a key resistance zone (highlighted in purple), which has rejected the price multiple times in the recent past. At the same time, it continues to respect a well-defined ascending trendline, indicating building bullish pressure.
The blue zone marks an important horizontal support level, which served as the base for the previous breakout.
This chart is displayed in logarithmic view to better capture percentage-based price movements over time.
At the moment, price is being squeezed between:
the static resistance zone (seller area)
the rising trendline (buyer pressure)
What to watch for?
Break above resistance = potential bullish continuation
Break below trendline = possible retracement to support area
What do you think will happen next? Are you bullish or bearish on Solana?
Let me know in the comments!
If you enjoyed this post, feel free to share it with your friends!
Thank you!
#Solana #SOLUSDT #CryptoTrading #TechnicalAnalysis #LogChart #PriceAction #Breakout #SupportResistance #TradingView #Altcoins

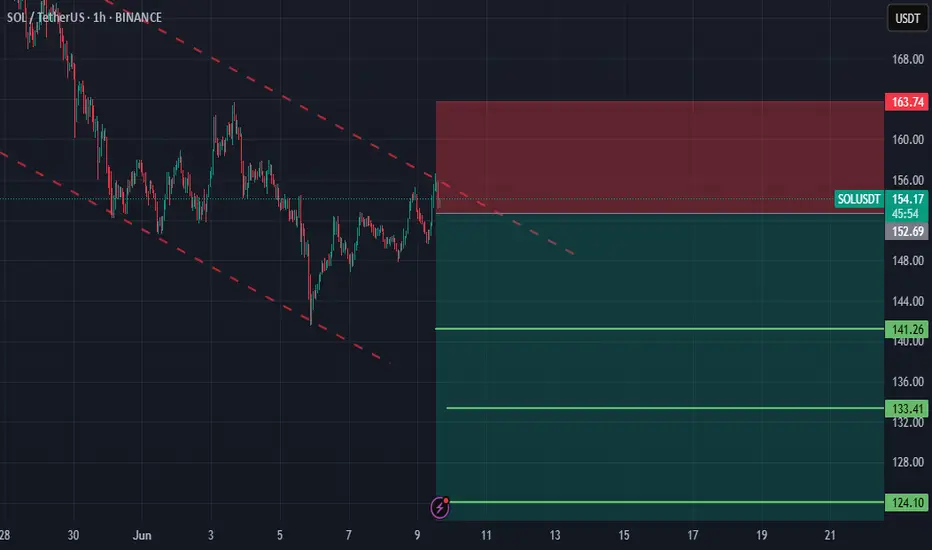
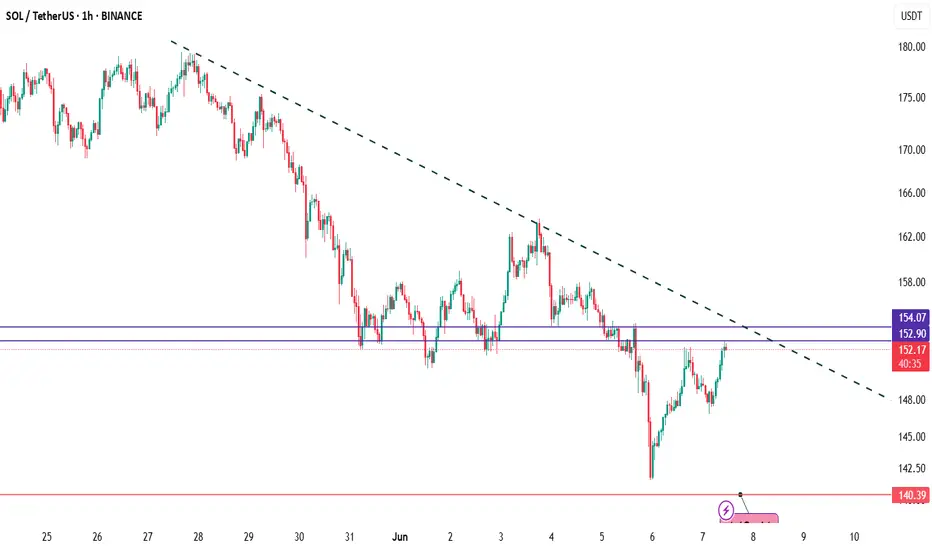
SOLANASolana is now testing a key resistance zone around $152.90 – $154.00, which overlaps with a well-respected descending trendline📉
So far, this zone has rejected price multiple times, and we’re yet to see a strong breakout or close above it. A clear move above $154 with volume could trigger a bullish breakout 🟢, targeting the $160–$166 range.
However, failure to break this level might result in another drop toward the $145 area or even revisit the $140 demand zone below. ⚠️
📌 Key levels to watch:
Resistance: $152.90 – $154.00
Support: $145.00 → $140.00
Breakout confirmation: Close above $154 on strong volume
Accurate SOL Momentum TrackerSolana Tracker with a custome SMACD Indicator tuned to track swings for swing trades. Bottom Red pass = bearish potential green line pass + bullish potential
