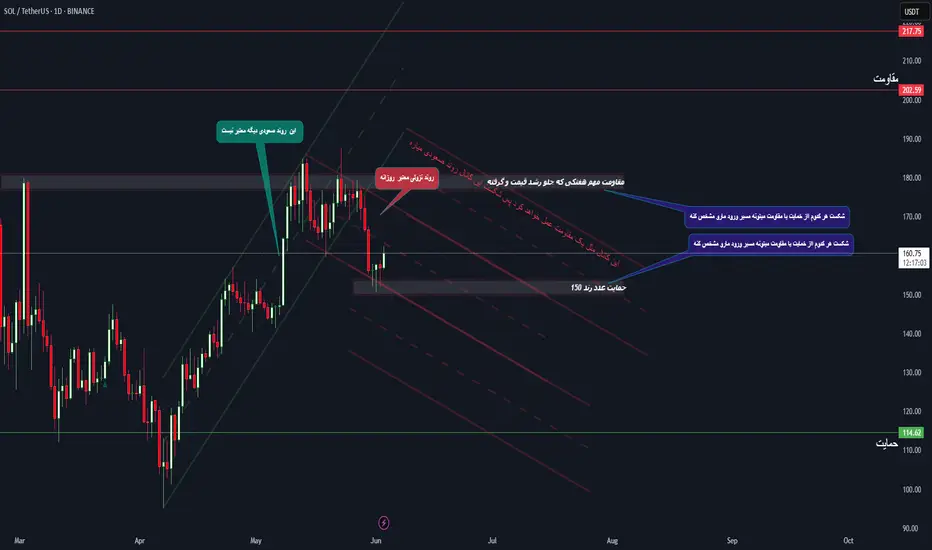
Long-Term Technical Outlook: Critical Decision Point Approaching
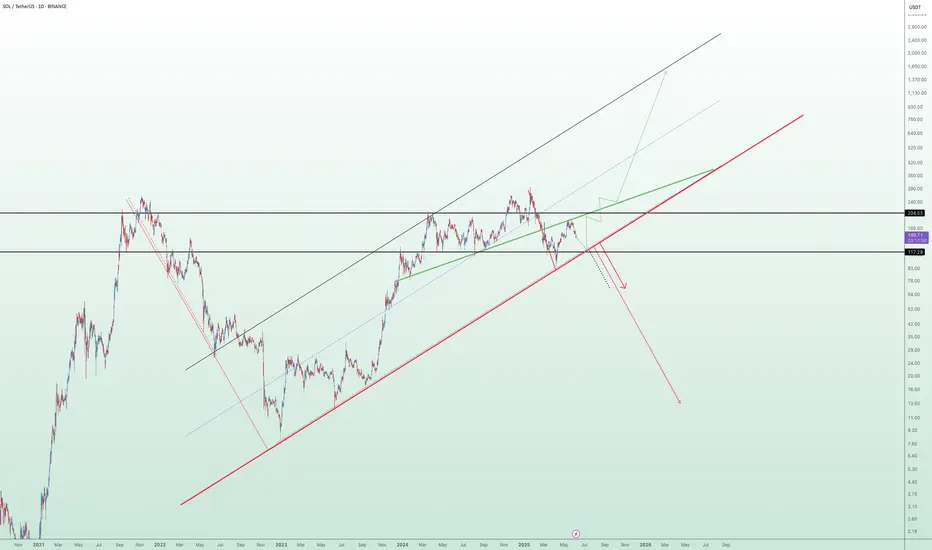
The chart illustrates a long-term technical structure where the price has been following an ascending channel after a prolonged bearish trend. However, recent price action indicates a breakdown below the green ascending trendline, raising concerns about a potential shift in market sentiment.
Currently, the $117 level is acting as a pivotal support zone. A sustained breakdown below this level — and more critically, below the red lower trendline — would validate the bearish scenario. This could trigger a deeper correction phase, with downside targets aligned along the red projection path. Such a move may lead to significantly lower price levels in the medium to long term.
🔽 Bearish Scenario:
If the price fails to hold above $117 and breaks below the red trendline, this would confirm the start of a bearish leg. Based on historical structure and projected trajectories, this could result in a descent toward the $93 level initially, with the possibility of extending further downward depending on market conditions.
🔼 Bullish Scenario:
On the other hand, if the price manages to reclaim the green trendline and more importantly, stabilize above the $204 resistance zone, it would signal renewed bullish strength. Such a move would open the path toward higher highs, potentially re-entering the previous upward channel and continuing the macro uptrend.
🧭 The price structure is now approaching a decisive zone, where either a confirmation of bearish continuation or a bullish recovery will likely unfold. Both scenarios have been visually outlined — green lines indicating bullish continuation, and red lines representing bearish momentum.
📌 Note: This analysis is for educational purposes only and should not be interpreted as financial advice.
SOLUSDT.3S trade ideas
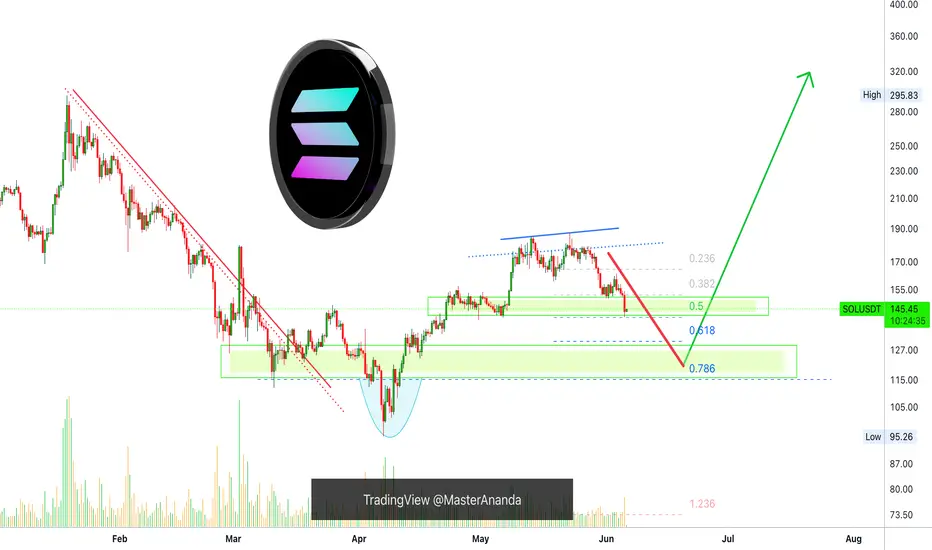
Solana Bullish, Retrace Over! Aim For $620 or $1,020 In this 2025 Cryptocurrency bull market, you should be aiming for $620 or $1,020 for Solana, $420 is the minimum.
How are you feeling today my dear friend?
I hope you are having a wonderful day.
Retraces and corrections, they can only last so long.
Solana dropped from $188 to $141 and I believe this is enough, a 24% drop (-24%).
As the retrace ends, the chart will produce a higher low and, as the higher low becomes confirmed, SOLUSDT starts a new wave of growth.
$420 is the minimum target for this bullish wave and should hit first but, you should aim higher, much higher. Crypto is showing to be many times stronger than what most people think.
Remember, the mistake we always make is not aiming too high but aiming too low. In each bull market, we tend to underestimate the market. Aim high, because we are going up.
Retraces and corrections are an opportunity to buy-in, 2nd entries, rebuy and reload.
Don't try to SHORT within a bull market, it is dangerous and not worth the risk. It is better to wait for support and go LONG. Always trade with the trend, specially if you are using leverage. Crypto is going up. Solana will now turn green.
Thank you for reading.
Namaste.

Solana Short-Term, Already Bearish After 97% UpWhat will happen in the long-term? Before we get there, let's focus on the short-term real quick because we want to know what is happening with the market now.
The market offers endless opportunities. We need to take advantage of those, our edge. We have an edge and this edge is being able to read the chart. With this edge, we can time the market and increase our trading success.
Solana grew by 97%. This is good. Of course, some pairs grew way more while others grew less. I did mentioned that when Bitcoin grows 50%, some Altcoins can grow 300%. This is exactly what happened, this is because of the size of the projects.
Some pairs grew more but these were smaller pairs. Some pairs grew less but these were bigger. That's just the nature of things.
This 97% bu-wave can be correlated to a 300-400% bullish-wave on other pairs. This means that after a growth wave comes a correction.
SOLUSDT—two main interesting levels. Won't mention them as they are shown on the chart.
Both are likely to hit but the first high is really high probability.
This is easy. Wait for support before buying again. I say "again" because you are supposed to sell at resistance, we are assuming you sold at resistance and are ready to buy at support.
Good? We are good.
The market will continue to move down and up while long-term it produces sustained growth.
We need to adapt fast and be smart, everything can change in a day.
Keep an eye on the news, we might be in front of some major event.
Political events can change everything and cannot be predicted.
Thank you for reading.
Namaste.
Will Solana Go Lower? Yes! Only To Recover HigherI've been asked: Will Solana continue lower?
I think it is a fair question but it is also pretty hard right now to say based on the chart, there are just too many mixed signals.
For example, if we take Solana in relation to Bitcoin, it is trading daily below EMA55 and MA200, while Bitcoin is trading daily above these levels. Bitcoin hit recently a new all-time high while Solana only produced a small recovery in May.
When it comes to the chart signals, SOLUSDT produced a volume breakout on the bearish side and the support zone was completely challenged on a single candle. What's more, Solana will grow really strong later this year, so it would be normal to see as much bearish action as possible now because later we will have sustained long-term growth.
It is a coin flip, but if you ask me, it can go a bit lower before moving up. It can go lower to end up producing a higher low.
I will wait for clear reversal signals before going LONG.
I closed all my LONGs a while back, when it became clear that the market was going into correction. Now we can just wait easily and patiently until the correction unravels, after the correction comes a new wave of growth. Down and up, down and up... The market continues to cycle. Never straight down, never straight up. It moves in waves.
Namaste.
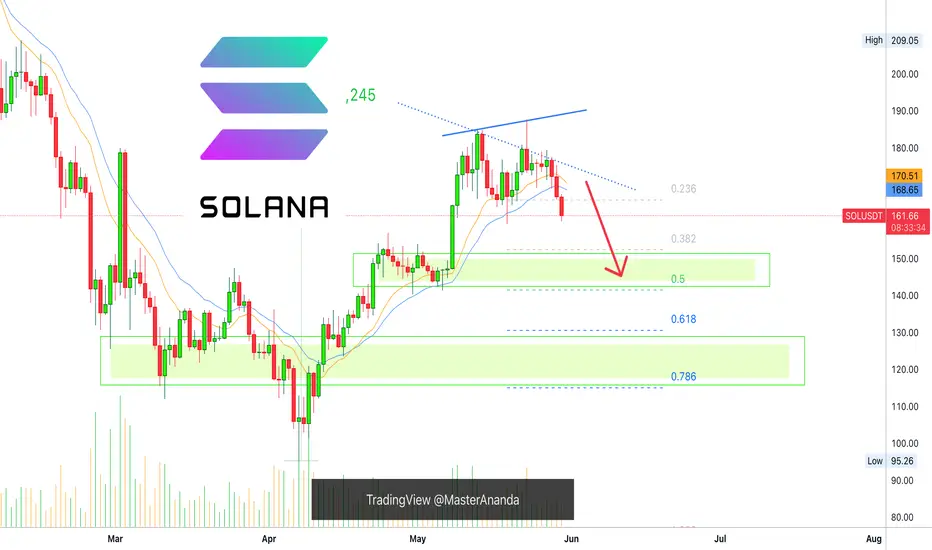
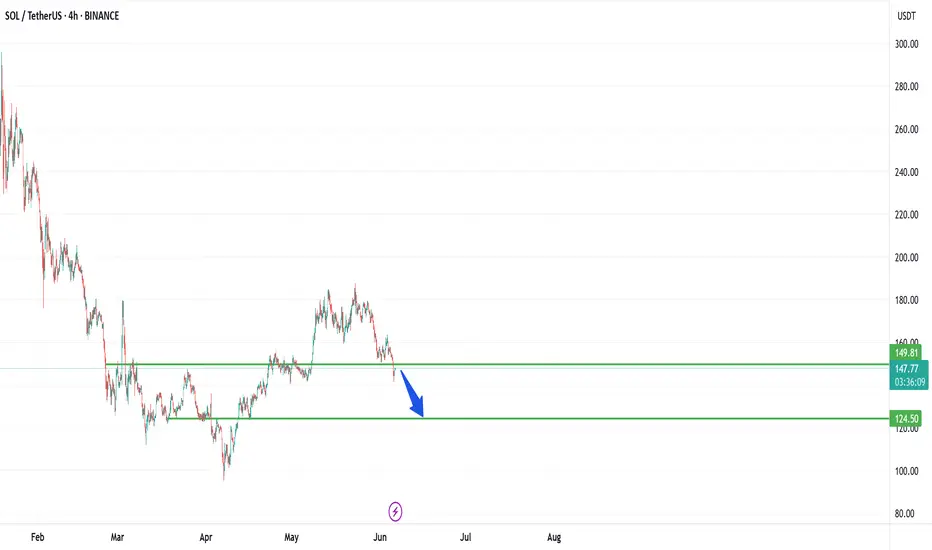
SOL/USDT Technical Breakdown: $125 Support in Sight?Key Observations:
1. Bearish Momentum Intensifying
SOL has been in a steady downtrend since its recent local high near $190, forming lower highs and lower lows on the 4H timeframe.
The current price sits around $147.63, having broken below a minor support level near $149.81.
2. Key Support Level: $124.50
The green horizontal line at $124.50 marks a critical demand zone, which acted as a launchpad during the April rally.
A clear blue arrow on the chart suggests a potential bearish continuation into that zone.
3. Structure and Price Action
The market is forming a descending channel, respecting key horizontal levels.
If the current downward pressure persists, a retest of the $124.50–$125 area looks likely.
Levels to Watch
Immediate Resistance: $149.80 – previous support now flipped
Support Zone: $124.50 – demand-based with prior reaction history
Trend: Bearish in short-to-mid term
Trade Setup Idea (Not Financial Advice)
Entry: $147–$149
Target: $125
Stop Loss: $155 (above minor structure)
Note to Traders
This setup leverages classic support-flip mechanics and momentum-based sell-offs. Watch for confirmation via volume spikes or sharp candle closes. As always, adjust sizing based on your risk tolerance.
SOL - SetupOpened another long swing position on CRYPTOCAP:SOL
Tp1 + BE : at $188 — recent highs
Tp2: at $295 — trend reversal area
Tp3: at $288 — target region
If you have any questions about my system or trade logic, drop them below — I read every comment 👇

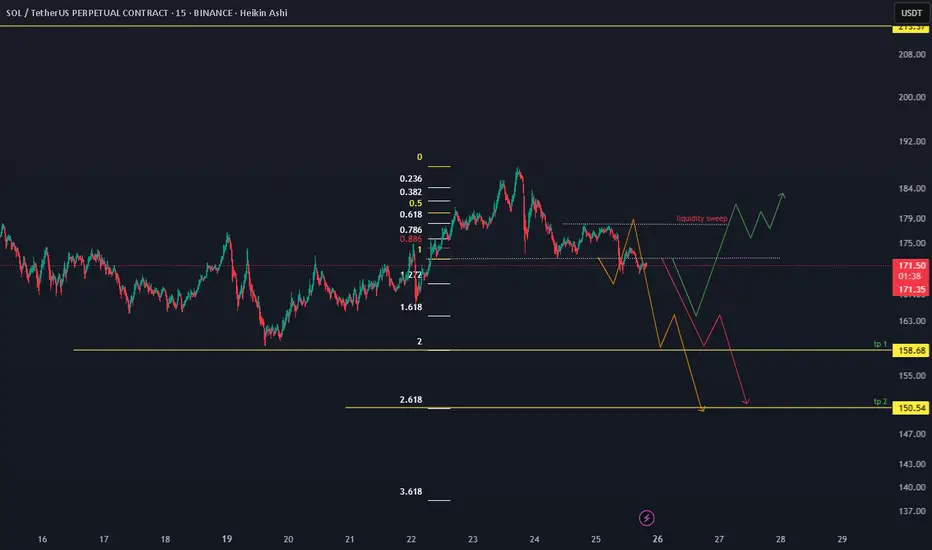
SOLUSDT 15m time frame bounce target.SOLUSDT has formed a bearish pattern on the 15min timeframe, with potential targets at 159 and 151.
I wouldn’t take a short entry here. Instead, I’ll wait for a bounce. Shorting now would be a counter-trade.
I’ve drawn a possible bounce zone, with a good entry point around the shorters’ TP2 at 151.
Another scenario involves a liquidity sweep before dropping to TP2, which would indicate a stronger bearish move.
The last possibility is a break above the liquidity sweep area, followed by consolidation and either a new high or a bullish structure formation. In that case, we could consider buying in that zone.
this is same scenario with doge but in 1hr time frame.
HolderStat┆SOLUSD rebound from supportCRYPTOCAP:SOL revisits the 150 pivot inside a corrective wedge, yet April’s growing channel stays intact. Confluence of horizontal demand, wedge resistance and prior consolidation tips a comeback toward 175, then the 185 ceiling, as long as trendline cradle support endures.

Solana Long Setup – Chart Analysis (June 5, 2025)We are the SeoVereign Trading Team.
With sharp insight and precise analysis, we regularly share trading ideas on Bitcoin and other major assets—always guided by structure, sentiment, and momentum.
🔔 Follow us to never miss a market update.
--------------------------------------------------------------------------------------------------------
Solana technical analysis is presented as follows.
Currently, Solana appears to have entered the final WAVE 5 phase of the 5-wave upward structure. The technical basis is as follows.
WAVE 5 = (WAVE 1 ~ WAVE 3) × 0.618
This length ratio is commonly observed in Elliott Wave Theory and often appears in the final wave of a strong trend. At the current level, this ratio is applied accurately, leaving room for further upside.
Confirmation of the Shark Pattern
One of the advanced harmonic patterns, the Shark pattern, has been completed within a valid zone, acting as a bullish reversal signal. In particular, reversals occurring at the 88.6% and 113% levels provide high reliability.
Comprehensive Assessment
With both of these technical elements satisfied simultaneously, the current level offers a solid basis for entering a long position.
1st target: 158.20
This price level aligns with a major structural resistance and Fibonacci extension zone, making it an appropriate target for short-term profit-taking.

Solana Can Go Up AgainBINANCE:SOLUSDT.P
I am sharing this analysis for myself, it is not investment advice.

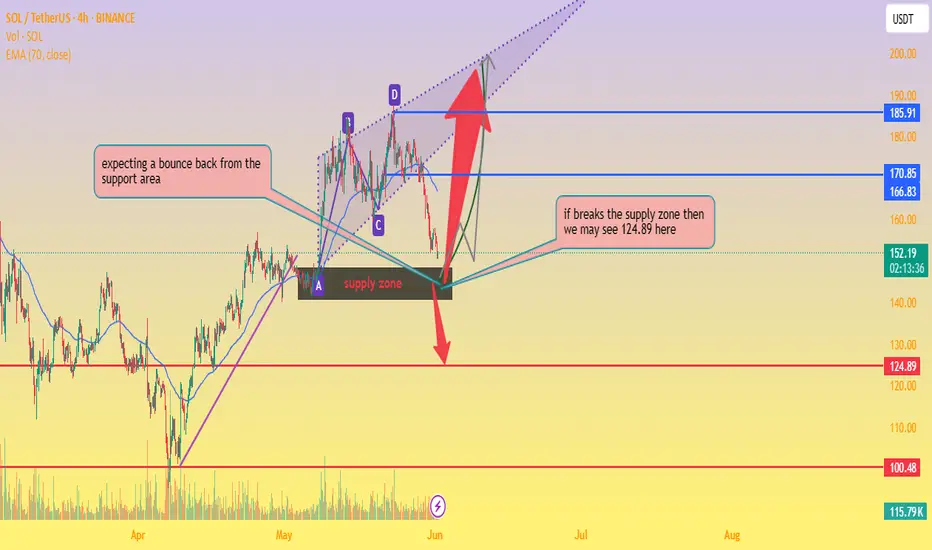
SOL/USDT Key Reversal Zone – Bounce or Breakdown?📊 Chart Analysis:
Current Price: $151.91
EMA 70 (Dynamic Resistance): $166.82
Support Area: Around $150, overlapping with a key supply zone.
Chart Pattern: Harmonic/ABCD structure completing near support.
🧠 Observations:
Price is testing a strong support/supply zone.
📦 If bounce occurs, potential targets:
🎯 First Target: $170.85
🎯 Second Target: $185.91
📉 If support breaks, then:
⚠️ Target: $124.89
📉 Next Major Support: $100.48
🧭 Trade Plan:
🔹 Long Entry (on bullish confirmation):
Entry: $152–$155
SL: Below $149
TP1: $170.85 🎯
TP2: $200 🚀
🔹 Short Entry (on breakdown confirmation):
Entry: Below $148
SL: Above $153
TP: $124.89 🧨
support and drop down your thoughts about it thanks
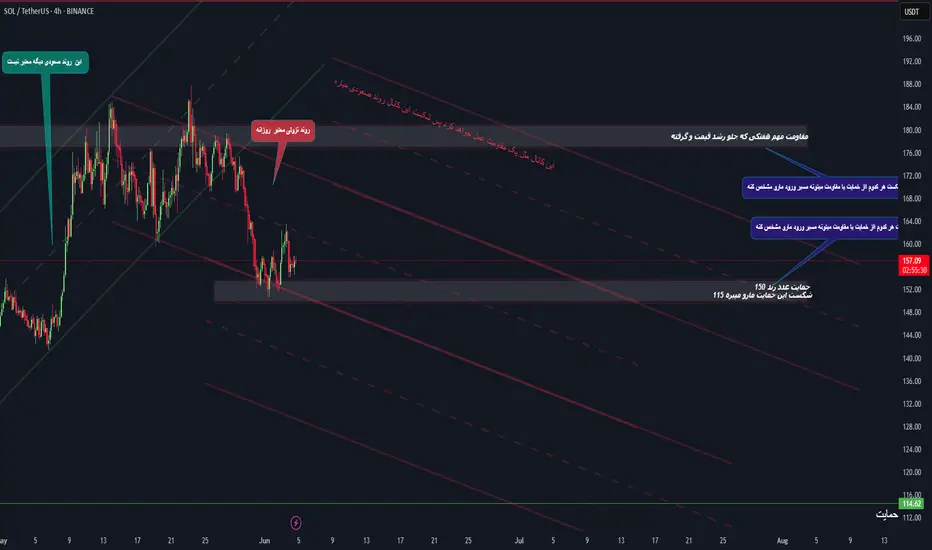
SOL Structural Analysis – Facing Weekly Resistance and Key LevelOn the 4H chart of Solana (SOL), the price has broken out of a temporary bullish trend and entered a clearly defined descending channel.
🔸 The major resistance around $164–$172 could limit further upside in the short term.
🔸 A confirmed breakdown below the $150 support may lead to a deeper correction toward the $115 zone.
🔸 The descending channel is currently guiding price action, and reactions to its midline and upper boundary will determine the next major move.
🔸 The analysis distinguishes between short-term impulses and the dominant daily downtrend, helping identify potential trade setups.
📌 This analysis is for educational purposes only.
SOL final push downSOL is currently consolidating and building liquidity.
For a short position, we need to see a liquidity sweep into the supply zone, supported by the volume profile, followed by the price breaking below the 200-period EMA for final confirmation.

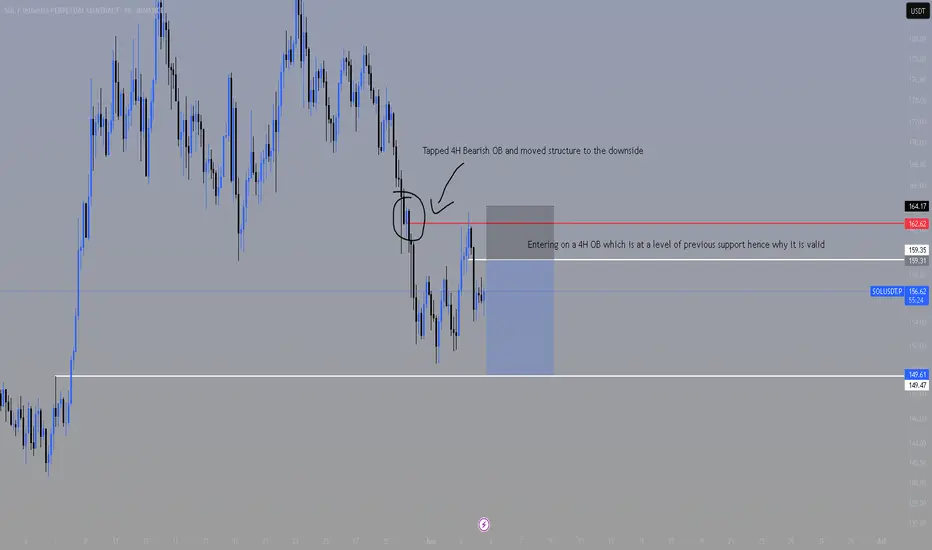
SOLANAA scalp on solana here. We have generally a short term downtrend with confirmation
Hence I was looking for shorts.
I identified a valid Bearish OB because it lies near previous support level thus entering on the body of this OB.
Putting my SL above local highs and target closest 4h demand zone.
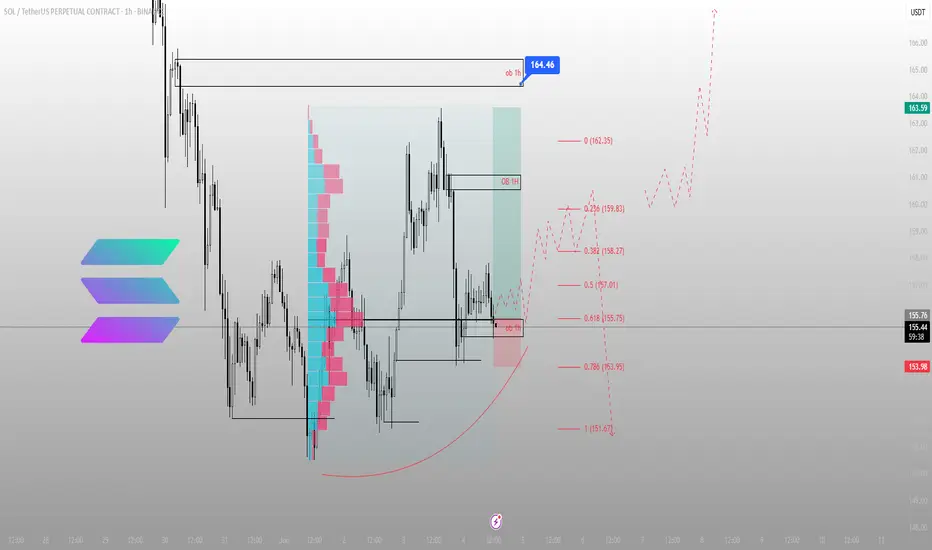
Price respected the level. The rest is execution.BINANCE:SOLUSDT just tapped the 1H OB near 155.75 — a zone defined by structure, not emotion. If you’ve been following the narrative, this isn’t a dip. It’s reaccumulation before displacement.
Here’s the setup:
Price tagged the OB at 155.75, perfectly aligning with the 0.618 fib — the algorithm’s comfort zone
Below this lies 153.95 — the invalidation level for the long idea
First upside target sits at 158.27 → then 159.83 → then a full rotation into 164.46, where we meet a 1H OB stacked with prior inefficiencies
The volume profile shows clear acceptance in this range. If we hold and rotate back above 157.01 with strength, expect continuation. If we sweep below 153.95 and fail to reclaim, the idea flips.
Execution clarity:
Longs from 155.75–155.00, invalidation below 153.95
First reaction target: 158.27
Full structure target: 164.46
Below 151.67 = deeper reprice scenario into weekly inefficiencies
No noise. No hype. Just structure. The chart is clean — the plan is already in motion.
Want more setups like this before they move? Profile description has them.

Solana Still Bearish, Moving LowerI will alert you here when the bearish potential is completely nullified. Right now, Solana is still bearish. This applies to all other major projects that I shared recently but I will also update those.
The maker produced a rejection yesterday, 3-June, as a lower high. This implies a bearish continuation. The two levels mapped on the chart are the main support zone.
Since the first level is already being challenged, we can aim for the second one.
Once the correction is over, we will go bullish again.
Some of the smaller altcoins can grow while the rest of the market crashes down. Choose wisely. It will be hard right now.
Namaste.
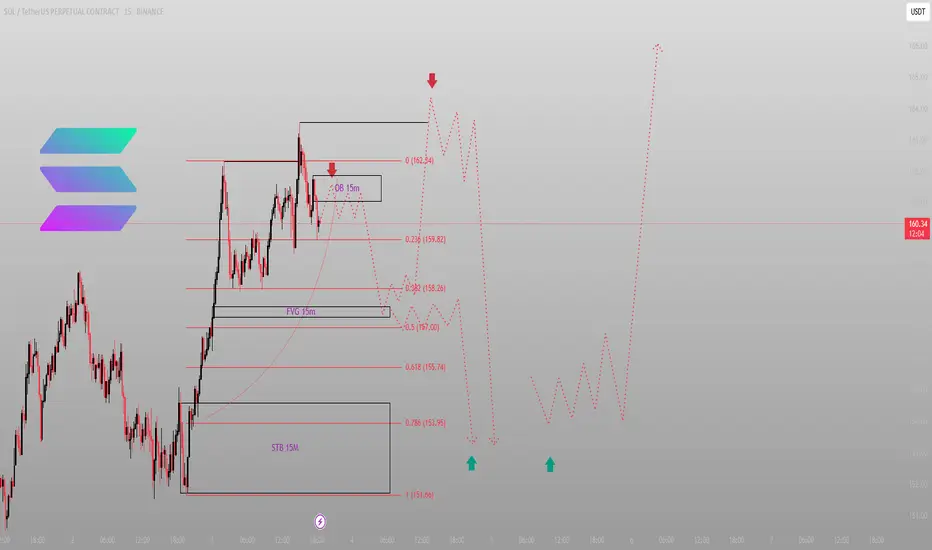
Smart Money doesn’t chase. It collectsSOL just rejected off a 15M OB — not by accident, but by design.
The market isn’t bullish or bearish here. It’s preparing to offload the next wave of liquidity.
Here's the logic:
Price hit 162.34, sweeping liquidity and rejecting inside a 15M OB
That rejection aligned with confluence at 0.0 fib — engineered resistance
We're now coiling just above 0.236 (159.82), with a roadmap back into inefficiency
FVG at 15M sits cleanly between 158.26 and 157.00. This is where premium meets discount and where most will hesitate. I won’t.
If we get that flush lower — 155.74 → 153.95 becomes the key liquidity zone.
STB at 151.66? That’s the ultimate draw if this unravels cleanly.
Execution plan:
Short-term bounce is valid only if 159.82 holds — anything below 158.26 confirms bearish leg
I want to buy from 153.95–151.66 — that’s where price will seek to rebalance
Break 162.34 impulsively? Re-evaluate — structure is shifting
This isn't a reaction trade. It's engineered delivery.
More entries like this, built off logic not noise? You know where to find them — profile description.
HolderStat┆SOLUSD channel surferCRYPTOCAP:SOL exited a falling channel, built a clean growing channel and parked on 165 USDT support. Repetitive consolidation mid-way and a projected path to the 190 USDT level underscore continuing strength, with trendline confluence favoring upside continuation.

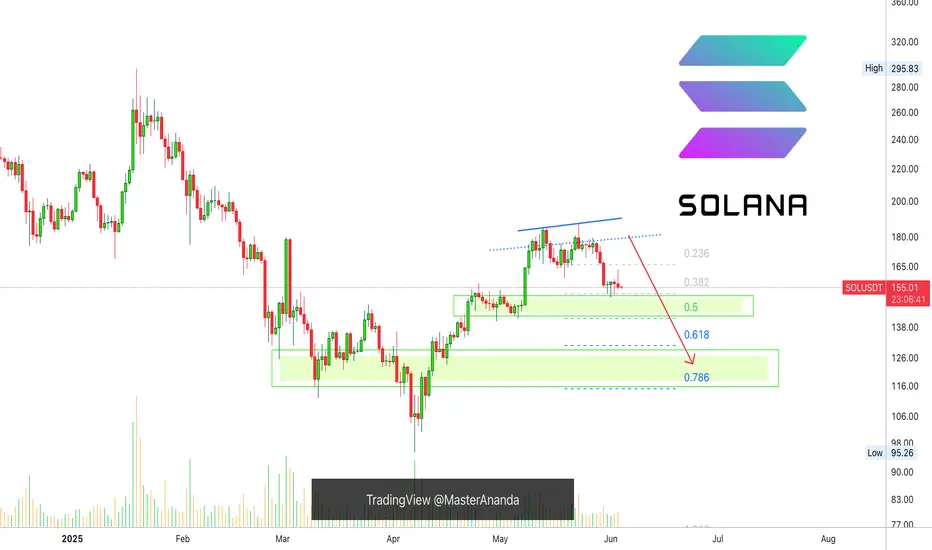
Solana Bounces From 0.618 Fib — Bullish Structure Eyes Rotation Solana (SOL/USDT) has respected its 0.618 Fibonacci retracement level, which aligns with a high-timeframe higher low in the ongoing bullish market structure. If this level continues to hold, Solana may be preparing for a rotation toward $175—and potentially beyond.
The current support level is not only a Fibonacci retracement zone but also represents a structural higher low in Solana’s trend. As price bounces from this area, the bullish market structure remains intact, characterized by consecutive higher highs and higher lows. This setup suggests that Solana is merely in a corrective phase before a potential continuation.
Key Technical Points
- 0.618 Fibonacci Confluence: Aligned with a key higher low in the structure, this level is providing strong technical support.
- $175 as Immediate Resistance: A breach of this level could open up a continuation move toward $200 and $216.
Bullish Market Structure: Solana continues to print higher highs and higher lows, maintaining the integrity of the uptrend.
If Solana successfully reclaims and breaks above $175, it would confirm a short-term shift in momentum. This move would likely accelerate price toward $200—the next psychological and technical level. If that level is breached as well, the door opens for a rotation toward the $216 high, completing the current projected trend wave.
As long as the 0.618 Fibonacci support holds, Solana remains bullish. A clean move above $175 would confirm the trend continuation, with $200 and $216 as the next logical upside targets. Watch for strong volume on the breakout to validate the move.

SOL Ready for Explosive Move? | Must-Watch Levels Ahead!📈 SOLANA is at a major turning point! After breaking down from the bullish channel, it's now testing the demand zone around 150. But here’s the catch...
🚨 A new bearish trend channel is forming, and we’re at a key decision point:
Breakout = 🚀 bullish continuation
Rejection = 🔻 more downside to come
💡 Key insights from this chart:
✅ Old bullish structure is invalidated
✅ Red trend channel now in control
✅ Watch the gray demand zone and reaction to minor resistance levels
✅ Macro resistance at 202–217 still untouched!
🎯 Levels to watch:
Support: 150 – 114
Resistance: 170 → 202 → 217
📌 If you trade SOL, you don’t want to miss this setup. Follow for more alpha!
🧠 Made by: TradeWithMky – where altcoins speak louder than Bitcoin!
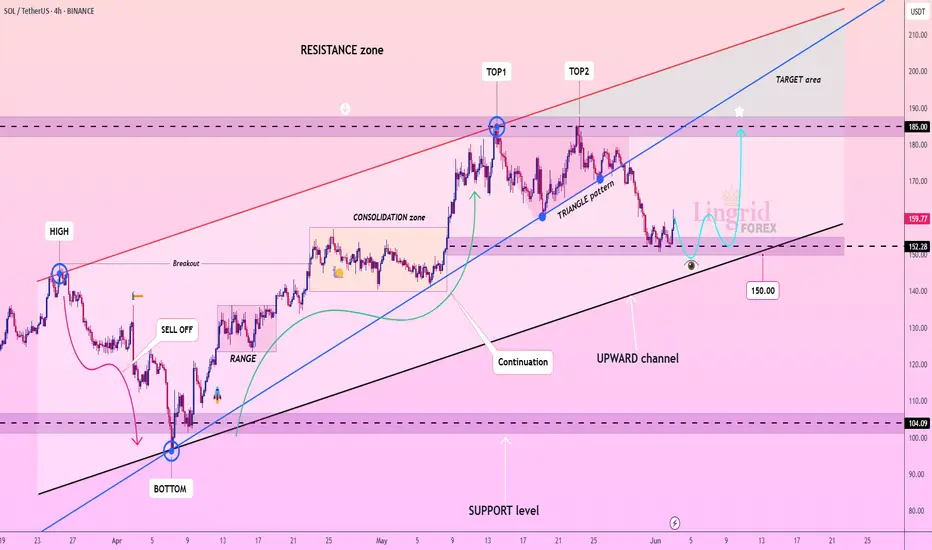
Lingrid | SOLUSDT channel Continuation Pattern Eyes Higher LevelThe price perfectly fulfilled my previous idea . BINANCE:SOLUSDT has declined from the double top structure (TOP1 & TOP2) and is now resting within a support box around the 152–160 zone, which coincides with the lower bound of the upward channel. The price action shows a potential bounce setup forming with a projected move toward 185 if bulls reclaim momentum. A successful rebound from the black trendline could trigger a new impulsive wave toward the upper resistance region.
📈 Key Levels
Buy zone: 150.00–160.00
Buy trigger: bounce from 152.00 trendline
Target: 185.00
Sell trigger: breakdown below 150.00
💡 Risks
Continued weakness could break the uptrend channel
Failure to close above 160.00 would weaken rebound prospects
Broader market downturn may override the setup
Traders, if you liked this idea or if you have your own opinion about it, write in the comments. I will be glad 👩💻
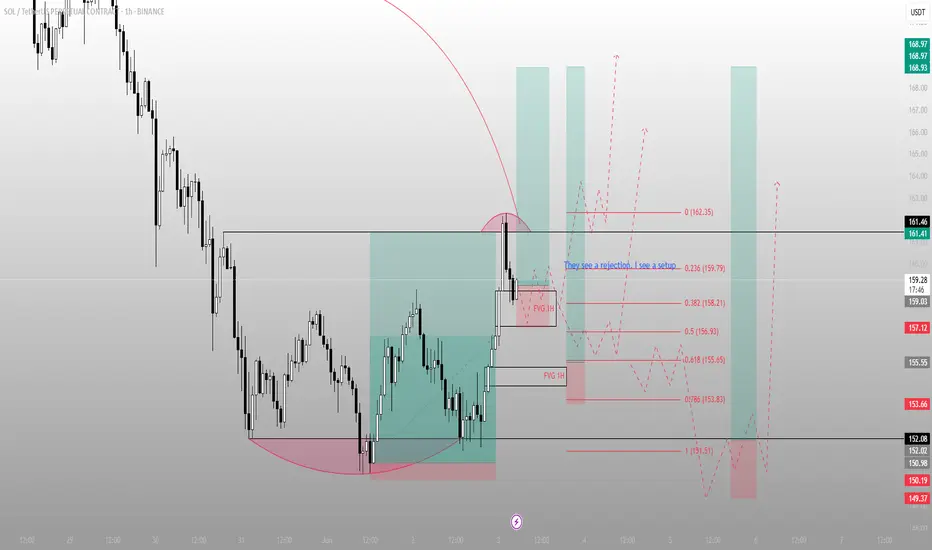
They see a rejection. I see a setupSOL swept the low, ran back to premium, and is now hovering in a reactive FVG.
Most traders see uncertainty here — but this is exactly where structure sharpens.
Here’s what just happened:
Price reversed off a well-defined STB and reclaimed the inefficiency above
It pierced into 162.35 before rejecting — not a failure, but a setup
That move left behind two stacked 1H FVGs
We’re now in the upper one — a re-entry pocket if you understand what this is
This zone between 158.21 and 156.93 is where I expect a reaction. If it holds, structure is preserved and the push toward 161.41 → 168+ resumes.
If it fails, we likely probe 153.83 or deeper into 151.51 — one last shake before the run.
Bias: Long
Trigger: Clean reaction off 1H FVG, higher low formed
Invalidation: Below 151.51
Target: 162.35 first, then 168.93+ on continuation
More setups like this — structured, timed, no fluff — are in the profile description.
No group chat noise. Just levels that matter.