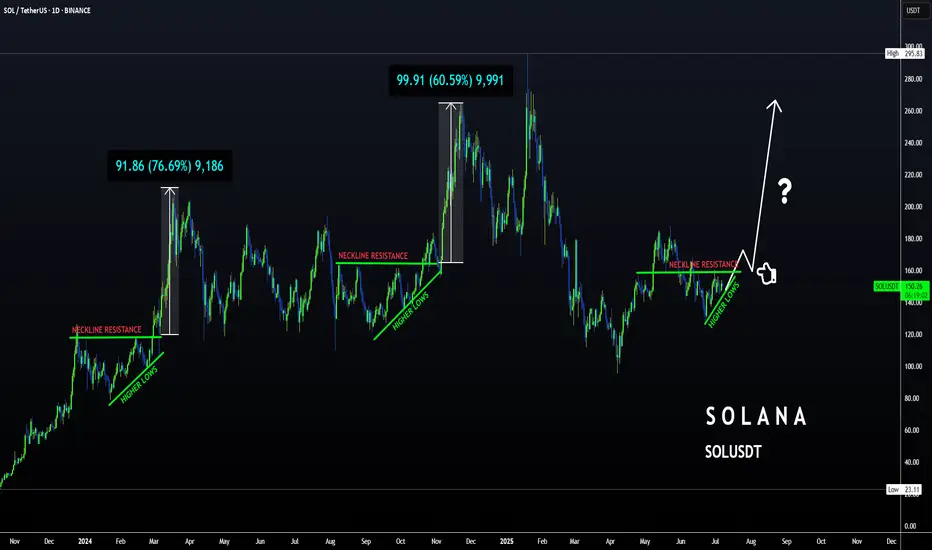
SOLANA Loves THIS Pattern | BULLISHSolana usually increases alongside ETH. Possible because its a big competitor.
We can see SOL follows ETH very closely, with the exception of dipping earlier than ETH by a week:
In the 4h, we see a push to breakout above the neckline resistance:
In the daily timeframe, SOL is just about to break out above the moving averages - which would be the final confirmation of a bullish impulse to come:
Could this pattern be the confirmation of the start of another big pump for SOL?
_______________________
BINANCE:SOLUSDT
SOLUSDT.P trade ideas
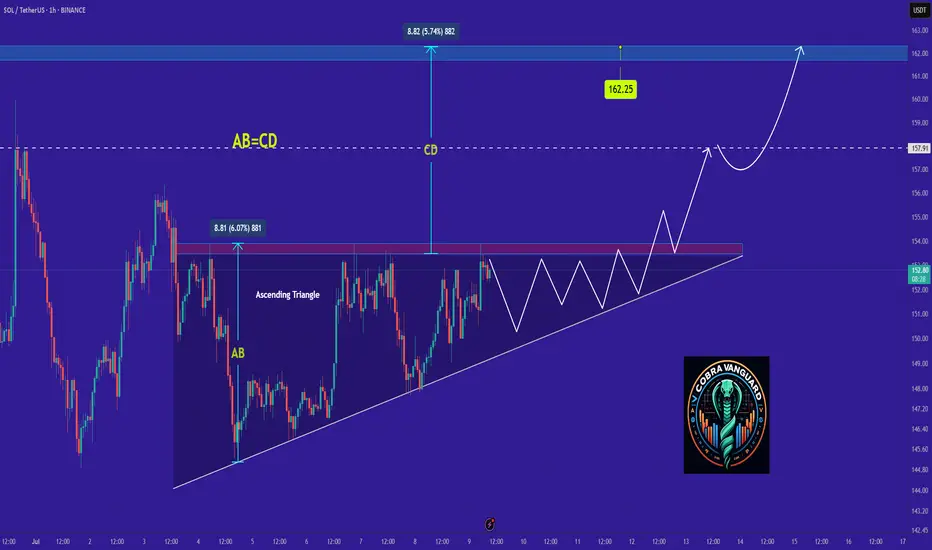
SOLANA's Situation, A Comprehensive Analysis (1h) !!!The price on the 1-hour timeframe is within an ascending triangle, which can be promising. If the price breaks this pattern with bullish candles, it could easily rise by the distance of AB=CD .
Best regards CobraVanguard.💚
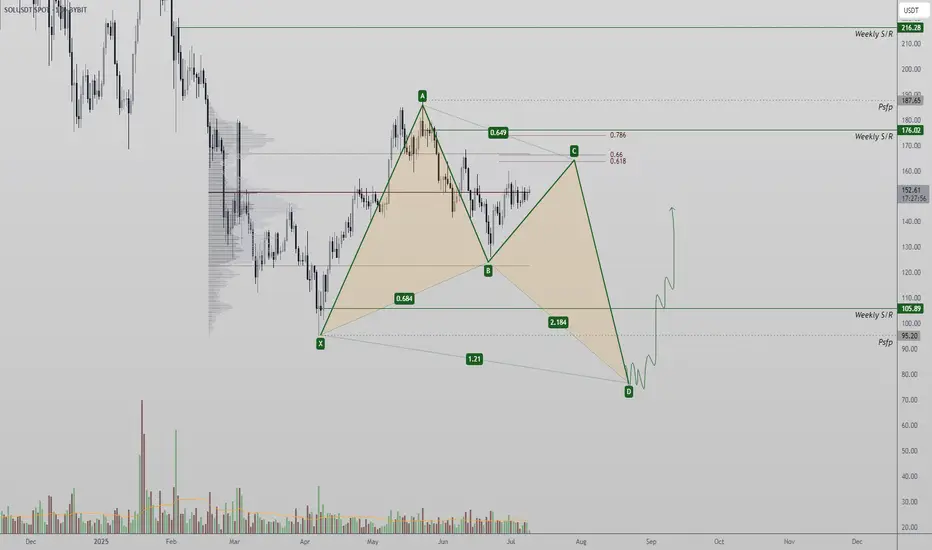
SOL Harmonic Setup — $95 Sweep May Precede Rally Toward $200 +Solana may be forming a rare bullish harmonic pattern, suggesting a possible sweep of the $95 low before a reversal targets the $200 region. Critical resistance levels remain key in the short term.
Solana is showing early signs of a high-probability harmonic setup that could lead to a powerful bullish reversal — but not before a potential sweep of the recent $95 low. From a technical perspective, price is currently trading near the point of control, battling resistance layers that may trigger the next corrective leg in the pattern. If confirmed, this harmonic could produce a textbook C-to-D leg completion before launching a move toward the $200+ zone.
Key Technical Points:
- Point of Control Battle: Price is currently testing the POC with weak momentum
- Resistance at Value Area High + 0.618 Fib: Confluence zone could trigger rejection
- C-Leg Completion Around $95: Potential low before bullish harmonic activates toward $200+
Solana’s price action has entered a critical zone of decision. Price is hovering near the point of control — the highest volume-traded level in the current range — and is now contending with a strong confluence of resistance just above. This includes the value area high and the 0.618 Fibonacci retracement, both of which have historically produced strong rejections.
If Solana fails to break through this resistance cluster with conviction, it increases the probability of a C-leg rejection within the emerging bullish harmonic pattern. This corrective move could send SOL back down toward the $95 region, sweeping the previous low and completing a technical bottom.
Such a move — while bearish in the immediate short term — would not invalidate the bullish thesis. In fact, a sweep of $95 could act as the final leg (D) completion of what may evolve into a textbook “godly harmonic” pattern. These structures are rare and powerful, typically resulting in sharp reversals when key conditions align. The eventual upside target for this move lies in the $200+ region, in line with the prior macro swing highs and high time frame resistance levels.
Until this scenario is confirmed or invalidated, Solana remains range-bound between major high time frame levels. Traders should stay alert for signs of rejection at current resistance — or, conversely, a volume-backed breakout above the value area high that would negate the harmonic setup.
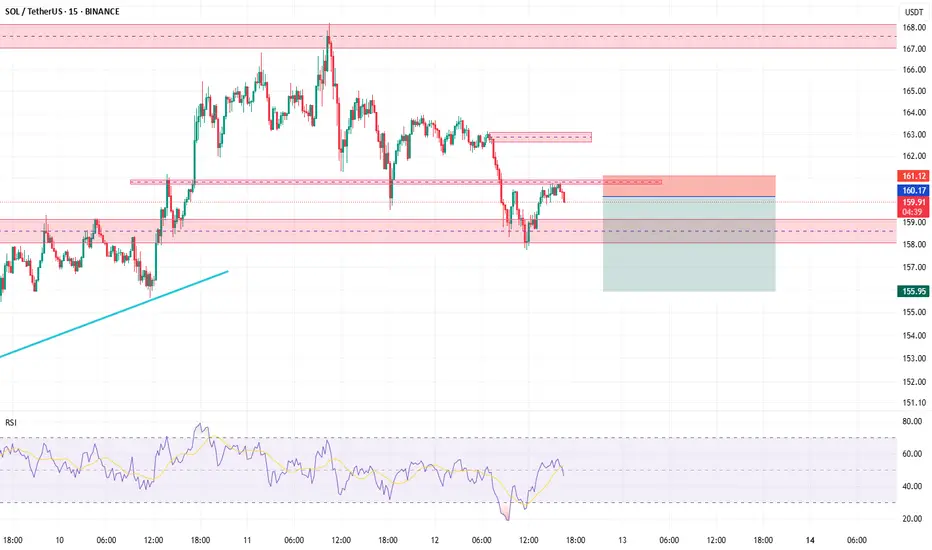
SOL/USDT Scalp Setup: Shorting the Break of StructureThis trading setup outlines a short-term, or scalp, short position on the SOL/USDT pair on the 30-minute timeframe. The logic is fundamentally based on a confirmed market structure shift from bullish to bearish.
Technical Analysis of the Setup Components:
Ascending Trendline Break: The first warning signal is the decisive break of the primary ascending trendline (green line). This indicates a weakening of buyer strength and a loss of bullish momentum.
Change of Character (CHoCH): Following the trendline break, the price failed to create a new higher high. Instead, it formed a lower low than the previous one, signaling a "Change of Character" in the market structure from bullish to bearish. This is a key signal to start looking for short opportunities.
Break of Structure (BoS) Confirmation: By breaking a significant prior support level, the price created a bearish "Break of Structure" (BoS). This move confirms the new downtrend and suggests that sellers are now in control of the market.
Strategic Entry Point: The entry is set at $161.12. This area represents a broken support zone that is now expected to act as resistance (a classic Support-Resistance Flip). Entering on a pullback to this broken structure is a high-probability strategy for joining the new trend.
Risk and Reward Management:
Stop Loss (SL): The stop loss is placed at $162.07, just above the most recent lower high. This is a logical placement, as a price move above this level would invalidate the current bearish scenario.
Take Profit (TP): The take profit is targeted at $156.90, near the next major support or demand zone, making it a reasonable objective for the bearish leg.
Risk/Reward (R/R) Ratio: The setup offers an excellent risk/reward ratio of 4.44 to 1. This means the potential profit is more than four times the potential loss, which is highly favorable from a risk management perspective.
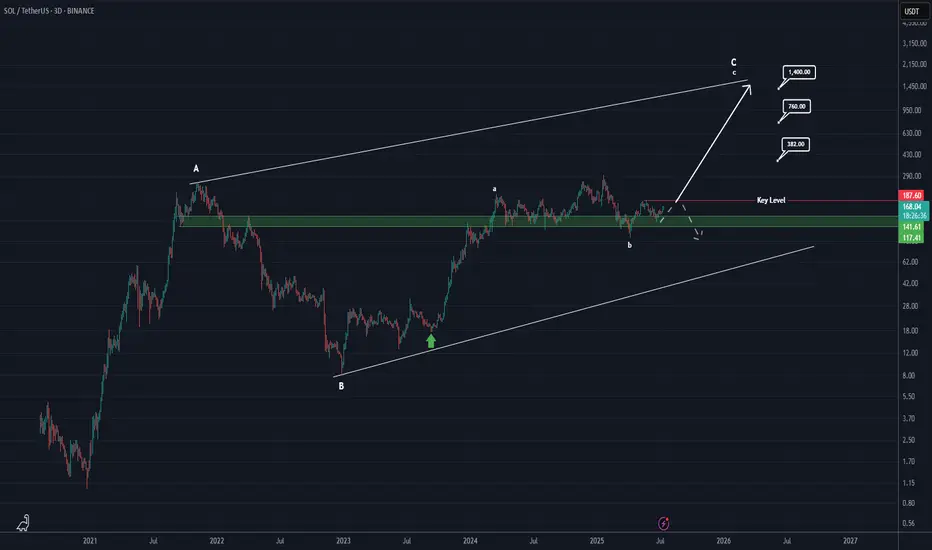
Will Solana reach $1400?After analyzing Solana’s complete data, it appears that a large diametric pattern is forming in the long term.
Currently, it seems we are in wave c of C.
If the key level of $187 is broken and price consolidates above it, we can be much more confident that we are indeed in wave c of C, confirming this scenario.
However, if the price fails to break and hold above $186 on higher timeframes like the 3D or weekly, and gets rejected downward, this scenario will be invalidated.
If confirmed, the targets for wave c of C are marked on the chart.
For risk management, please don't forget stop loss and capital management
When we reach the first target, save some profit and then change the stop to entry
Comment if you have any questions
Thank You
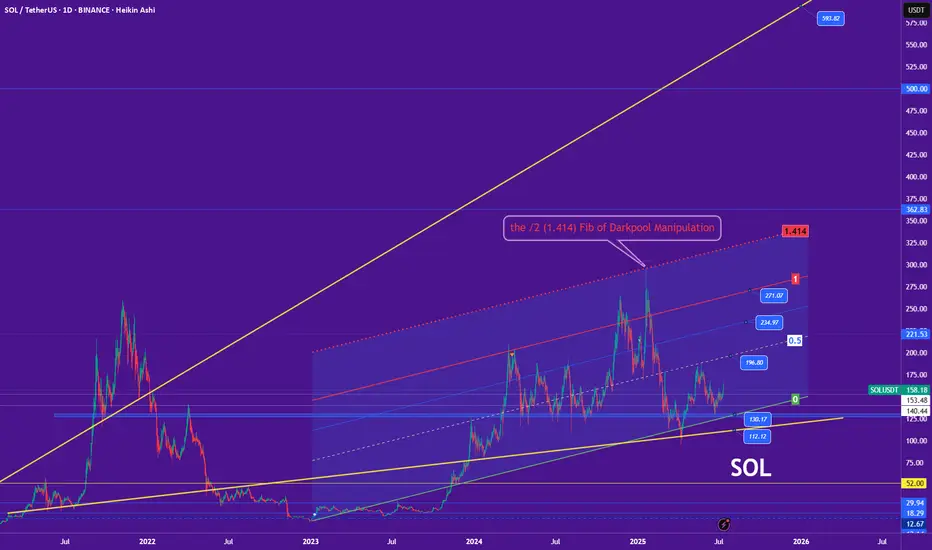
The 1.414 Fib – Smart Money’s Darkpool Fib📐💸 The 1.414 Fib – Smart Money’s Darkpool Fib 🔍🧠
Let’s talk about the 1.414 Fibonacci extension — also known as √2 — a subtle but deadly precise level that smart money uses to trap retail.
We saw this play out perfectly on Solana.
That ~$295 zone (close to 300$ but 'no cigar') ?
That was the 1.414 Fib , and it nailed the top before a brutal reversal — a textbook darkpool distribution move.
But Solana wasn’t alone.
🔁 This Isn't Just About SOL
The 1.414 (√2) level has repeated across the crypto market , quietly acting as a marker for institutional exit zones:
📉 It showed up on multiple altcoins in December 2024, just before the entire altcoin rejection
🟠 It’s even been visible recently on Bitcoin itself — yes, even the king of crypto respects this level
So no — this isn’t random. This level has a story to tell.
🤖 Why 1.414 Matters
Most retail traders fixate on the golden ratio: 1.618.
But the 1.414 (√2) is just as important — and arguably more manipulative.
It allows institutions to:
- Front-run major Fibs
- Exit quietly
- Trap late bulls
It’s less obvious, less crowded, and often more effective.
That’s why I call it the "Darkpool Fib."
💔 Why I’m Divorcing Altcoins — But Not Yet
Solana’s chart — and its story — are symbolic of a deeper shift in me as a trader.
I’ve made the decision: at the end of this cycle , I’ll be divorcing altcoins.
Not out of hate — but out of clarity. I won’t “believe” in them anymore. I’ll just trade them.
But let’s be clear:
That moment isn’t now.
Right now, I’m still bullish. I still see opportunity. I’m here to ride the structure — while it’s still giving, or at least going to give something back.
📍Take Solana...
🔹 It was built on Rust, a language praised for speed and performance — perfect for high-throughput, data-heavy blockchain architecture
🔹 It could have been the chain that led us into the future
🔹 Instead, it’s become a memecoin playground , with repeated outages and centralized concerns
I don’t hate it. I just don’t believe in it the way I used to.
Narratives die. Structure doesn’t.
So yes — I’m trading SOL. I respect its levels. But I’ve let go of the idea that it will “change the game.”
I’ll trade the rally. I won’t marry the story.
📊 The Technical Setup
[📍 Support Zone: $153.48 $140.44
Below that, deeper support at $130.17 and $112.12
📍 Current Price: ~$158
📍 Upside Targets:
Minor: $196.80
Mid-channel: $221.53
Structural resistance: $234.97
Upper red trendline: $271.07
Final Extension: ~$325–$362
Potential: 271$, 362$, 490$(close but no cigar of the 500$ mark), 593$ technically is the ultimate resistance.
If Solana reclaims its momentum, this setup gives plenty of upside. But let’s be surgical. We are traders first.
⚠️ Final Thought
We’re in the phase of the cycle where hope is expensive.
Structure is free — if you choose to follow it.
Buy over support
Exit near resistance
Trade the level — not the label
One Love,
The FXPROFESSOR 💙
Disclosure: I am happy to be part of the Trade Nation's Influencer program and receive a monthly fee for using their TradingView charts in my analysis. Awesome broker, where the trader really comes first! 🌟🤝📈
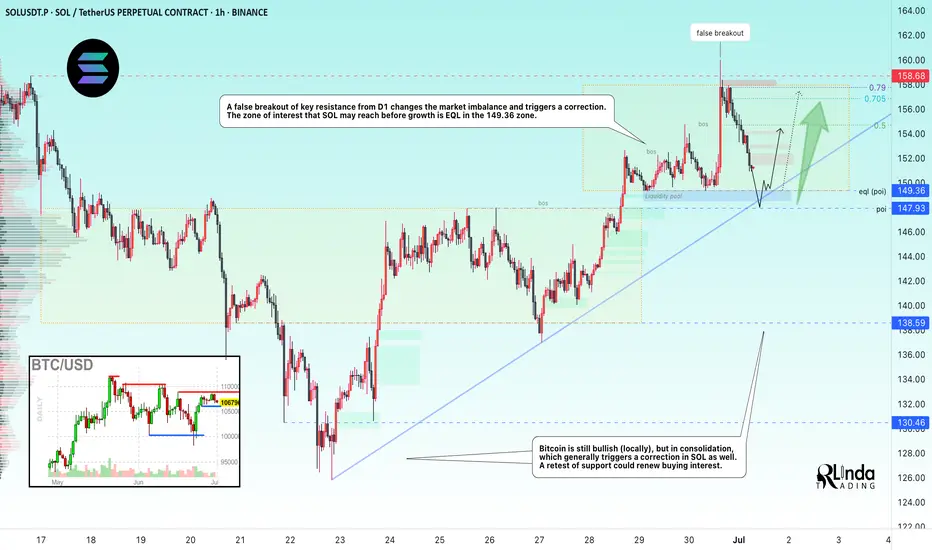
SOLUSDT → Countertrend correction and hunt for liquidityBINANCE:SOLUSDT looks quite promising on the bullish side. The price is testing one of the key resistance levels within the local trend rally. A correction is forming. Is it beneficial for us?
On the higher timeframe, we see a change in character, a breakout of the trend resistance, and the formation of an upward trend support line. Bitcoin is still bullish (locally) at this time, but it is consolidating, which generally provokes a correction in SOL as well. Focus on the 150-149 area. If the bulls are able to keep the price above this zone after the retest, followed by the formation of momentum, this can be considered a positive medium-term sign.
Locally, the price within the trading range of 149.36 - 158 is heading towards the area of interest and liquidity (eql) at 149.36. The current sell-off is most likely triggered by a large player seeking a more favorable entry into the market.
Resistance levels: 154.75, 156.8
Support levels: 149.36, 147.93
In the current situation, it makes the most sense to consider an intraday trading strategy. A countertrend correction and a retest of support could attract buyers...
Best regards, R. Linda!
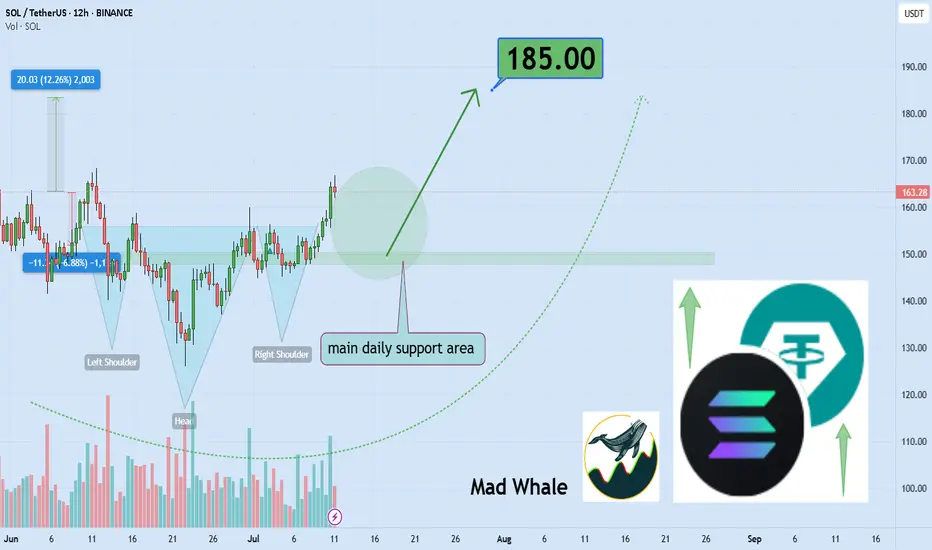
Can SOL break out strong and rally 12% to $185?Hello✌
let’s dive into a full analysis of the upcoming price potential for Solana📈.
BINANCE:SOLUSDT is forming a clear inverse head and shoulders pattern near a strong daily support zone, signaling a potential trend reversal. This setup suggests at least a 12% upside, targeting $185, marking a promising start for SOL’s next bullish move. 📊🔥
✨ Need a little love!
We pour love into every post your support keeps us inspired! 💛 Don’t be shy, we’d love to hear from you on comments. Big thanks , Mad Whale 🐋
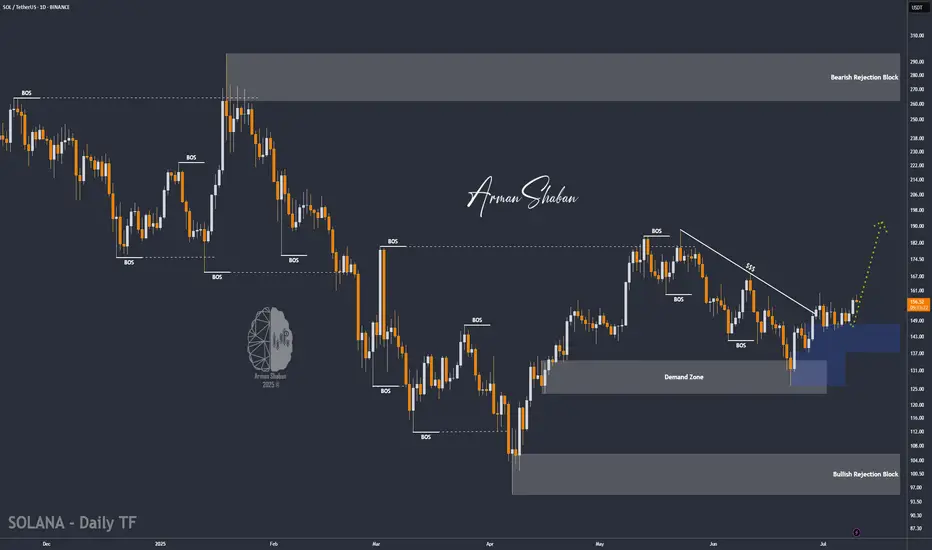
SOL/USDT : SOL Rebounds Strong – Is a 25% Rally Just Beginning?By analyzing the Solana (SOL) chart on the daily timeframe, we can see that after dropping to the $147.75 zone, the price experienced renewed buying pressure and has since rallied to around $159, delivering over 6% return so far.
This cryptocurrency shows strong bullish potential, with short-term gains possibly exceeding 25%.
The next upside targets are $168.5, $187, $220, and $263.
Please support me with your likes and comments to motivate me to share more analysis with you and share your opinion about the possible trend of this chart with me !
Best Regards , Arman Shaban
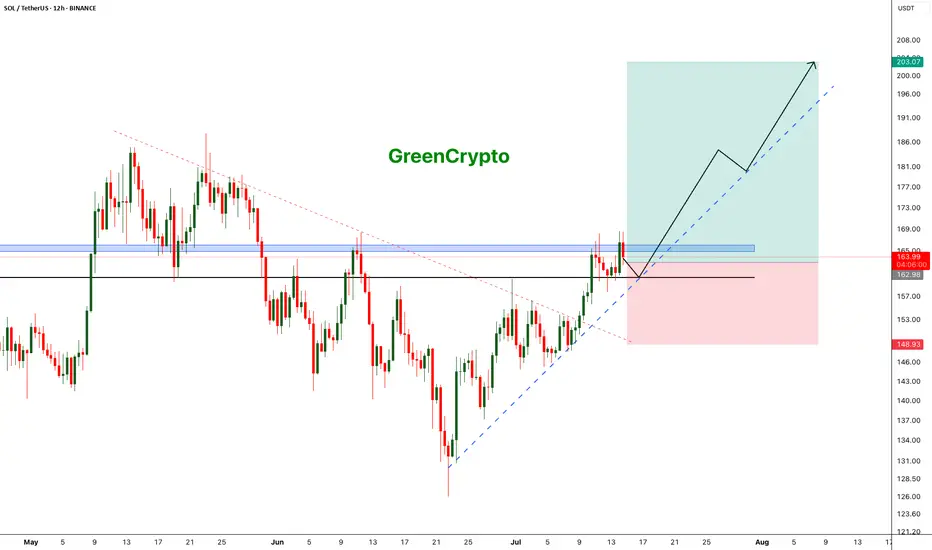
SOL - Excellent Trade Opportunity- Trade is giving us a trade with huge potential with huge risk reward ratio.
- Currently price is heading towards teh support around 160 range and this is strong support zone.
- I'm expecting price to bounce back from this zone and head towards the next target of 200 range
Entry Price: 163
StopLoss: 148
TP1: 172
TP2: 182
TP3: 200
Stay tuned for more updates.
Cheers
GreenCrypto
TradeCityPro | SOL Holds PRZ as Bulls Eye Range Breakout👋 Welcome to TradeCity Pro!
In this analysis, I want to review the SOL coin for you. This is one of the popular Layer1 projects, nicknamed the “Ethereum killer,” with a market cap of $85 billion, currently ranked 6 on CoinMarketCap.
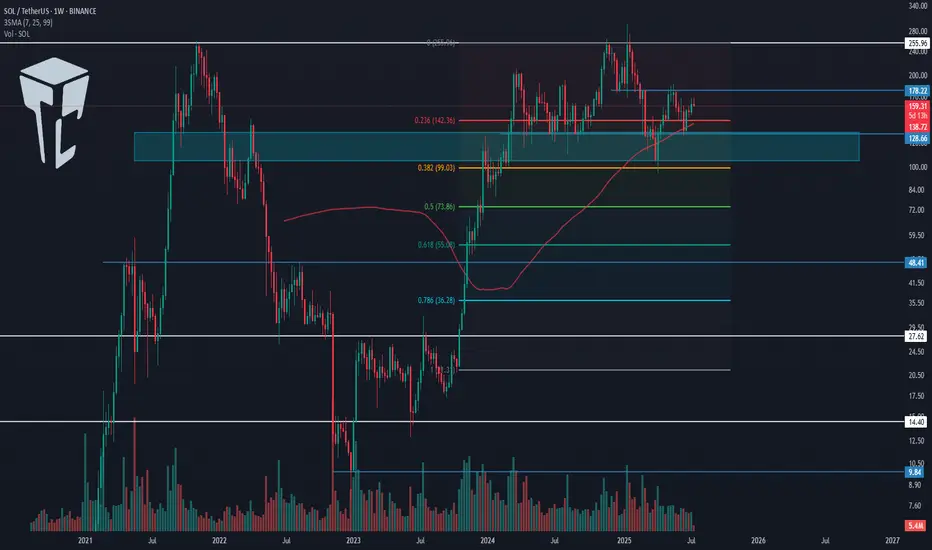
📅 Weekly timeframe
In the weekly timeframe, after the bankruptcy news related to FTX, this coin had a very sharp bearish move and even dropped to as low as 9.84, but it managed to recover afterward.
⭐ From the key top at 27.62, a very strong bullish move started, reaching up to 255.96 and retesting its previous ATH.
📊 Currently, a range box has formed between the 128.66 and 255.96 levels, where the bottom of this box is a very strong PRZ, created from the overlap of a major support zone and the area between the 0.236 and 0.382 Fibonacci levels.
🔍 Also, the price is being supported by the SMA99, which has supported the price twice so far and has prevented the box from breaking to the downside.
⚡️ If you have already bought SOL, you can set your stop-loss if the price closes below this area. A confirmed breakdown could lead to deep corrections toward lower Fibonacci levels.
🛒 For buying this coin, the first trigger is the break of 178.22, which is a bit riskier but offers a good price entry. On the other hand, if the price revisits 128.66 and gives confirmation, we can enter from there.
📈 However, the main trigger for spot entry is the breakout of the 255.96 top. Breaking this level can unlock some very ambitious targets. If that happens, I’ll definitely update the analysis and provide those targets.
📅 Daily timeframe
In this timeframe, we can see the price action in more detail. A small range box has formed between 144.11 and 164.74, and the price is currently stuck below the top of the box and reacting to it.
✨ If 164.74 breaks, we can enter a long position. The next major resistance is 183.54. A breakout above that will serve as the main confirmation for a long position targeting 255.96, which can also be used as a spot trigger.
💥 The RSI oscillator is now above the 50 zone, and if it enters the Overbuy area, it will serve as strong momentum confirmation for this position.
✅ If the price gets rejected from the top, we can also open short positions on lower timeframes. A break below 144.11 will be the main short trigger.
📝 Final Thoughts
This analysis reflects our opinions and is not financial advice.
Share your thoughts in the comments, and don’t forget to share this analysis with your friends! ❤️
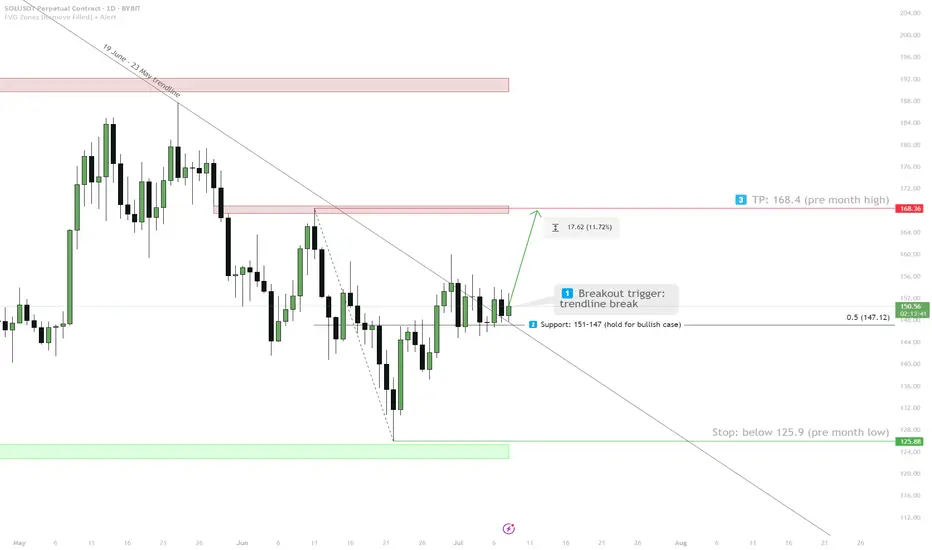
SOL — Breakout Watch & Range Play1. Watch for breakout above trendline
2. Hold support 151–147 for bullish scenario
3. Target: 168.4 (pre month high)
4. Stop: below 125.9 (pre month low)
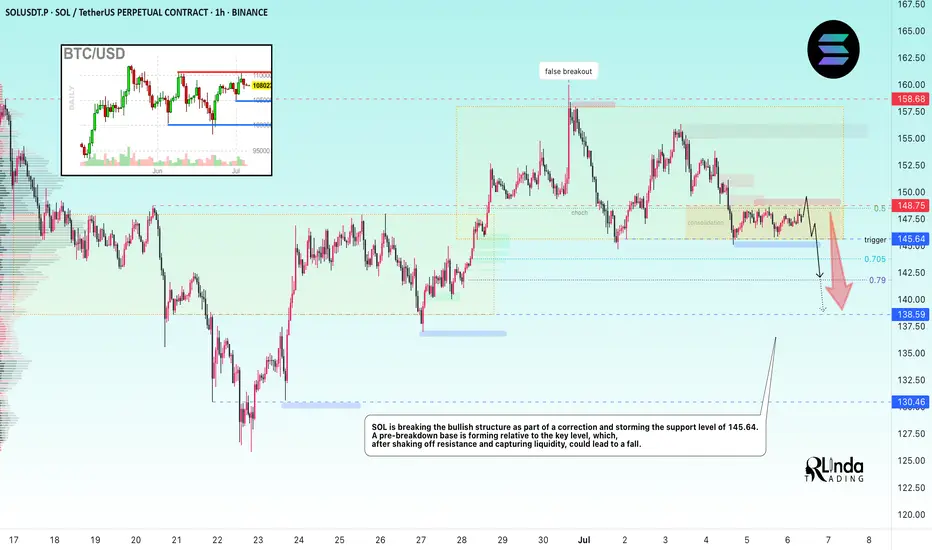
SOLANA → Pre-breakdown consolidation may lead to distributionBINANCE:SOLUSDT is declining and testing the support of the trading range as Bitcoin pauses after strong growth and enters a correction phase...
SOL looks a bit weaker than Bitcoin technically, but SOLANA has some positive fundamentals, though that might not be enough.
After forming a false breakout of key daily resistance, Bitcoin is moving into a correction phase. An update of local lows on the chart could trigger a drop across the entire cryptocurrency market.
In SOL, the focus is on the two nearest levels of 148.75 and 145.64. A breakdown of support could trigger the distribution of accumulated energy within the specified range as part of a downward momentum.
Resistance levels: 148.75, 151.2, 153.88
Support levels: 145.64, 138.59
The ideal scenario would be a false breakout of 148.75 (liquidity capture) and a retest of 145.64, followed by a break of support. Consolidation below 145.65 could trigger a drop to the zone of interest at 138.59.
Best regards, R. Linda!
Lingrid | SOLUSDT trend Continuation TradeThe price perfectly fulfilled my previous idea . BINANCE:SOLUSDT found strong support around the 155.7 level after a brief pullback and continues to respect the ascending blue trendline. The previous bullish impulse followed by a healthy consolidation suggests a classic trend continuation structure. If buyers defend the current demand zone and reclaim upward momentum, a move toward the 180 resistance zone is likely. This setup aligns with broader bullish market structure and rising channel dynamics.
📉 Key Levels
Buy trigger: confirmed bounce from 155.7 trendline support
Buy zone: 155.7–158.0 (range floor and trendline confluence)
Target: 180.0
Invalidation: breakdown below 155.0 signals structure shift
💡 Risks
Volatility around trendline retest could trigger stop hunts
Failure to reclaim momentum above 165 may lead to ranging
Sudden market-wide weakness could pressure altcoins broadly
If this idea resonates with you or you have your own opinion, traders, hit the comments. I’m excited to read your thoughts!

SOLUSDT longhi Traders,
We can see that price is currently trading below a well-defined downsloping trendline.
The trendline (blue) has been tested multiple times, confirming its validity as resistance.
Price action is showing higher lows, indicating building pressure, usually a bullish sign often seen before breakouts.
The breakout seems to be happening right now, so entering the long position is justified.
Target: 184
Invalidation: daily close below the downsloping resistance trendline
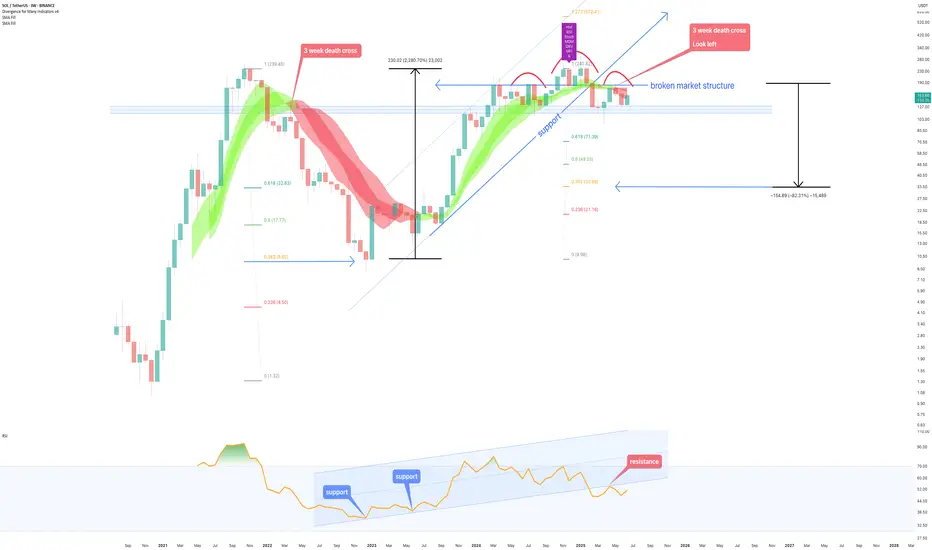
80% drop into the abyss for Solana? - July 2025** The months ahead **
Examination of the 3-week chart for SOLANA reveals several compelling technical signals that suggest a potential bearish trend reversal. This analysis highlights crucial patterns traders and investors of Solana should consider.
1. Formation of a 3-Week Death Cross:
A notable bearish signal prints on the chart: a ‘3-week death cross’. This follows a ‘2-week death cross’ that preceded a significant downward movement, just as in early 2022. The death cross, where a shorter-term moving average crosses below a longer-term one, is a strong indicator of a shift towards a bearish trend, especially on higher timeframes like this 3-week chart.
2. Broken Market Structure:
The chart clearly indicates a “broken market structure.” This typically occurs when the price fails to create higher highs and higher lows during an uptrend, or in this case, breaks below a significant support level that had previously held. It is absolutely possible price action backtests past support for a resistance confirmation, however on looking left, such a test never occurred on the last death cross.
3. Resistance from Previous Peaks (Head and Shoulders Pattern):
Price action leading up to the recent highs resembles a potential ‘Head and Shoulders’ pattern. The three distinct peaks, with the middle peak being the highest, suggest a classic reversal pattern. A subsequent break below the ‘neckline’ (implied support level below the peaks) would confirm the bearish outlook.
4. RSI Oscillator (bottom of chart) resistance
The lower panel of the chart displays an RSI oscillator indicator, which shows a clear pattern of "resistance." following a period of support since 2023. The RSI has clearly confirmed resistance from almost 3 years of support.
5. Solana vs Bitcoin
All the bearish observations made on the SOL-USD trading pair can be observed on the same 3 week time frame for the SOLANA - BITCOIN trading pair:
6. Potential for Significant Downside Target:
Based on the measured move from the previous death cross and breakdown and Fibonacci extension, the chart illustrates a potential downside target of approximately -70% from current levels toward the $30-40 area. While this is a projected target and not guaranteed, the historical precedent following similar bearish signals provides a context for the potential severity of the downturn if the bearish momentum continues.
Conclusion:
Considering the confluence of a 3-week death cross, broken market structure, resistance from previous peaks (suggesting a potential Head and Shoulders pattern), and the confirmation of RSI resistance, the outlook for SOLANA on the 3-week timeframe appears distinctly bearish.
Is it possible price action continues upwards after a 3200% rally? Sure.
Is it probable? No
Ww
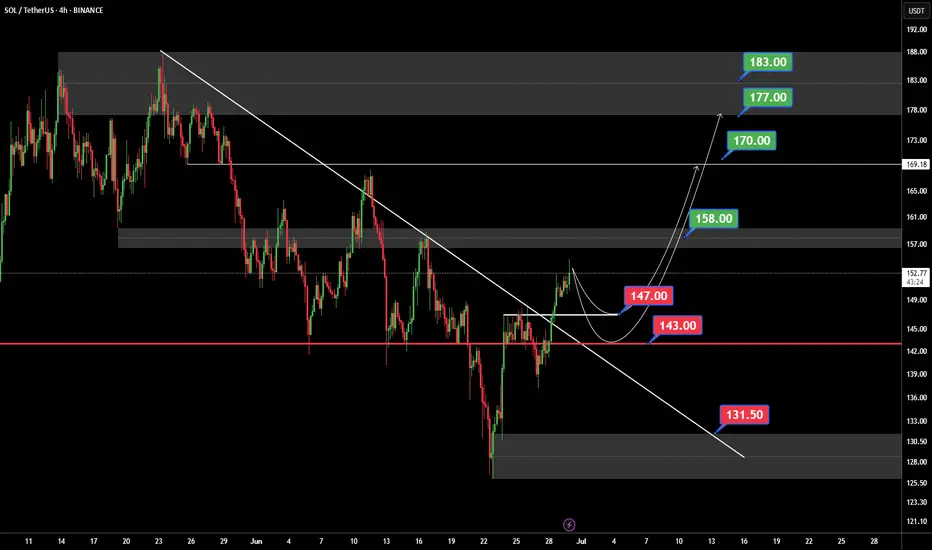
SOLUSDTThis chart BINANCE:SOLUSDT say to me that change of character. But we need to best confirmations for buy for example: pollback to 143 - 147 $ and higher high next pollback to level.
Support: 147 - 143 - 131.50
Resistance: 158 - 170 - 177 - 183
⚠️Please Control Risk Management in trades.
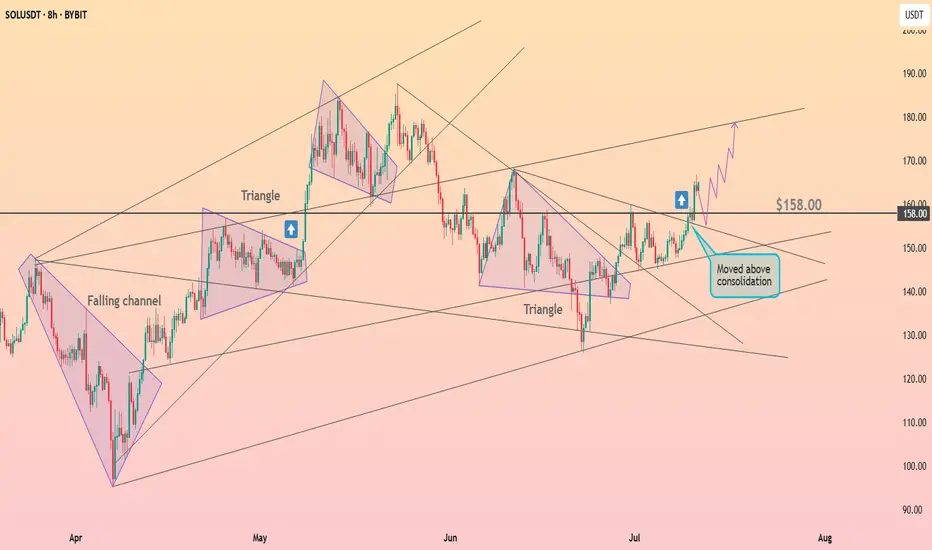
HolderStat┆SOLUSD above the $158 levelBYBIT:SOLUSDT broke through the $158 consolidation resistance following a strong triangle breakout. This confirmation shift puts the $180 resistance level within reach. The market structure continues to print higher lows, suggesting an ongoing bullish trend.
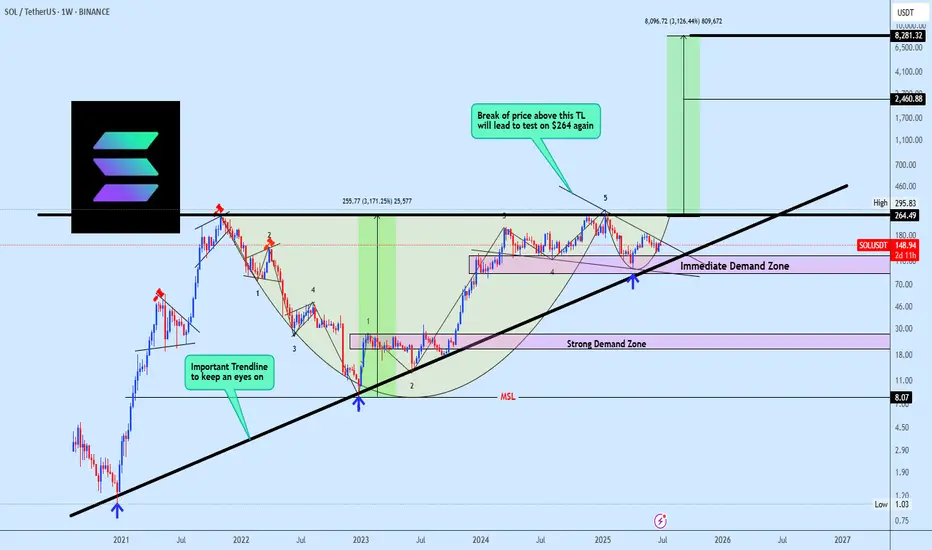
SOLUSDT Holding Long Term Trendline SupportSOLUSDT continues to show strong bullish structure, with price consistently holding above a multi-year ascending trendline a key structural element that has defined its uptrend. This dynamic support has anchored price action within a broader ascending formation, reflecting steady long-term accumulation.
Additionally, the chart reveals a well defined Cup and Handle formation, further reinforcing the bullish outlook. As long as price respects the immediate demand zone, this area remains a prime region for re-accumulation, with expectations for it to hold as a firm support level.
The projected target for this setup is clearly illustrated on the chart, aligning with the broader bullish continuation narrative.
Share your view, do you see SOLUSDT pushing higher from here, or is a deeper retest likely before the breakout?
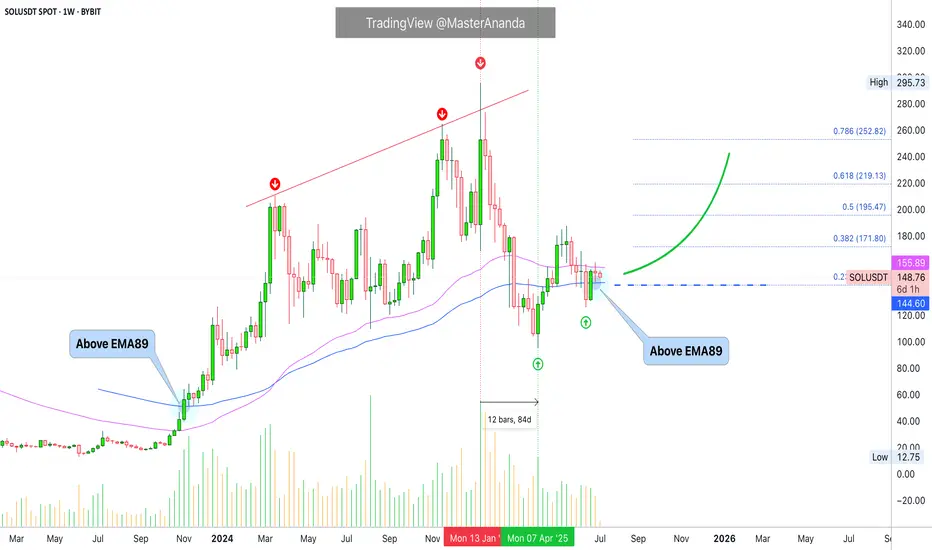
Solana Moving Averages: Patience is KeySolana is trading above EMA89 while at the same time trading below EMA55, we have a mixed situation. When in doubt, stay out. Anything is possible on this chart.
There was a major correction already that lasted 84 days. Solana lost more than 65% in this correction. A -67% drop. This correction removed all gains from 2024 sending prices back below $100. This is to say that Solana already went through a full and major flush.
The market could very easily continue lower and produce a lower low compared to 7-April, a major crash leading to August and I can easily see this scenario developing. Will it develop? Is it really necessary?
I can also see a slow but sure change of course. A few days red at the start of the week, as it is usual and then Boom!, the market turns green. And it grows day after day after day. It is already happening, patience is key. Better focus on the numbers.
» If Solana trades weekly above $142, we are bullish, strongly bullish and can expect additional growth.
» If Solana moves and closes weekly below $142, market conditions still remain bullish but we can approach this pair with caution.
» On a broader perspective, any trading above $95, the 7-April low, is bullish long-term. As long as this level holds, we can expect higher prices. The last low sits at $126...
It doesn't matter how you slice it, the price is good and is more likely than not to continue to increase. Patience is key.
Namaste.
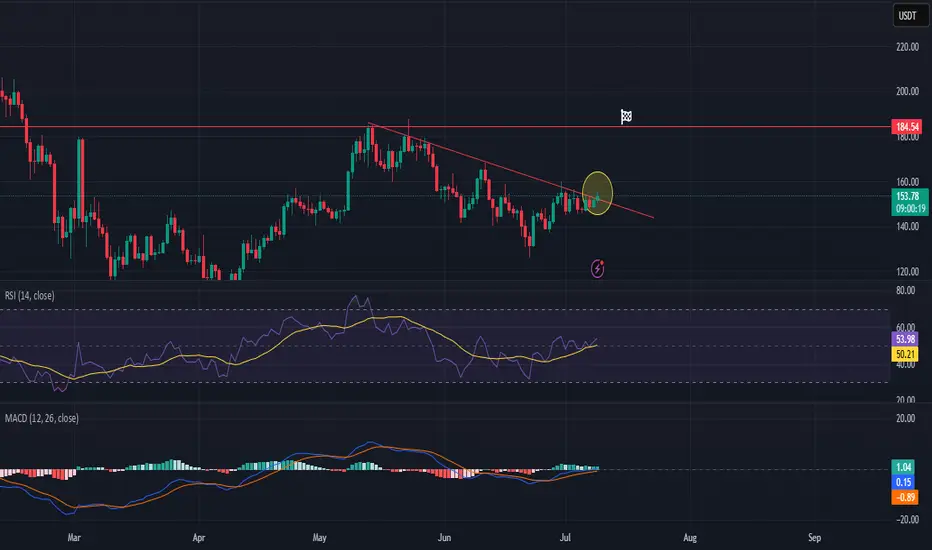
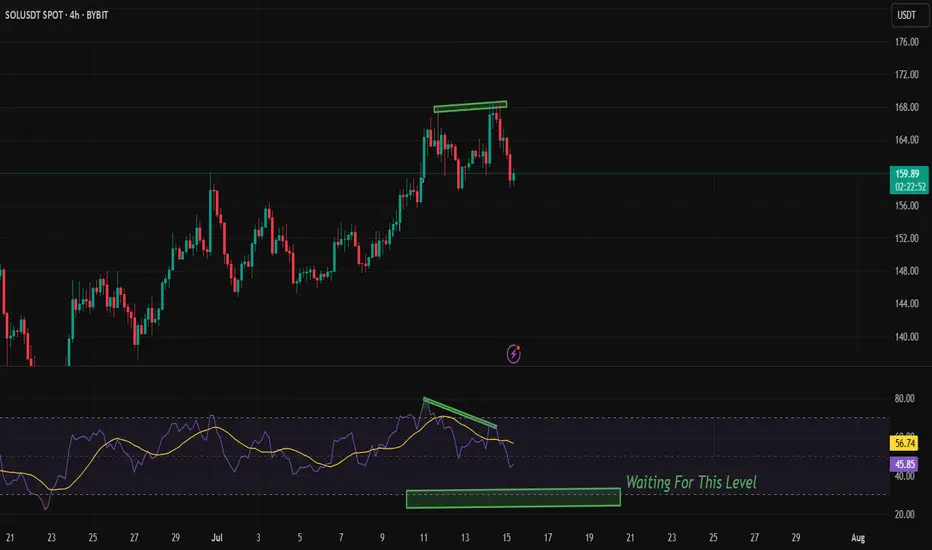
Bearish RSI Divergence on SOLUSDT (4H) – Patience Over FOMO!
🚨 Observing a clear Bearish RSI Divergence on the 4H chart for $BYBIT:SOLUSDT.
While the price made a higher high, the RSI showed a lower high, indicating weakening bullish momentum.
🟣 RSI is now trending down and currently around 46.
💡 I'm waiting for RSI to approach the 30 level (oversold zone) before considering a long entry.
🎯 No rush to buy — I prefer to wait for confirmation and a better risk-reward zone.
📅 Timeframe: 4H
📍 Plan: Waiting for RSI near 30
✅ Staying disciplined and avoiding emotional entries.
🧠 Let the setup come to you. Don’t chase the market.
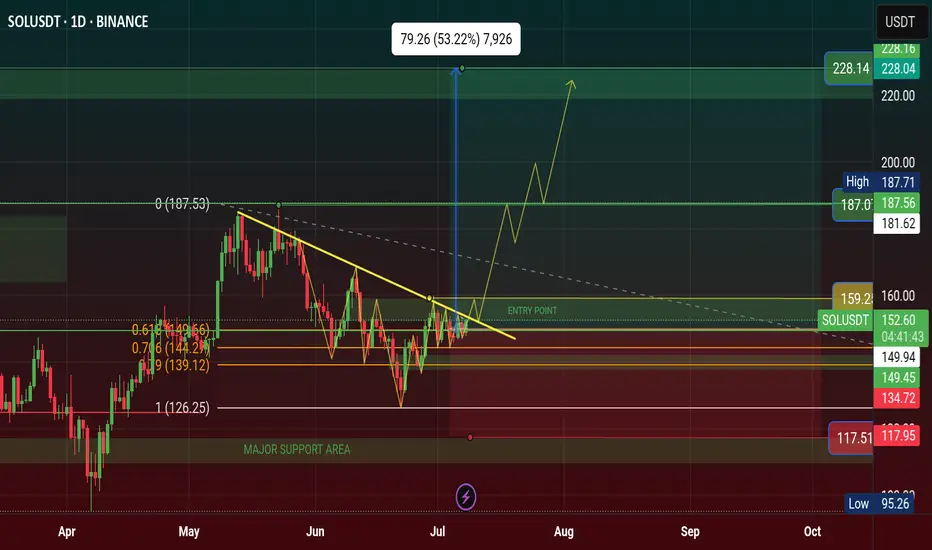
$SOL Price Will Hit $228 Q3, Inverse Head and Shoulder Pattern✨ CRYPTOCAP:SOL Price Will Hit $228 in Q3 of 2025 | Solana Chart Showing Inverse Head and Shoulder Pattern. It's a Bullish Reversal Pattern.
‣ Solana price is hovering below key resistance; a breakout above $159 and it's going to $228.
ETF Buzz Grows, but Price Action Still Caught in Limbo Here is why this could be the catalyst that sends price to all time highs Do THIS before that happens.
‣ Solana ETF Buzz Grows, but Price Action Still Caught in Limbo
🔸BlockNews The SEC has asked SOL ETF applicants to revise and refile submissions by end of July, fueling speculation of an ETF approval before October. Solana’s daily active addresses just hit a record 15.39 million, pointing to rising demand and user engagement on the network.
#Write2Earn #NFPWatch #BinanceSquareFamily #TrumpTariffs #SUBROOFFICIAL
Disclaimer: This article is for informational purposes only and does not constitute financial advice. Always conduct your own research before making any investment decisions. Digital asset prices are subject to high market risk and price volatility.
Weekly trading plan for SolanaLast week, BINANCE:SOLUSDT price followed our bullish scenario after breaking out from the ABCDE triangle. We’ve now hit all projected targets, with current trading around $165. However, the 4-hour RSI is showing divergence, suggesting potential near-term correction or consolidation. Full analysis in the video idea
Trade safe and stay adaptive
