Solana SOL price analysis📞 Rumor has it that as soon as the global geopolitics reach a “temporary lull”, the following ETFs will be launched
Solana ETF is the most likely to be the next one (but there are at least 2 coins more on the list, which we will talk about in the coming days)
🪙 So, are you ready to buy CRYPTOCAP:SOL in your investment portfolio? For example, in the range of $117-123
🤖 Maybe we need to launch a long trading bot OKX:SOLUSDT so that it can buy in micro portions on the current possible price correction to get a “tasty price” as a result
◆ Would you like to join such a trading bot and copy them?
◆ And then compare the results with all “ETF candidates”
_____________________
Did you like our analysis? Leave a comment, like, and follow to get more
SOLUSDT.P trade ideas
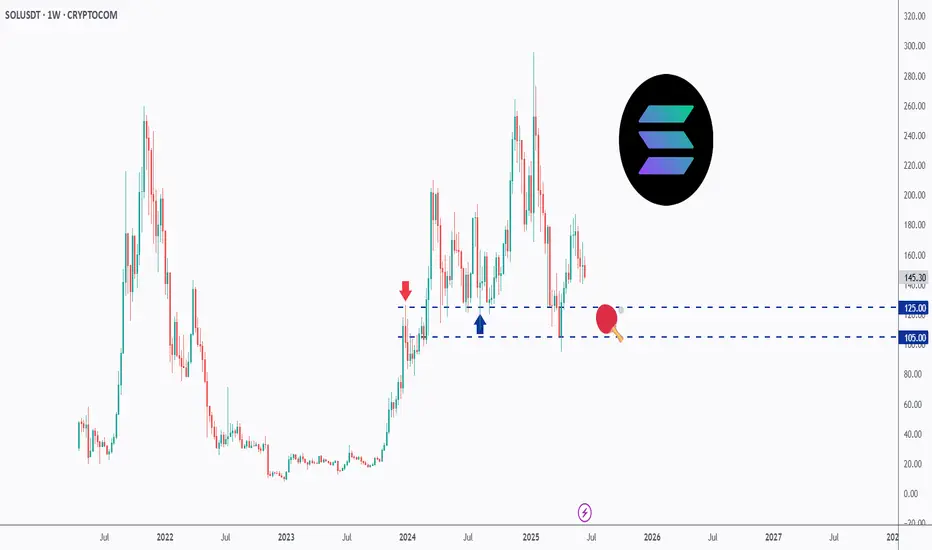
SOL - Playing Ping Pong!Hello TradingView Family / Fellow Traders. This is Richard, also known as theSignalyst.
📈SOL has been trading within a range between $100 and $200 round number.
And it is currently retesting the lower bound of the range which has been acting as a magnet lately.
As SOL approaches the $105 - $125 support zone, and as long as the $105 support holds, we will be looking for longs targeting the $200 round number.
📚 Always follow your trading plan regarding entry, risk management, and trade management.
Good luck!
All Strategies Are Good; If Managed Properly!
~Rich
#SOLUSDT LONG-TERM SETUPMEXC:SOLUSDT.P showing again an good price zone for entry i made this entry 2 days ago
still at the same point, it has a potential to perform to the target
you can take some entry at this point
meanwhile as you all know there is tension b/t #irna_israel so any thing can be happen so if you are planning to take position use low margin and apply some risk to reward ratio into your trade
#Hamm_crypto

SOL/USDT – The “Eye” of the Storm: Big Break Incoming?🧭 Summary:
Solana is coiling inside a symmetrical triangle after rejecting from its 2025 high. Price is trapped between $ 141–$ 167 with squeezing volatility, falling volume, and visible double top signs. The setup screams: “get ready for a breakout — or a breakdown.”
🔥 Key Confluences:
Eye-shaped compression pattern on 4H & daily
Support at $ 141 (trendline, demand zone)
Resistance at $1 55–162 (EMA cluster + structure)
Weekly chart still above key Fib (~$ 142), but weakening
📈 Trade Plan:
Bullish Scenario:
Break and close above $162–164 → target $171 then $187+.
Stop: below $ 149
Bearish Scenario:
Lose $141 support → target $120–100 zone.
Stop: above $155
🧠 Context:
Solana network is 🔥 — 1.2K TPS, 25M daily txns, $10B TVL.
Altcoin sentiment improving as BTC dominance dips.
But macro still cautious (Fed pause = volatility trap).
🎯 Final Word:
SOL is winding tighter than ever. A powerful move is coming.
📣 Breakout or breakdown — what’s your call? Drop your analysis below!

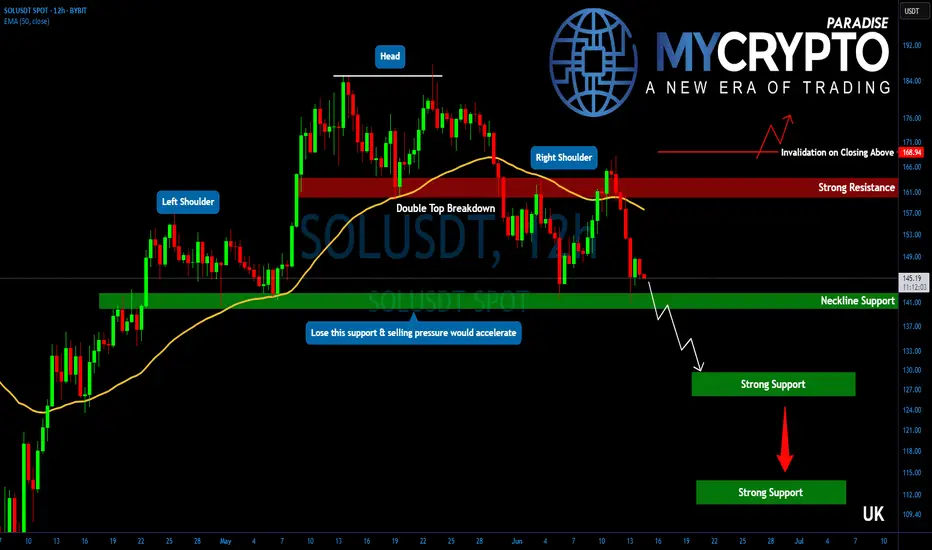
Solana Breakdown Incoming? These Are Key Levels To WatchYello, Paradisers! Are you ready for the next major flush? After failing to gain momentum since the May double top breakdown, #SOL is now showing even more bearish signs, and the market might be about to punish late bulls one more time.
💎Following the confirmed double top in May, SOL has struggled to reclaim any upside momentum. Now, on the 12-hour chart, a classic head and shoulders formation is emerging, a pattern that often precedes larger trend reversals when the neckline breaks.
💎#SOLUSDT is hanging onto critical support between $142 and $140. This zone is the neckline, and it’s the last stand for bulls. If bears break it, we get a clear breakdown confirmation, with a clean path down toward $130–$127, which marks the first major demand area.
💎That initial support likely won’t hold for long. If pressure continues, SOL is expected to drop further toward the $115–$110 region. This is not just a technical support, it’s also the target area of the H&S formation, making it a magnet zone for price.
💎Adding to the bearish developments, a death cross has now been confirmed on the 12-hour chart. The EMA-50 has crossed below the EMA-200, reinforcing short-term downside pressure. Even if a relief bounce occurs, the $155 region, where the EMA-50 sits, will likely act as fresh resistance and attract renewed selling.
Paradisers, strive for consistency, not quick profits. Treat the market as a businessman, not as a gambler.
MyCryptoParadise
iFeel the success🌴
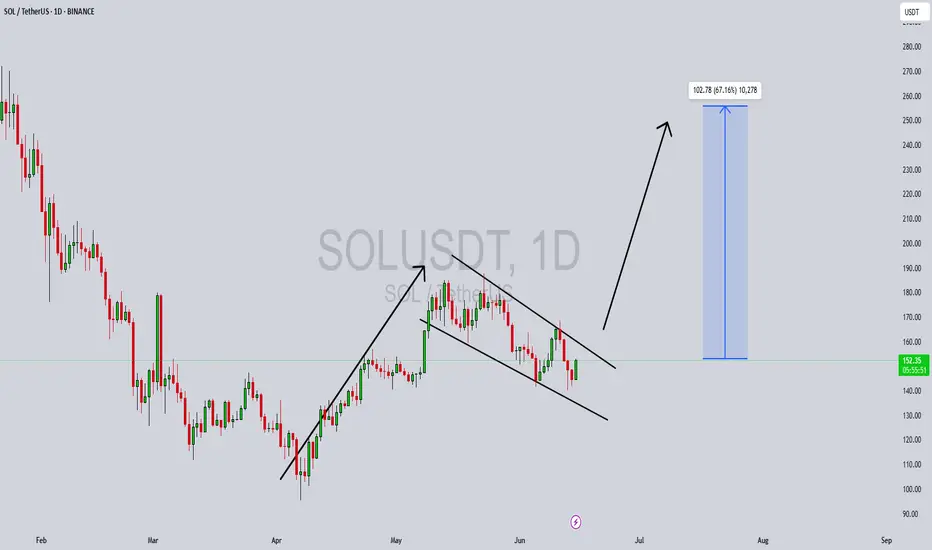
SOLUSDT Forming Bullish FlagSOLUSDT is currently forming a classic bullish flag pattern on the chart, which is often seen as a continuation pattern indicating the potential for a strong breakout to the upside. The price has consolidated within a tight range following a significant upward move, creating a flag-shaped formation that typically precedes the next wave higher. This structure is being supported by solid volume behavior, which is an essential confirmation for bullish breakouts. Based on historical performance and technical projections, a 50% to 60% gain could be on the horizon if this pattern resolves upward.
Solana (SOL) has remained one of the strongest-performing layer-1 blockchain projects in the market, and current investor sentiment is highly favorable. With recent developments in its ecosystem and increased institutional interest, SOL continues to attract substantial inflows. The bullish flag pattern aligns perfectly with the broader market optimism and technical indicators such as RSI and MACD that are showing early signs of renewed momentum.
Traders should watch closely for a breakout above the flag's resistance line, as this could trigger a new wave of buying pressure. Key levels to monitor include the breakout point and potential price targets around the previous highs and Fibonacci extensions. The market structure remains bullish, and if confirmed by volume and market momentum, SOLUSDT may offer one of the most attractive risk-reward setups in the current crypto landscape.
In summary, SOLUSDT is technically poised for another rally, supported by a bullish flag and growing interest from both retail and institutional investors. With a favorable risk profile and strong fundamentals, this is a setup that many traders will be watching in the coming days.
✅ Show your support by hitting the like button and
✅ Leaving a comment below! (What is You opinion about this Coin)
Your feedback and engagement keep me inspired to share more insightful market analysis with you!
Solana bottom and mid range pullback before new highs?SPX likely to go for new highs, BTC and crypto will follow, Solana is ready to outperform

SOL/USDT 1H Chart Analysis – Bullish Reversal Targeting Resistan🚀 SOL/USDT 1H Chart Analysis – Bullish Reversal Targeting Resistance Zone 🎯
📊 Pair: SOL/USDT
🕐 Timeframe: 1H
📈 Platform: Binance
🔍 Technical Overview:
🔵 Support Zone (145.00 – 147.50 USDT)
Price has bounced multiple times from this strong demand zone marked in light blue.
Recent price action shows buyers defending this level aggressively — potential accumulation area. ✅
🔴 Resistance Zone (159.50 – 162.00 USDT)
Marked in red, this zone has historically rejected price twice (confirmed by red & yellow arrows).
Currently, the market is expected to retest this supply area once again. ⚠️
📈 Bullish Pathway:
Current structure suggests a reversal from support, aiming for:
TP1: $150.46
TP2: $154.31
TP3 / Final Target: $160.89 (within resistance)
🔄 Trend Structure:
Price is forming higher lows, hinting at early reversal stages.
Break above $150.46 would confirm bullish momentum. 🟢
🧠 Conclusion:
SOL/USDT is setting up for a bullish reversal from a strong support zone, with targets aligned toward previous resistance. Traders should monitor the reaction at $150.46 and $154.31 — a clean break may propel price to $160.89.
📌 Watch for:
Confirmation candle at support zone
Break and retest patterns on intraday resistance levels
📉 Support: 145.00 – 147.50
📈 Resistance: 159.50 – 162.00
🎯 Bullish Targets: 150.46 → 154.31 → 160.89
🔔 Stay updated, manage risk, and trade wisely! 💹📈

an eye for an eye! a SOUL for a SOLI dont know i like that SOL and what i wish it moves in the way, just wait for a sweep below to move, keep targets of 160 on the sweep!

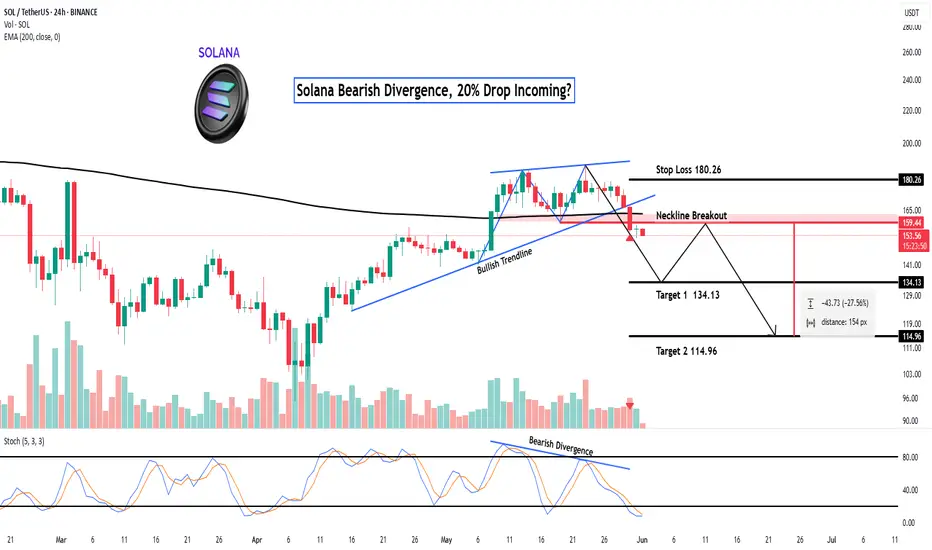
Solana Bearish Divergence, 20% Drop Incoming?Hey Realistic Traders!
Bearish Signal Flashing on BINANCE:SOLUSDT , What Signals Are Showing?
Let’s Break It Down..
On the daily timeframe, Solana has formed a double top pattern, followed by a neckline breakout, which is a classic sign of a potential shift from a bullish to a bearish trend.
This breakout was confirmed by a break of the bullish trendline, accompanied by rising selling volume, which reinforces the bearish momentum. Adding to this, a bearish divergence has appeared on the stochastic oscillator. Bearish divergence occurs when price makes higher highs while the oscillator forms lower highs, signaling weakening buying pressure and increasing the likelihood of a reversal.
Given these technical signals, the price is likely to continue moving lower toward the first target at 134.13, with a possible extension to the second target at 114.96.
This bearish outlook remains valid as long as the price stays below the key stop-loss level at 180.26.
Support the channel by engaging with the content, using the rocket button, and sharing your opinions in the comments below.
Disclaimer: "Please note that this analysis is solely for educational purposes and should not be considered a recommendation to take a long or short position on Solana.
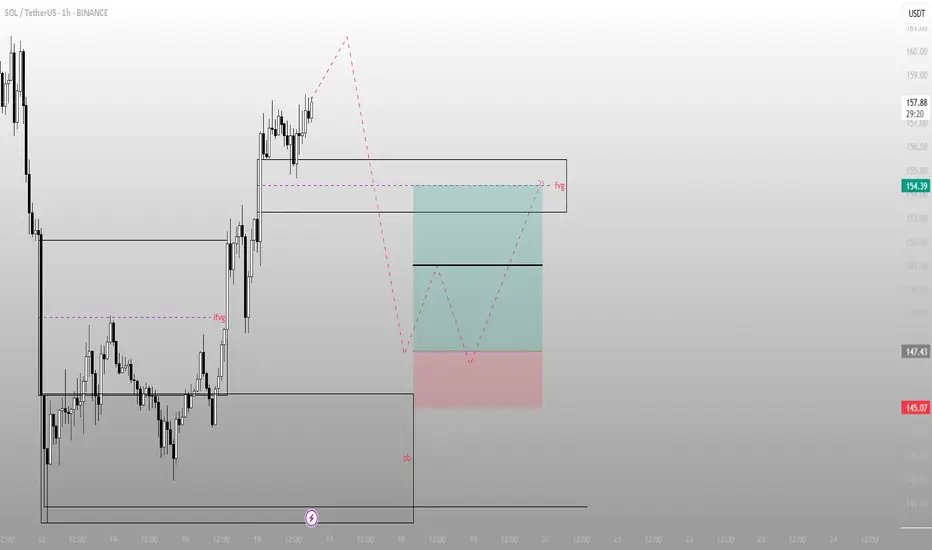
Impulse without purpose? Not in Smart Money termsSOL didn’t just break structure — it filled inefficiency and positioned above. Now price is sitting in the upper FVG, where decisions are made — not guesses.
What just happened:
Price rallied from the OB below and left an IFVG in its wake
Current price is hovering at the edge of a higher FVG, right where liquidity rests from trapped shorts
The move is complete — now it’s about what price does next in this zone of intent
From here, two paths:
Sweep into FVG, reject, and rotate back down toward the 154–147.4 range
React bullishly from mid-FVG, reclaim structure → break to new internal high and keep running
The OB down at 145 is still valid if price unwinds — that’s where Smart Money bids.
Execution view:
Rejection from 158–159 = short bias down to 147–145
Clean invalidation above FVG high
If price consolidates at 154 and reclaims → setup flips bullish
The setup isn’t about what price did — it’s about what it’s preparing for.
You want more trades like this — precision zones, mapped logic — check the profile description.
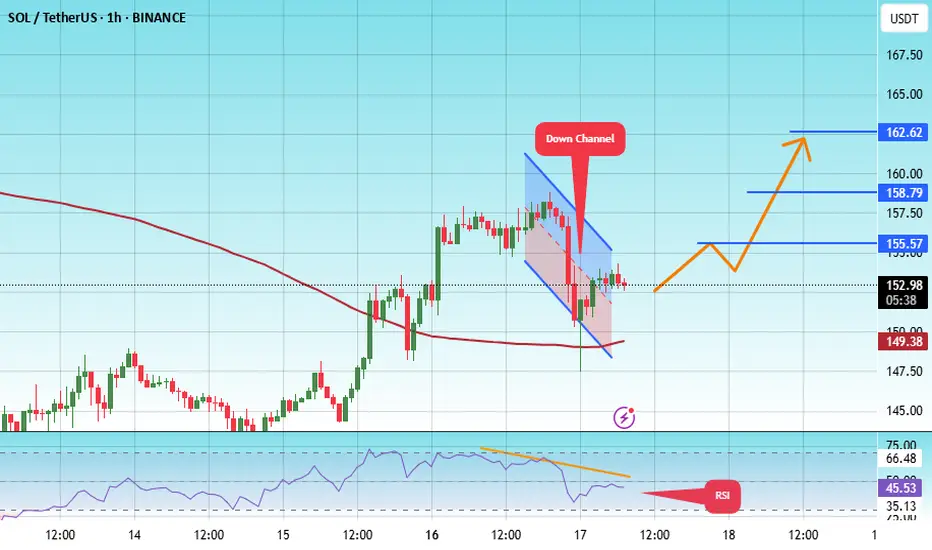
#SOL/USDT#SOL
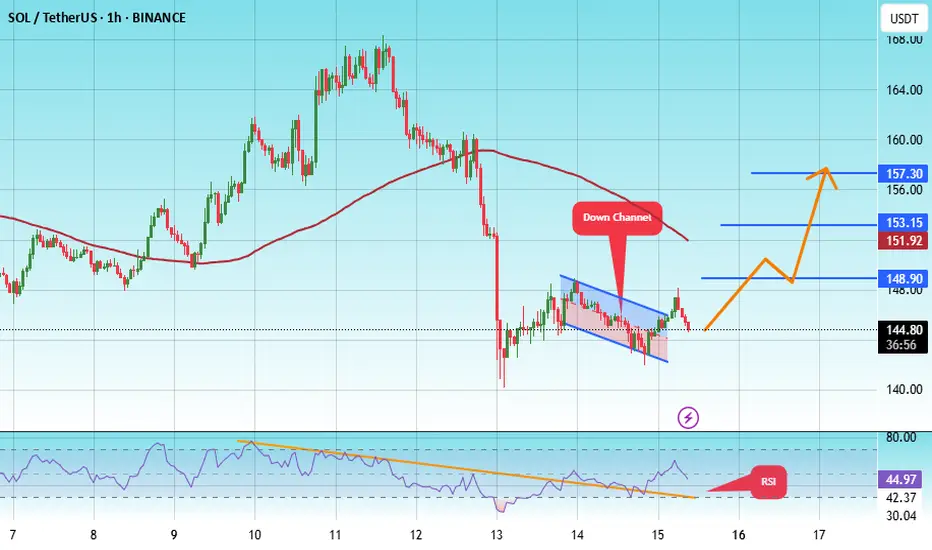
The price is moving within a descending channel on the 1-hour frame, adhering well to it, and is heading for a strong breakout and retest.
We are experiencing a rebound from the lower boundary of the descending channel. This support is at 149.
We are experiencing a downtrend on the RSI indicator, which is about to break and retest, supporting the upward trend.
We are heading for stability above the 100 moving average.
Entry price: 153
First target: 155
Second target: 159
Third target: 162
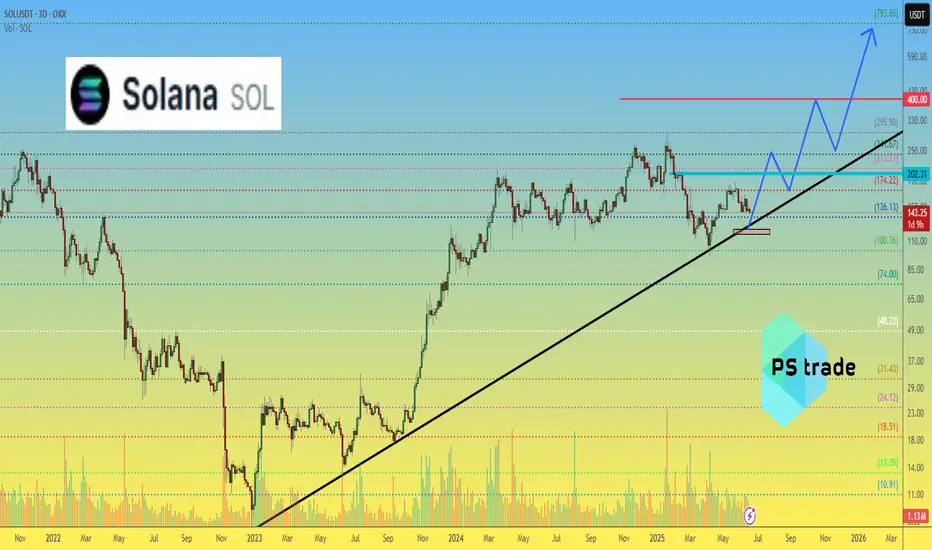
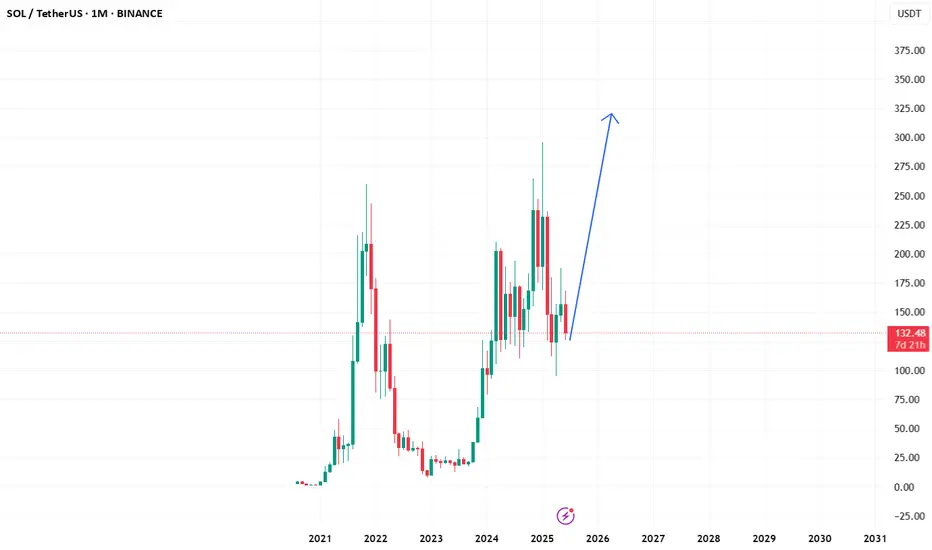
SOLANA SOL to 3800$ nextSolana is in mid range, 61.8% retracement bottom, similar to TSLA at 19 Aug 19,
since Sol is the most used cypto (90% of blockchain usage) i expect a massive bullrun.
Sol will outperform bitcoin

SOL - Reaching 200??? Can it be that accurate?? LOLSooooo can you see how accurate it is the way i drew and the way it is going ? Its going to go the way I said, observe and take your stancesss!


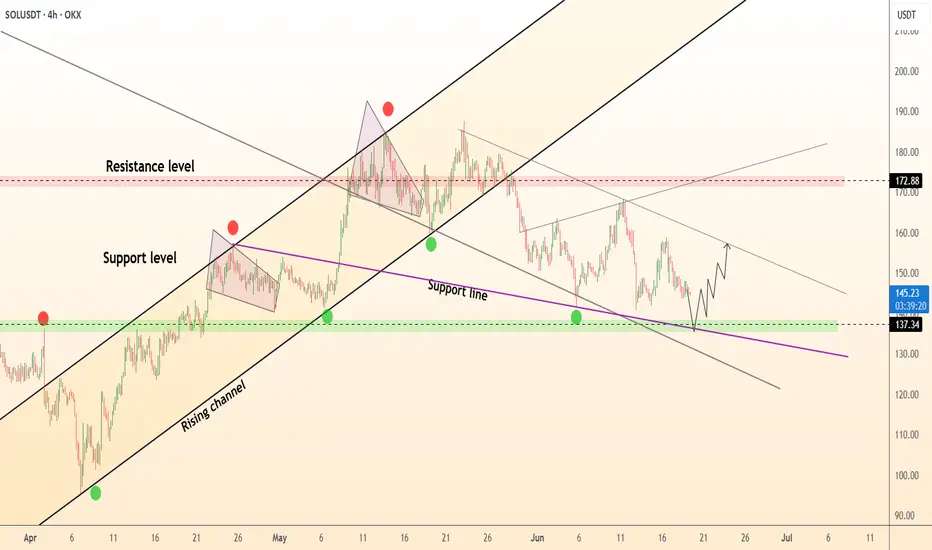
DeGRAM | SOLUSD channel floor launch toward 170+Solana continues to respect the broad rising channel that has guided price since early April. Recent corrective action tagged the channel median and then the intersecting 137-140 horizontal support, forming a classic confluence floor. The reaction: a sharp bullish rejection that restored price above the magenta internal trendline, indicating buyers remain in firm control. The corrective structure itself resembles a descending wedge losing bearish momentum, while RSI prints a positive reversal at 40 – conditions that often precede explosive upside resolution. A decisive close over 150 triggers an upside breakout aiming first at 160 (wedge objective) and subsequently at the 172-175 resistance block where prior distribution occurred. Should momentum spill over, the upper channel trajectory extrapolates 185-190 in coming weeks. Bullish bias is intact while candles close above 137; deeper dips into that zone likely represent opportunity rather than weakness.
Solana mid range pullback before shoting to new highs320$ seems a reasonable target for SOL, if not much higher
#SOL/USDT#SOL
The price is moving within a descending channel on the 1-hour frame, adhering well to it, and is heading for a strong breakout and retest.
We are experiencing a rebound from the lower boundary of the descending channel. This support is at 142.
We are experiencing a downtrend on the RSI indicator, which is about to break and retest, supporting the upward trend.
We are heading for stability above the 100 moving average.
Entry price: 144
First target: 149
Second target: 153
Third target: 157
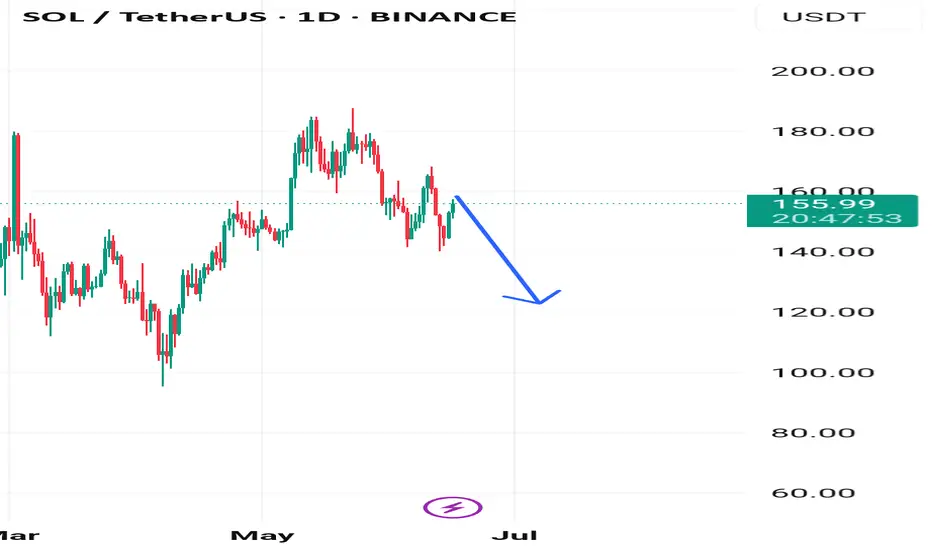
Solana to crash with btc 97k pullback?Solana could have been bottomed, but since btc likely to crash next. Then Solana 130$ is likely next
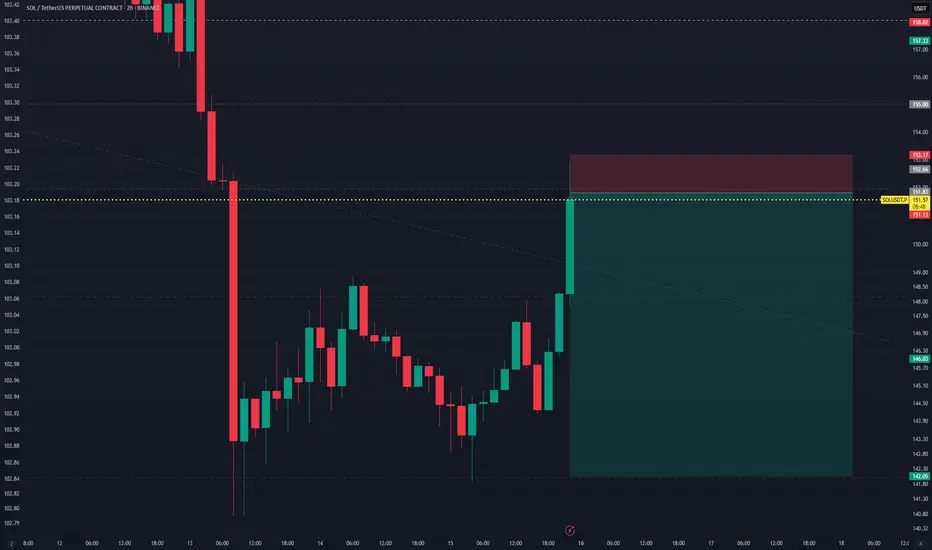
SOLUSDT Perpetual–High R:R Short Setup from Key Resistance ZoneSOLUSDT printed a strong bullish impulse candle, reaching a key resistance zone around $151.76, where a short position has been opened, anticipating a potential reversal.
Trade Details:
Position: Short
Entry: $151.76
Stop Loss: $153.17 (0.88%)
Take Profit: $142.05 (6.44%)
Risk/Reward Ratio: 7.3, highly favorable for intraday or swing shorts
Setup Rationale:
Price tapped into a potential supply zone / previous resistance
Sharp move up without pullback may indicate overextension
Ideal for traders using a fade-the-pump or reversal-based strategy
This setup relies on a quick rejection from resistance, with tight risk control and a deep profit target — a clean and efficient play for high-risk:reward traders.
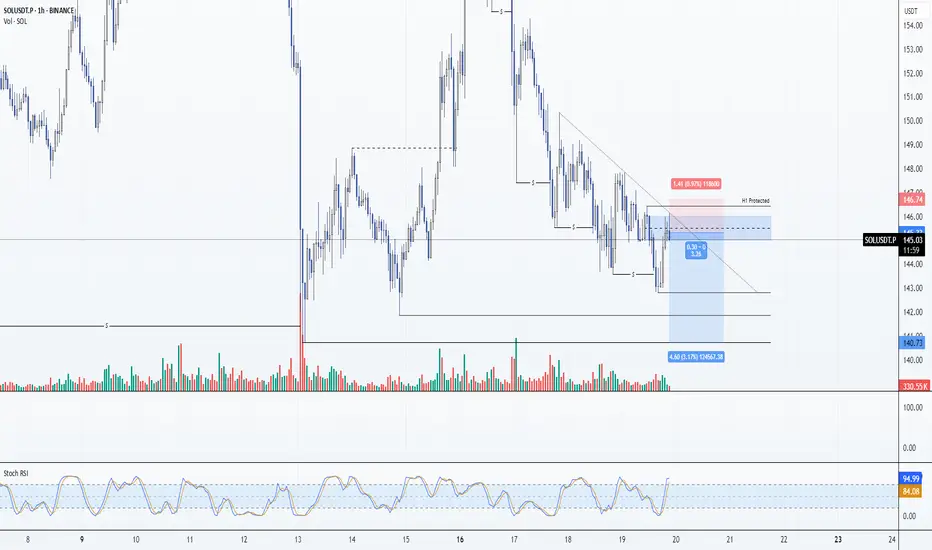
SOL: Short 19/06/25Trade Direction:
- SOL Short
Risk Management:
- 1% Risk
Reason for Entry:
- H1 Supply
- Multi timeframe overbought
- 0.886 Retrace - M15 Leg
- HTF Bearish
- Consistent Lower highs, Lower Lows being respected
- HTF DOL lower ~ $140
Additional Notes:
- While technically sound, runs the risk of being stopped quickly based on any news event, market is heavily news driven right now and that means this could be invalidated quickly.
- Re-entry
- Until price gives me a reason to I have to assume the highest probability direction is down.
- For a change in bias, my system requires;
a) HTF DOL being swept (Like $140)
b) H1 MSB for bulls.
- Accepted that this is a fairly risky trade and one IMO will get stopped. But everything aligns with my system so entry must be taken. My only active trade with risk with an additional FET long running Risk free.
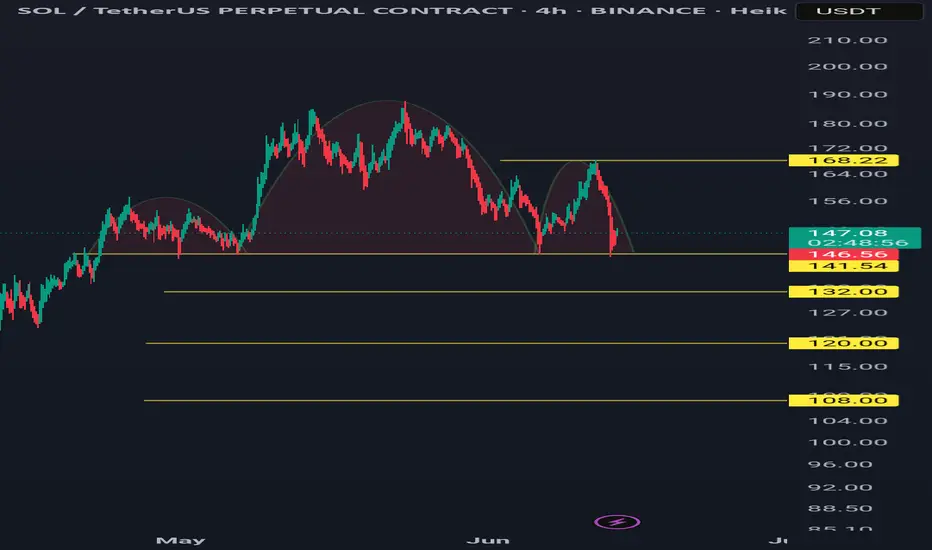
Solusdt 4hr tf bearishA bearish head and shoulders pattern is forming.
If it closes below 141.54 on the 4-hour timeframe, the pattern may be activated.
Targets are 132, 120, and 108.
Invalidation occurs if the high of the right shoulder (168.22) is broken.
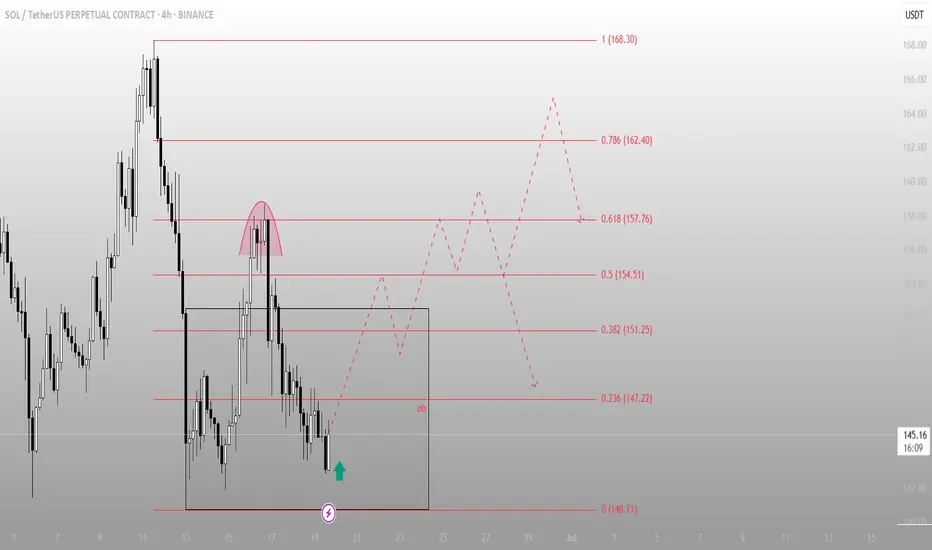
SOL – Sweep & Spring Play at Local DemandWe’ve got a clean rounded top → breakdown → demand sweep setup.
Current price action suggests a potential reversal is brewing.
🔍 What’s happening on this chart?
Rounded top marks a local distribution — aggressive short entries
Price broke lower, swept the demand zone (gray box), and now shows rejection wick + bullish reaction
Fibonacci levels mapped out the structure
0.5 = 154.51
0.618 = 157.76 = key resistance liquidity zone
🎯 Trade idea:
Entry: inside demand zone (OB marked on chart)
Target 1: 151.25
Target 2: 157.76 (0.618)
Full fill: 162.40 – 168.30 (complete inefficiency sweep)
🧠 Mindset:
This setup is classic spring + reclaim. If price consolidates and flips 147.2, upside becomes favorable.
If you like clean trade setups with logic and clear invalidation, check the account bio for more updates and live breakdowns.