SOL/USDT Technical Breakdown: $125 Support in Sight?Key Observations:
1. Bearish Momentum Intensifying
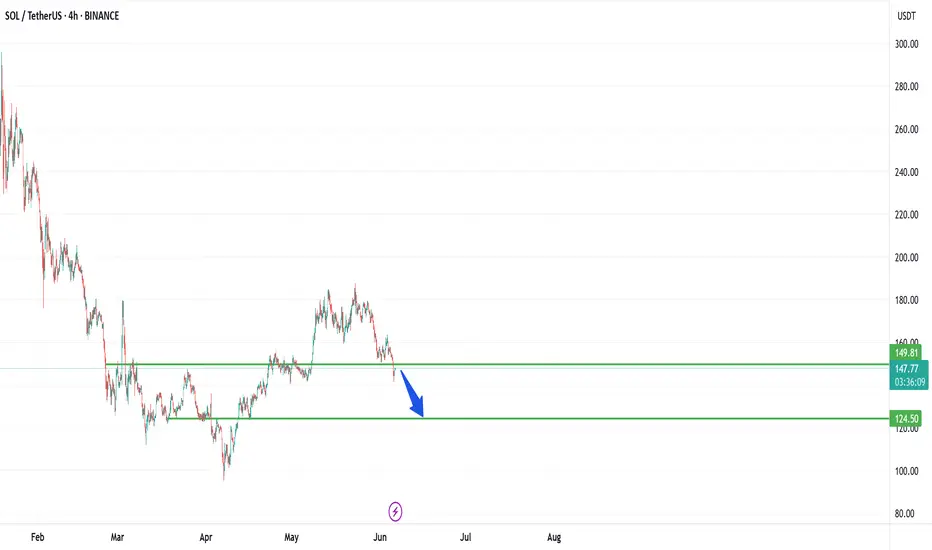
SOL has been in a steady downtrend since its recent local high near $190, forming lower highs and lower lows on the 4H timeframe.
The current price sits around $147.63, having broken below a minor support level near $149.81.
2. Key Support Level: $124.50
The green horizontal line at $124.50 marks a critical demand zone, which acted as a launchpad during the April rally.
A clear blue arrow on the chart suggests a potential bearish continuation into that zone.
3. Structure and Price Action
The market is forming a descending channel, respecting key horizontal levels.
If the current downward pressure persists, a retest of the $124.50–$125 area looks likely.
Levels to Watch
Immediate Resistance: $149.80 – previous support now flipped
Support Zone: $124.50 – demand-based with prior reaction history
Trend: Bearish in short-to-mid term
Trade Setup Idea (Not Financial Advice)
Entry: $147–$149
Target: $125
Stop Loss: $155 (above minor structure)
Note to Traders
This setup leverages classic support-flip mechanics and momentum-based sell-offs. Watch for confirmation via volume spikes or sharp candle closes. As always, adjust sizing based on your risk tolerance.
SOLUSDT.P trade ideas
Long-Term Technical Outlook: Critical Decision Point Approaching
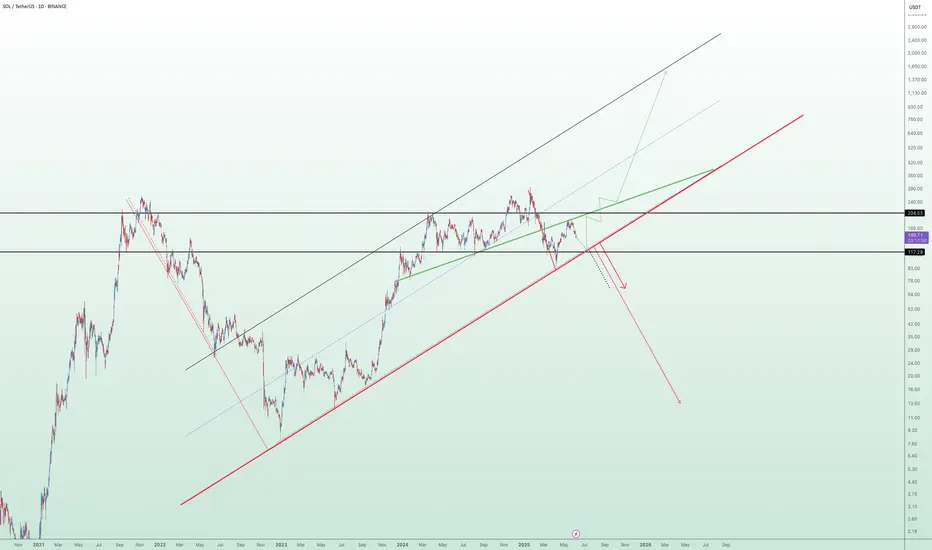
The chart illustrates a long-term technical structure where the price has been following an ascending channel after a prolonged bearish trend. However, recent price action indicates a breakdown below the green ascending trendline, raising concerns about a potential shift in market sentiment.
Currently, the $117 level is acting as a pivotal support zone. A sustained breakdown below this level — and more critically, below the red lower trendline — would validate the bearish scenario. This could trigger a deeper correction phase, with downside targets aligned along the red projection path. Such a move may lead to significantly lower price levels in the medium to long term.
🔽 Bearish Scenario:
If the price fails to hold above $117 and breaks below the red trendline, this would confirm the start of a bearish leg. Based on historical structure and projected trajectories, this could result in a descent toward the $93 level initially, with the possibility of extending further downward depending on market conditions.
🔼 Bullish Scenario:
On the other hand, if the price manages to reclaim the green trendline and more importantly, stabilize above the $204 resistance zone, it would signal renewed bullish strength. Such a move would open the path toward higher highs, potentially re-entering the previous upward channel and continuing the macro uptrend.
🧭 The price structure is now approaching a decisive zone, where either a confirmation of bearish continuation or a bullish recovery will likely unfold. Both scenarios have been visually outlined — green lines indicating bullish continuation, and red lines representing bearish momentum.
📌 Note: This analysis is for educational purposes only and should not be interpreted as financial advice.
SOL/USDT Key Reversal Zone – Bounce or Breakdown?📊 Chart Analysis:
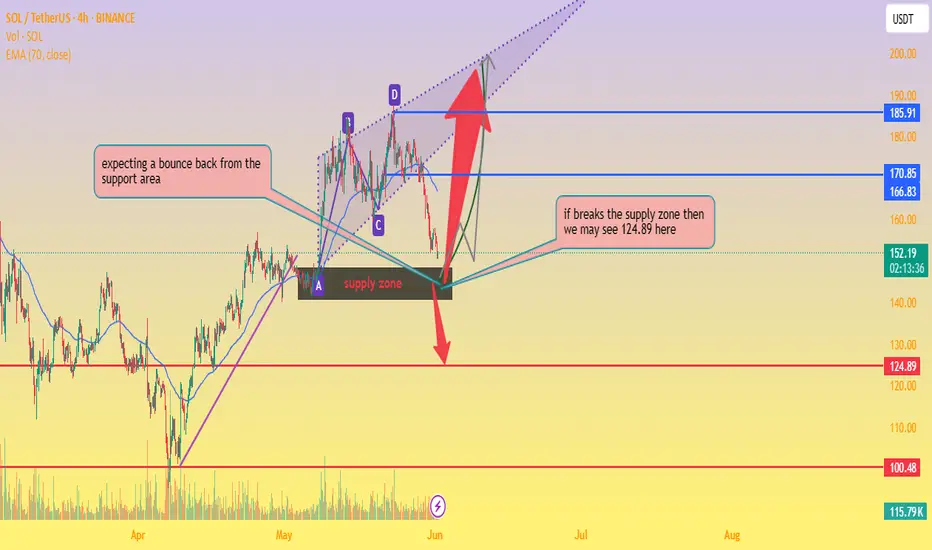
Current Price: $151.91
EMA 70 (Dynamic Resistance): $166.82
Support Area: Around $150, overlapping with a key supply zone.
Chart Pattern: Harmonic/ABCD structure completing near support.
🧠 Observations:
Price is testing a strong support/supply zone.
📦 If bounce occurs, potential targets:
🎯 First Target: $170.85
🎯 Second Target: $185.91
📉 If support breaks, then:
⚠️ Target: $124.89
📉 Next Major Support: $100.48
🧭 Trade Plan:
🔹 Long Entry (on bullish confirmation):
Entry: $152–$155
SL: Below $149
TP1: $170.85 🎯
TP2: $200 🚀
🔹 Short Entry (on breakdown confirmation):
Entry: Below $148
SL: Above $153
TP: $124.89 🧨
support and drop down your thoughts about it thanks
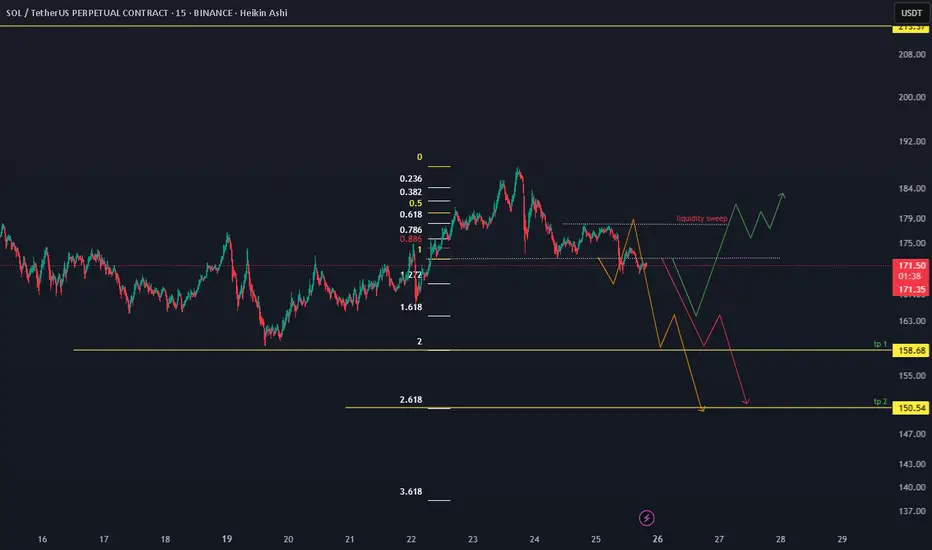
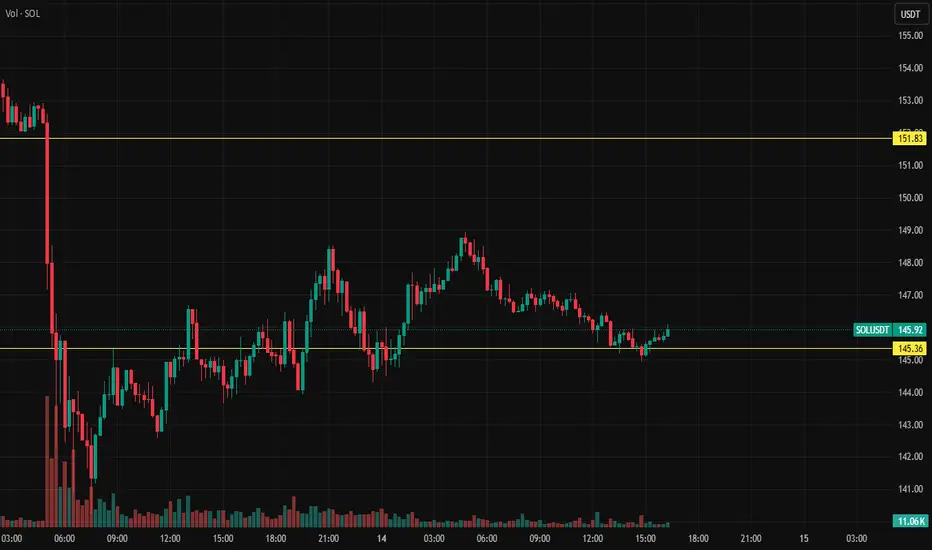
SOLUSDT 15m time frame bounce target.SOLUSDT has formed a bearish pattern on the 15min timeframe, with potential targets at 159 and 151.
I wouldn’t take a short entry here. Instead, I’ll wait for a bounce. Shorting now would be a counter-trade.
I’ve drawn a possible bounce zone, with a good entry point around the shorters’ TP2 at 151.
Another scenario involves a liquidity sweep before dropping to TP2, which would indicate a stronger bearish move.
The last possibility is a break above the liquidity sweep area, followed by consolidation and either a new high or a bullish structure formation. In that case, we could consider buying in that zone.
this is same scenario with doge but in 1hr time frame.
HolderStat┆SOLUSD rebound from supportCRYPTOCAP:SOL revisits the 150 pivot inside a corrective wedge, yet April’s growing channel stays intact. Confluence of horizontal demand, wedge resistance and prior consolidation tips a comeback toward 175, then the 185 ceiling, as long as trendline cradle support endures.

SOL final push downSOL is currently consolidating and building liquidity.
For a short position, we need to see a liquidity sweep into the supply zone, supported by the volume profile, followed by the price breaking below the 200-period EMA for final confirmation.

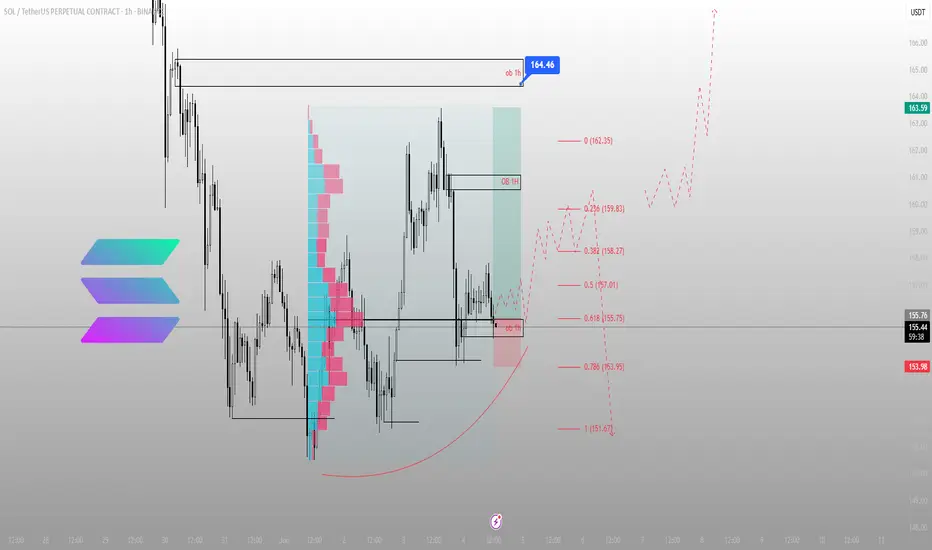
Price respected the level. The rest is execution.BINANCE:SOLUSDT just tapped the 1H OB near 155.75 — a zone defined by structure, not emotion. If you’ve been following the narrative, this isn’t a dip. It’s reaccumulation before displacement.
Here’s the setup:
Price tagged the OB at 155.75, perfectly aligning with the 0.618 fib — the algorithm’s comfort zone
Below this lies 153.95 — the invalidation level for the long idea
First upside target sits at 158.27 → then 159.83 → then a full rotation into 164.46, where we meet a 1H OB stacked with prior inefficiencies
The volume profile shows clear acceptance in this range. If we hold and rotate back above 157.01 with strength, expect continuation. If we sweep below 153.95 and fail to reclaim, the idea flips.
Execution clarity:
Longs from 155.75–155.00, invalidation below 153.95
First reaction target: 158.27
Full structure target: 164.46
Below 151.67 = deeper reprice scenario into weekly inefficiencies
No noise. No hype. Just structure. The chart is clean — the plan is already in motion.
Want more setups like this before they move? Profile description has them.

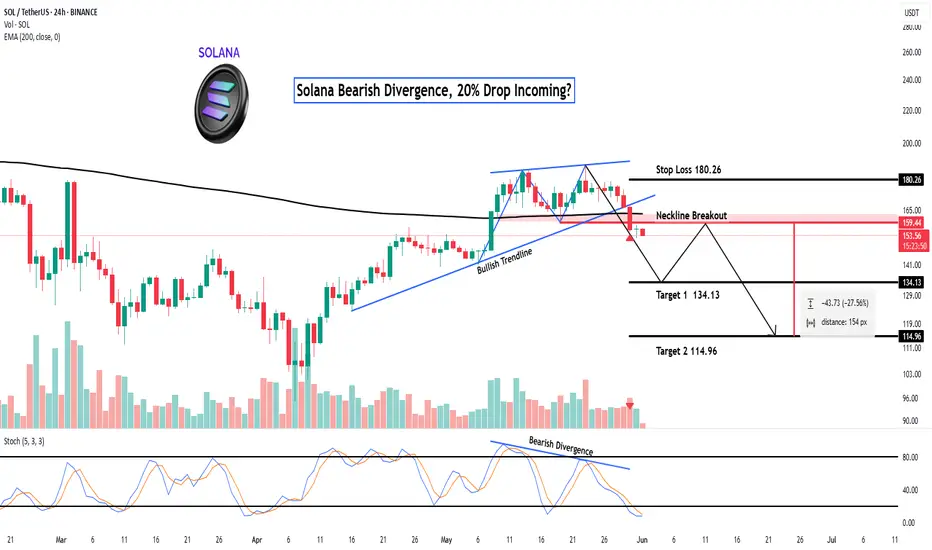
Solana Bearish Divergence, 20% Drop Incoming?Hey Realistic Traders!
Bearish Signal Flashing on BINANCE:SOLUSDT , What Signals Are Showing?
Let’s Break It Down..
On the daily timeframe, Solana has formed a double top pattern, followed by a neckline breakout, which is a classic sign of a potential shift from a bullish to a bearish trend.
This breakout was confirmed by a break of the bullish trendline, accompanied by rising selling volume, which reinforces the bearish momentum. Adding to this, a bearish divergence has appeared on the stochastic oscillator. Bearish divergence occurs when price makes higher highs while the oscillator forms lower highs, signaling weakening buying pressure and increasing the likelihood of a reversal.
Given these technical signals, the price is likely to continue moving lower toward the first target at 134.13, with a possible extension to the second target at 114.96.
This bearish outlook remains valid as long as the price stays below the key stop-loss level at 180.26.
Support the channel by engaging with the content, using the rocket button, and sharing your opinions in the comments below.
Disclaimer: "Please note that this analysis is solely for educational purposes and should not be considered a recommendation to take a long or short position on Solana.
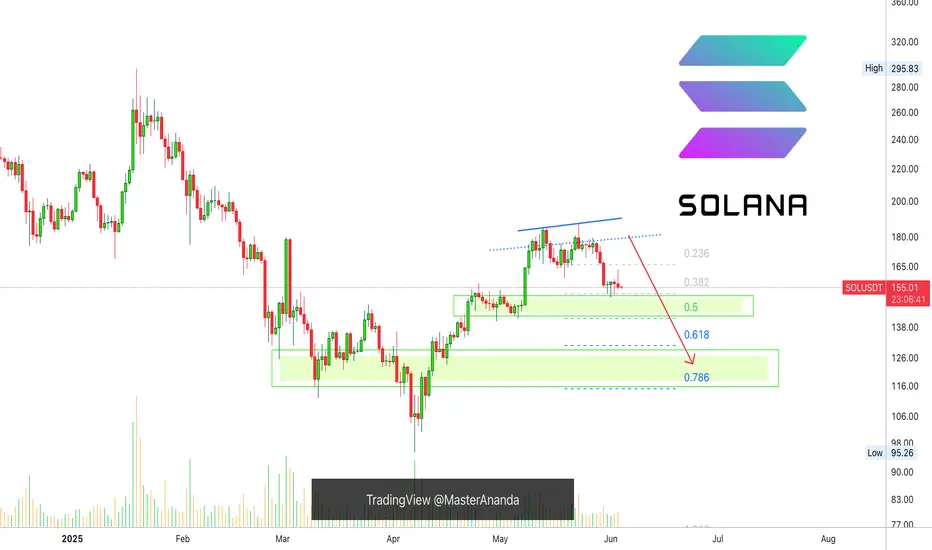
Solana Still Bearish, Moving LowerI will alert you here when the bearish potential is completely nullified. Right now, Solana is still bearish. This applies to all other major projects that I shared recently but I will also update those.
The maker produced a rejection yesterday, 3-June, as a lower high. This implies a bearish continuation. The two levels mapped on the chart are the main support zone.
Since the first level is already being challenged, we can aim for the second one.
Once the correction is over, we will go bullish again.
Some of the smaller altcoins can grow while the rest of the market crashes down. Choose wisely. It will be hard right now.
Namaste.
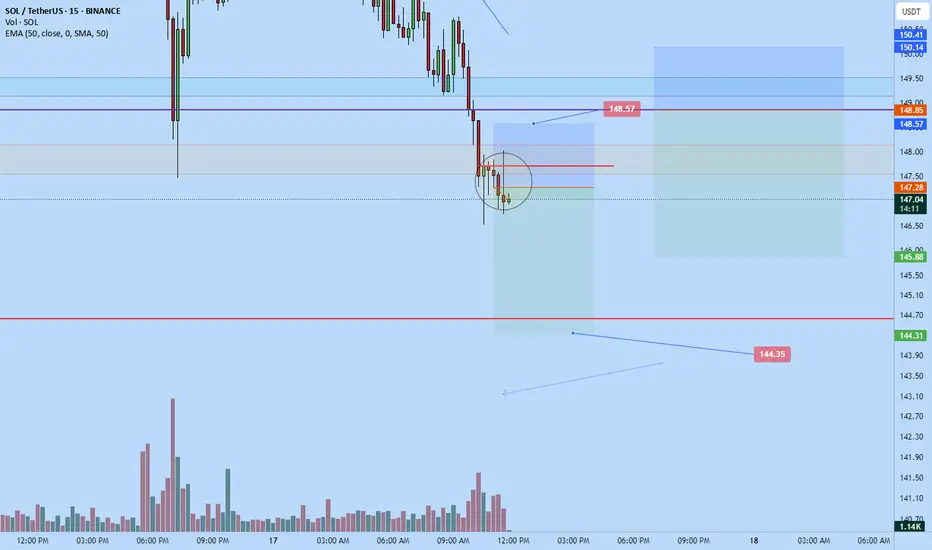
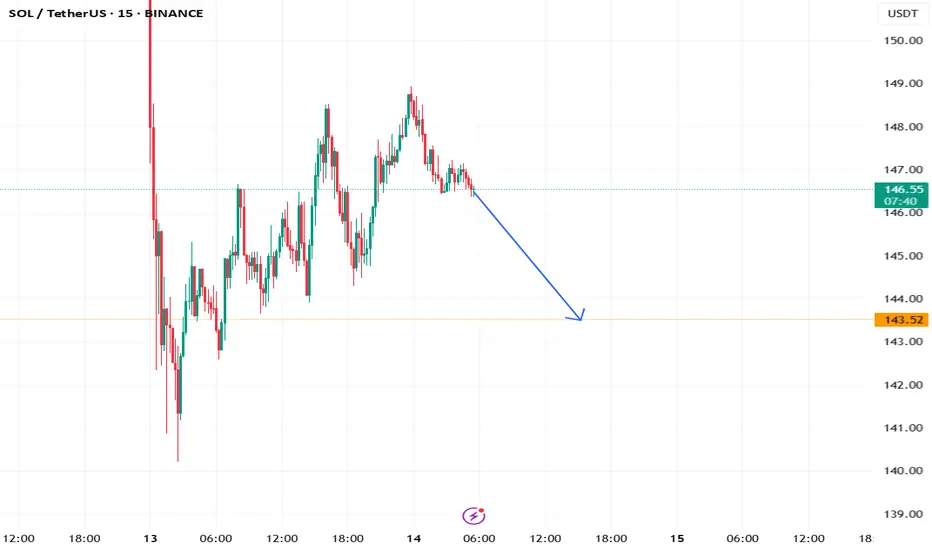
Solana scalp shortRecently opened a scalp short position on solana. The market structurally is at LL point in usual market continuation but we having a big sell off it seems so could push lower down to $144.35 area before we get a bounce. In the event though I get stop I"ll look for a re-entry as $144.35 is like area to get tested before any major upside.
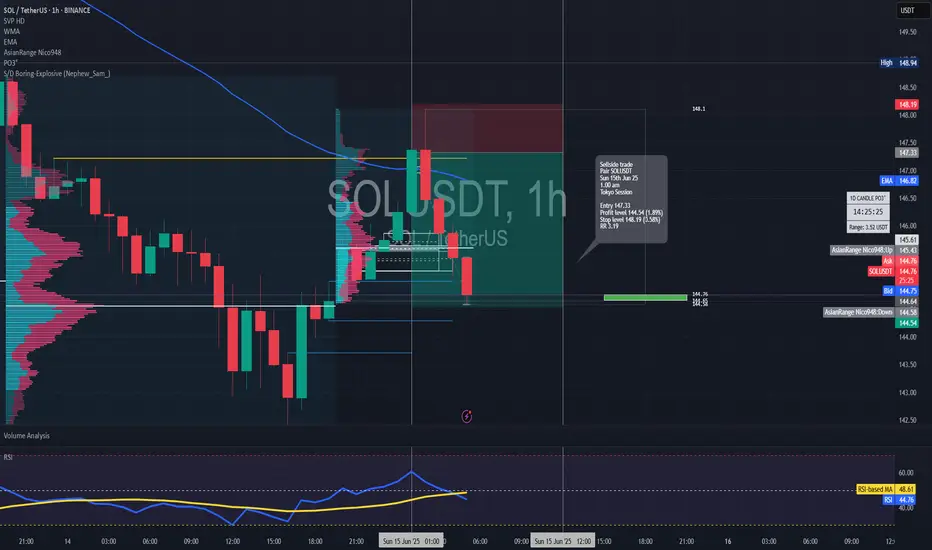
Short trade
Pair: SOLUSDT
Trade Type: Sell-side trade
Date: Sunday, 15th June 2025
Time: 1:00 AM
Session: Tokyo Session
Entry Timeframe: 15min TF
📍 Trade Details
Entry Price: 147.33
Profit Level: 144.54 (1.89%)
Stop Level: 148.19 (0.58%)
Risk-to-Reward Ratio (RR): 3.19
🧠 Context / Trade Notes
Trade executed during the Tokyo session, known for lower liquidity and often used to fade exaggerated price moves from the prior sessions. Price tapped into a minor supply zone formed during the late NY session, showing early signs of sell-side intent.
1Hr TF Overview
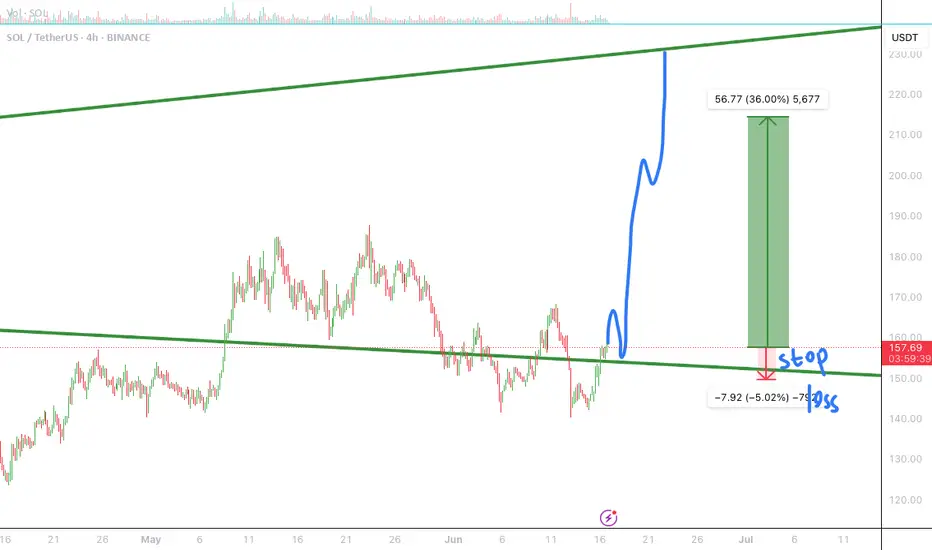
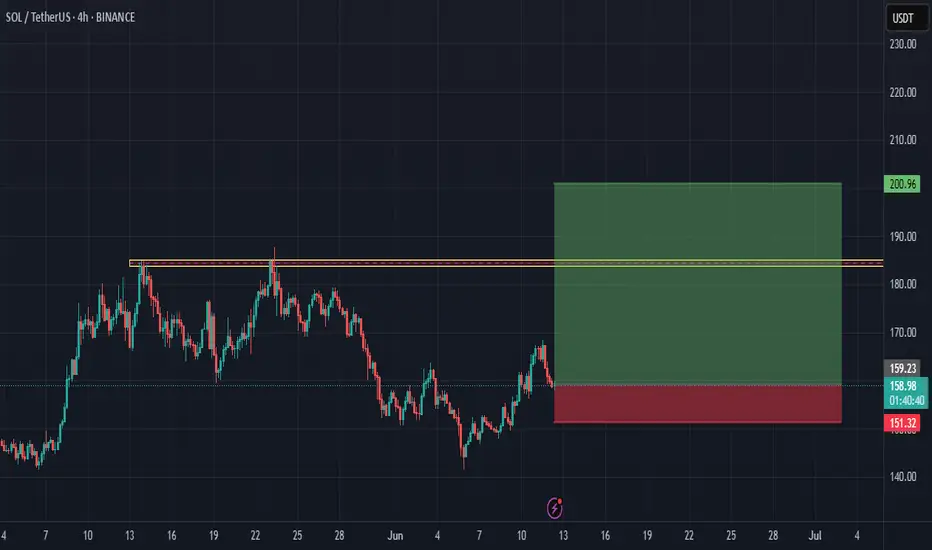
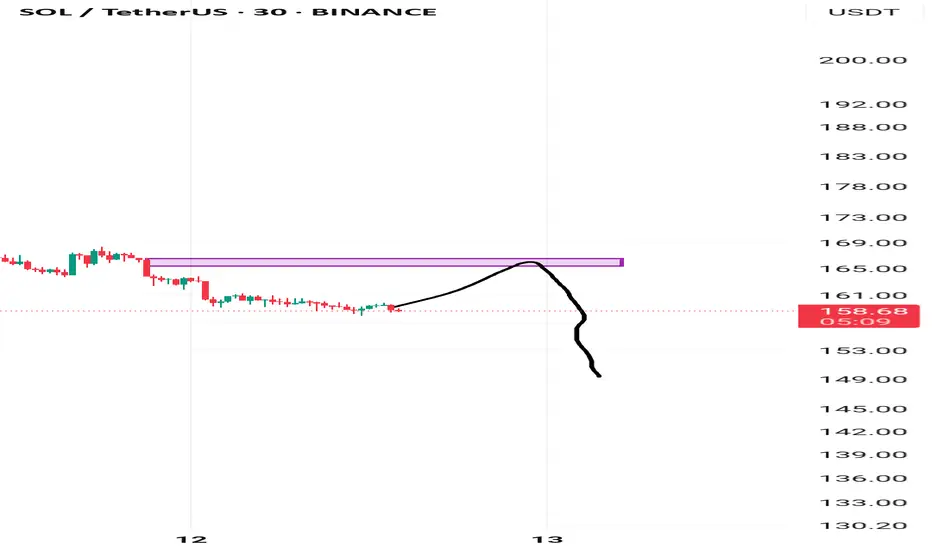
SOLUSDT H4 12th Juneresistance specified which is touched two times. I think that the resistance would break and SOL hit 200$
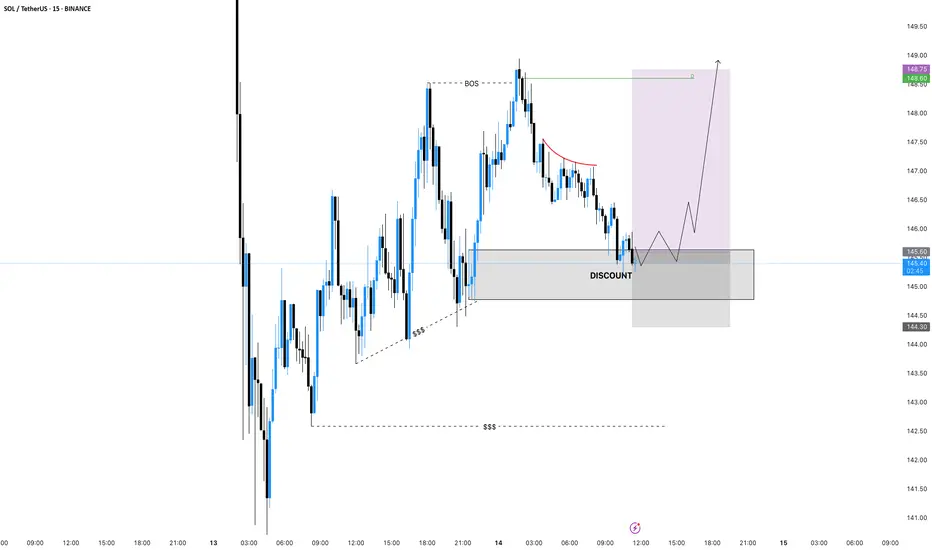
SOL ( Probably)SOLUSDT
The structure gave BOS up. Now the price has returned to the discount zone, from where we can see the reaction.
If we work out the demand zone and break the local structure on M15, I'll go long.
The goal is to update the high.
We are watching.
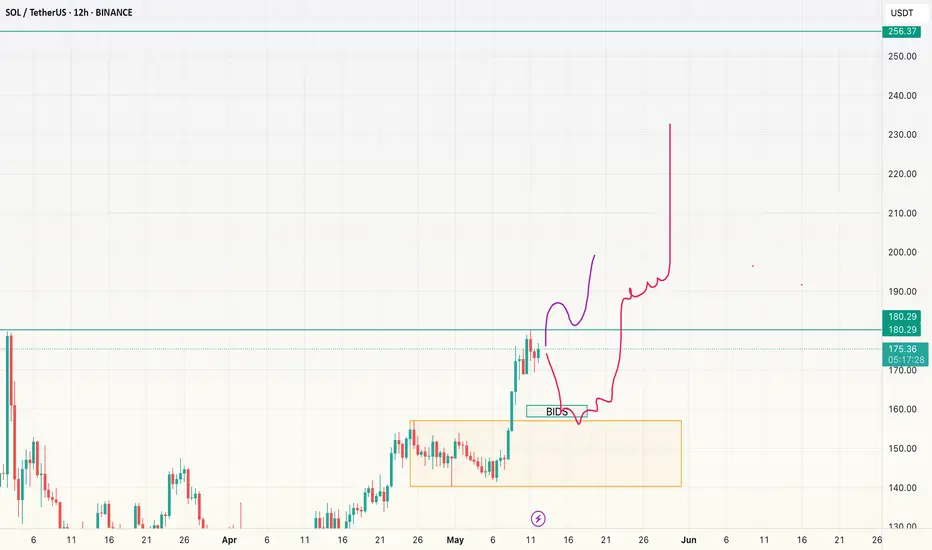
SOL-Long planCurrently at S/R ~180. Either we break past today or post-CPI or we get a little whipsaw around CPI for which setting bids at 12H OB marked (yellow box) is a good idea. Either way, midterm target remains at $256, hopefully sometime in June.
$sol long 🧠 Trade Thesis
SOL has pulled back into a key demand zone around the $144–$145 range, forming a potential bullish reversal setup after a steep drop. This level coincides with previous structure support and could act as a springboard for a bullish bounce targeting higher resistance levels.
🎯 Trade Setup
Entry: $145.06 (current price)
Stop Loss: $139.21
Take Profit Targets:
TP1: $160.65 (recent structure high)
TP2: $168.22 (local resistance)
TP3: $179.32 (supply zone)


Very strong bearish trend is ahead!We expect after a pull back to the order block solusdt fall atleast 10-20%!
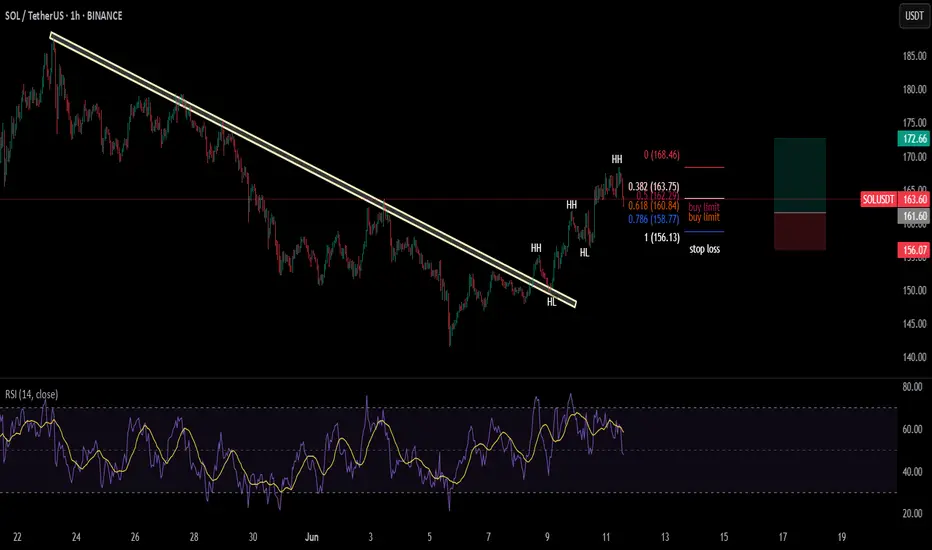
Solana(SOL) in bullish trend!!!the coin has broken the trendline and then also retested it to confirm its bullish rally right now the price action is simply following DOW theory by making HHs & HLs. I have opened a long position on the chart with 1:2 RR.
HolderStat┆SOLUSD reached resistance lineCRYPTOCAP:SOL just flipped the 157 pivot into support after escaping a falling channel and retesting the up-trend. Holding here fuels a run toward the 170 trend-cap and 180 supply shelf; failure invites 150 again. Growing channel, consolidation clusters, breakout watch.
