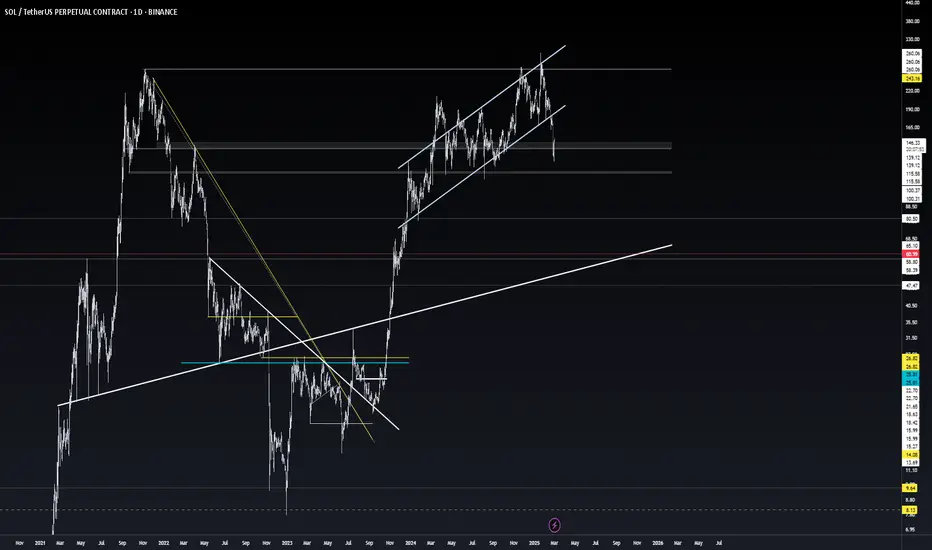
sol/usdtconsistently weakening with lower highs and failed recoveries for months. Structure still leaning bearish until a decisive reclaim of key levels. Waiting in shorts
SOLUSDT.P trade ideas
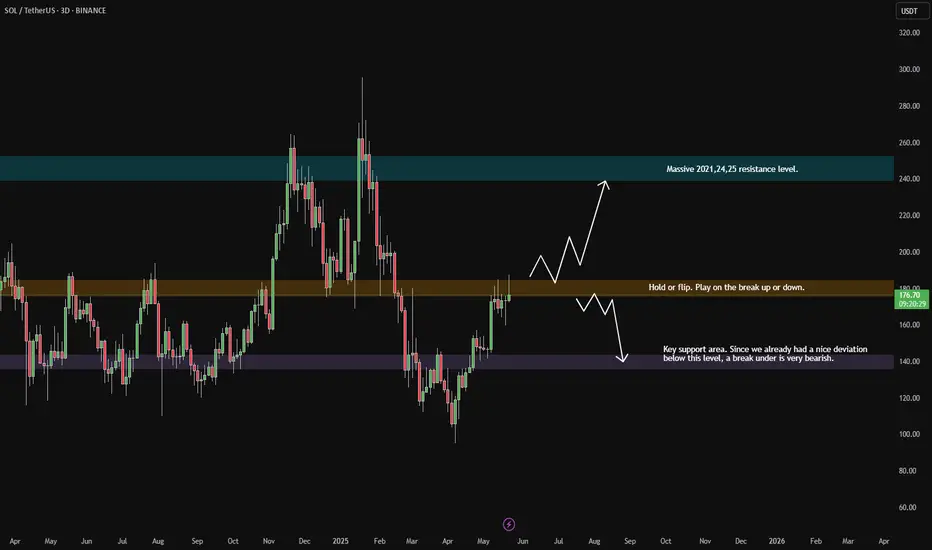
SOL macro plan3D chart looks very simple here. Simply act on the break on the current zone and take the position to target opposite liquidity area.
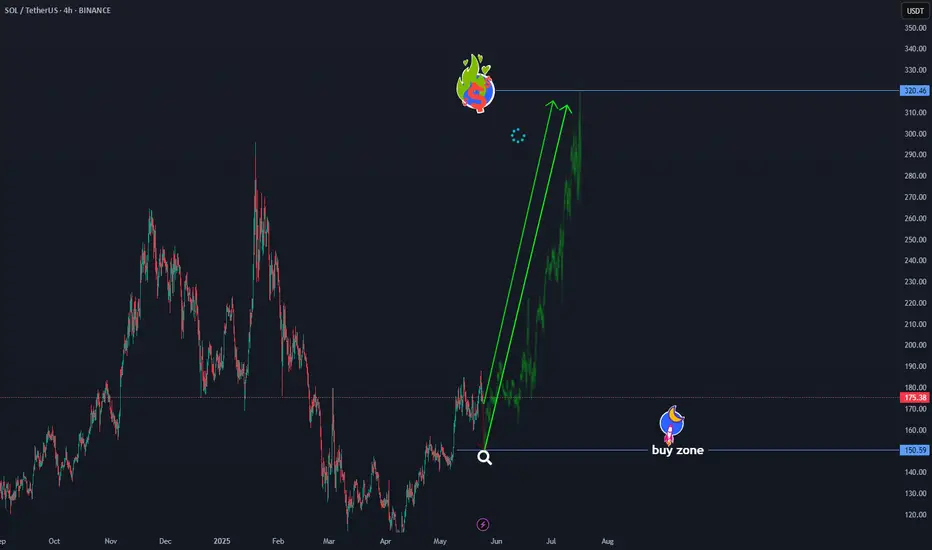
solusdt will go to towards 320$solusdt BINANCE:SOLUSDT will go towards $320
In the current area, a downward correction to $150.5 is possible, but ultimately the final destination is $320,
Market geometry doesn't lie.
$320 is an index for this symbol.
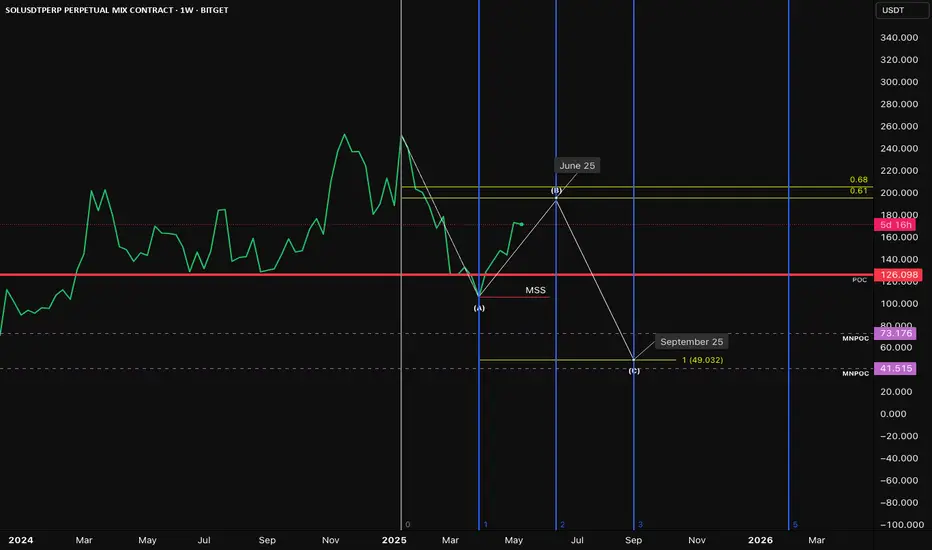
Just a Thought: What If the Big Bull Run Starts Next February?Chart: SOLUSDT Perpetual (1W)
Let’s play devil’s advocate for a second…
📉 What if:
The most recent pullback from Solana’s all-time high wasn’t just a dip to find support, but a high timeframe market structure break (MSS)?
We wicked right into the Point of Control (POC) at $126, a critical level going back to Solana’s inception. Many saw that as a liquidity sweep, which it is, but what if that break was confirmation of a shift in the macro structure?
Since then, we’ve seen a corrective rally, and as of now, price is approaching the golden pocket (0.618–0.65) around the $200 region coupled with time Fib confluence around June 25.
⚪ The ABC Hypothesis:
There’s a clean potential for an (A)-(B)-(C) correction. If the market can’t push through the $200 resistance in June, we could see a dragged out move down into the 1:1 extension, which interestingly aligns with key monthly naked POCs (MNPOCs) at $73 and $41, and specifically the 1:1 at $49 (highlighted on the chart for September 25).
That would create a textbook ABC correction, where:
• A = drop from ATH to MSS
• B = golden pocket retracement
• C = 1:1 extension, sweeping long-term liquidity
📅 What if the real bull run doesn’t start until Feb 2026?
Everyone’s calling for the big breakout this year… but what if we need one last washout to fully reset? That timing aligns eerily well with early Q1 2026, after a final leg down.
Chart Legend:
• ✅ Green line = current price
• 🔴 POC = Point of Control (macro volume node)
• ⚪ White lines = ABC structure
• 🔵 Blue verticals = time-based Fibonacci
• 🟡 Golden Pocket = 0.618–0.65 retracement
• 🟣 MNPOC Levels = untested monthly points of control
Just a theory. Not advice. DYOR.
What do you think? Could the real reset be coming?
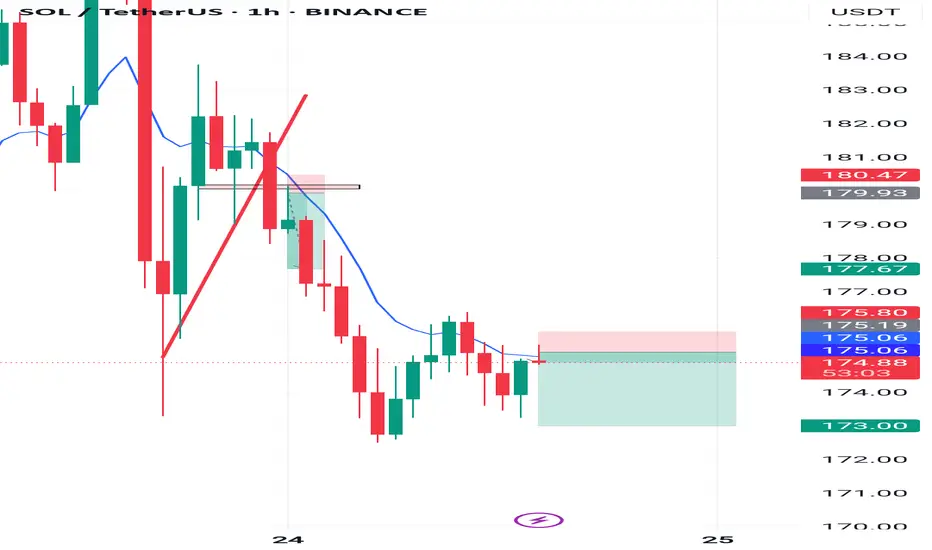
Solana Analysis 1HTMThis is a 1-hour chart of SOL/USDT (Solana vs Tether) on TradingView. Here's a breakdown of the technical analysis visible:
Trade Setup Overview:
Current Price: ~$175.05
Entry Point: Around 175.09 (marked by blue horizontal line and entry candle)
Stop Loss (SL): Around 175.80 (red zone above the entry)
Take Profit (TP): Around 173.00 (green zone below the entry)
Chart Analysis:
1. Trend:
Recent price action shows a strong downward trend, with consecutive bearish candles.
Price tried to break above the 9-period EMA (blue line), but it's acting as dynamic resistance.
2. Entry Logic:
The trade is a short/sell position.
Entry was likely made after a bearish rejection from the EMA or minor structure resistance.
Trader expects price to drop further towards the 173.00 level.
3. Risk-to-Reward Ratio (RRR):
SL is small (~0.7 points above), TP is large (~2 points below), suggesting a good RRR (approx. 1:3).
That’s a positive sign for proper risk management.
4. Bearish Confirmation:
The green candle that hit the EMA and then showed weakness might be a signal of rejection, confirming bearish sentiment continuation.
5. Key Levels:
Resistance: 175.80 – 177.67 zone
Support: 173.00 zone (target)
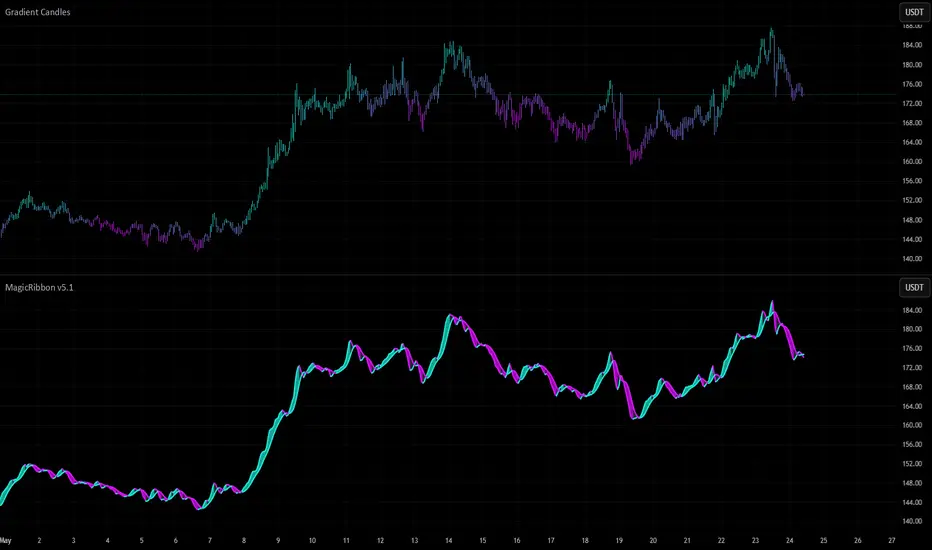
Two MAs, One Ribbon: A Smarter Way to Trade TrendsSome indicators aim to simplify. Others aim to clarify. The RedK Magic Ribbon does both, offering a clean, color-coded visualization of trend strength and agreement between two custom moving averages. Built by RedKTrader , this tool is ideal for traders who want to stay aligned with the trend and avoid the noise.
Let’s break down how it works, how we use it at Xuantify, and how it can enhance your trend-following setups.
🔍 What Is the RedK Magic Ribbon?
This indicator combines two custom moving averages:
CoRa Wave – A fast, Compound Ratio Weighted Average
RSS_WMA (LazyLine) – A slow, Smooth Weighted MA
When both lines agree on direction, the ribbon fills with:
Green – Bullish trend
Red – Bearish trend
Gray – No-trade zone (disagreement or consolidation)
Key Features:
Visual trend confirmation
No-trade zones clearly marked
Customizable smoothing and length
Works on any timeframe
🧠 How We Use It at Xuantify
We use the Magic Ribbon as a trend filter and visual guide .
1. Trend Confirmation
We only trade in the direction of the ribbon fill. Gray zones = no trades.
2. Entry Timing
We enter near the RSS_WMA (LazyLine) for optimal risk-reward. It also acts as a dynamic stop-loss guide.
🎨 Visual Cues That Matter
Green Fill – Trend is up, both MAs agree
Red Fill – Trend is down, both MAs agree
Gray Fill – No-trade zone, MAs disagree
This makes it easy to:
Avoid choppy markets
Stay aligned with the dominant trend
Spot early trend shifts
⚙️ Settings That Matter
Adjust CoRa Wave length and smoothness
Tune RSS_WMA to track price with minimal lag
Customize colors, line widths, and visibility
🧩 Best Combinations with This Indicator
We pair the Magic Ribbon with:
Structure Tools – BOS/CHOCH for context
MACD 4C – For momentum confirmation
Volume Profile – To validate breakout strength
Fair Value Gaps (FVGs) – For sniper entries
⚠️ What to Watch Out For
This is a confirmation tool , not a signal generator. Use it with structure and price action. Always backtest and adjust settings to your asset and timeframe.
🚀 Final Thoughts
If you want a clean, intuitive way to stay on the right side of the trend, the RedK Magic Ribbon is a powerful visual ally. It helps you avoid indecision and focus on high-probability setups.
What really sets the Magic Ribbon apart is the precision of its fast line—the CoRa Wave. It reacts swiftly to price action and often aligns almost perfectly with pivot reversals. This responsiveness allows traders to spot potential turning points early, giving them a valuable edge in timing entries or exits. Its accuracy in identifying momentum shifts makes it not just a trend filter, but a powerful tool for anticipating market moves with confidence.
Try it, tweak it, and let the ribbon guide your trades.
Solana (SOL): Re-Testing Resistance Zone | Sell Opportunity!Solana has reached the major resistance zone where it is retesting the recently broken zone, which will determine the next bigger movement of the coin. We are seeking to see an MSB to fulfill properly, which can lead the price to dip another 22%.
More in-depth info is in the video—enjoy!
Swallow Academy

Solana (SOL): Filled CME + Successful Re-Test | Possible 30% DipSolana has recently broken the local support zone, where yesterday we had a successful re-test of it with a fill of bullish CME gap.
Sellers are showing yet again a dominance near this zone so once we see a proper MSB on a 30M timeframe, we will be looking for a short!
Swallow Academy

SOL showing strength despite the orange swan event. SOL will either break out or consolidate into a tradable structure. The orange swan event sell-off leading into the weekend is not a good time to enter fresh trades. However, preparing appropriately for what is coming next is a valid strategy.
Full TA: Link in the BIO

Solana (SOL): Might Form Break of Structure / 30% MovementWe are seeing strong pressure from sellers where we are not looking for a possible break of structure, which would give us a potential movement of 30% and a good R:R position to take!
More in-depth info is in the video—enjoy!
Swallow Academy

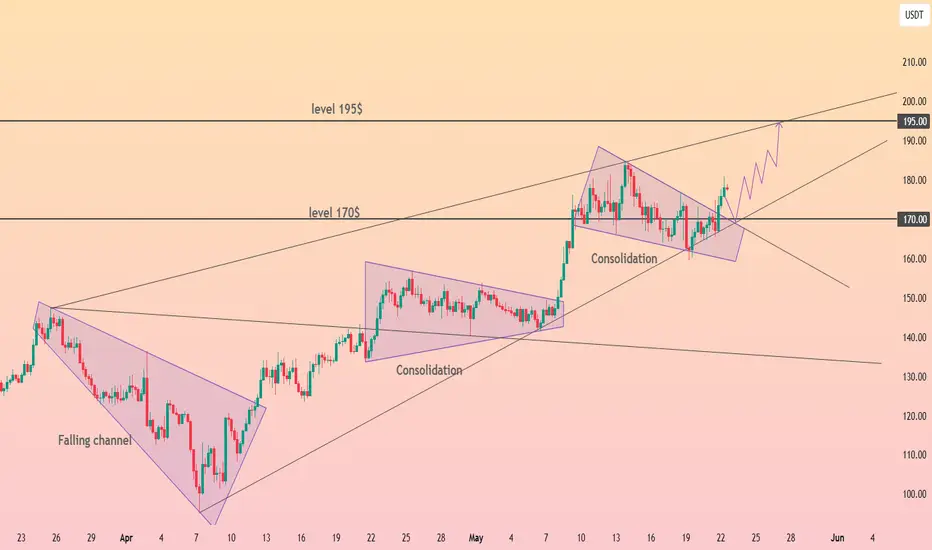
HolderStat┆SOLUSD held the support trend lineCRYPTOCAP:SOL sprinted from a falling channel into a sturdy growing channel, staging pauses at 145 and 170. Price now coils inside a descending mini-flag clamped to the 170 horizontal—flip that lid and the 195-200 magnet comes alive, mirroring the flag’s height. Only a decisive close below 160 would dull the current trajectory toward fresh 200-plus highs.
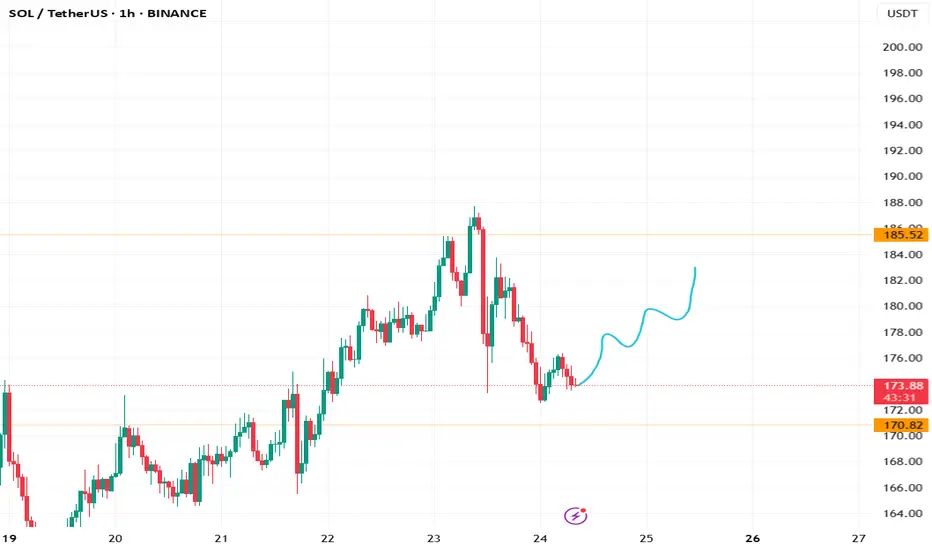
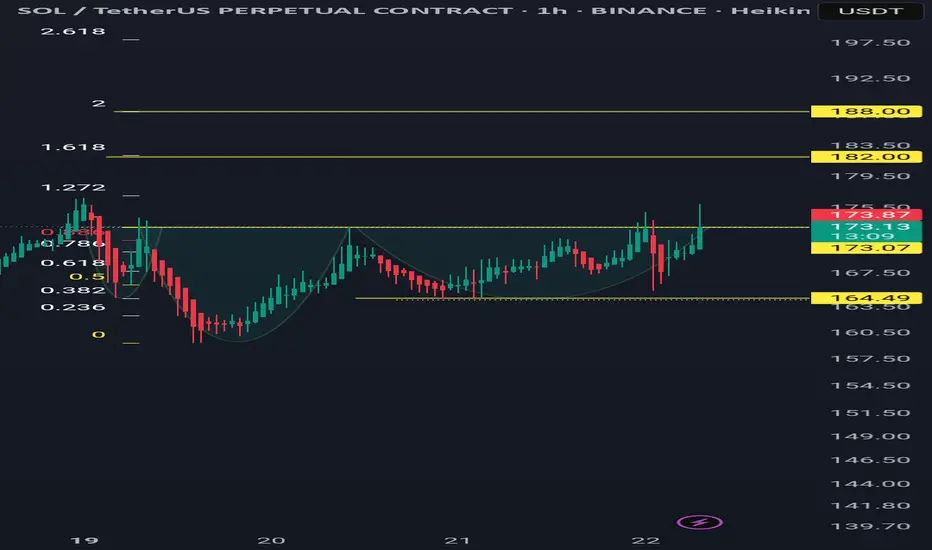
Solusdt 1hr tf forming Bullis ih&s patternSOL/USDT is potentially forming a bullish head and shoulders pattern. The pattern may activate if it closes above $173.07 thereby confirming a breakout.
For a better risk-to-reward ratio, consider buying on a pullback within the range of the right shoulder.
Targets are $182 and $188. While not yet confirmed, there's a high probability of a breakout.
Invalidation if closes below the bottom of right shoulder 164.4 in 1hr time frame.
You can also place a limit order at 164.4 for a better RRR. However, make sure to close your trade if the price closes below this level, as this would invalidate the pattern.
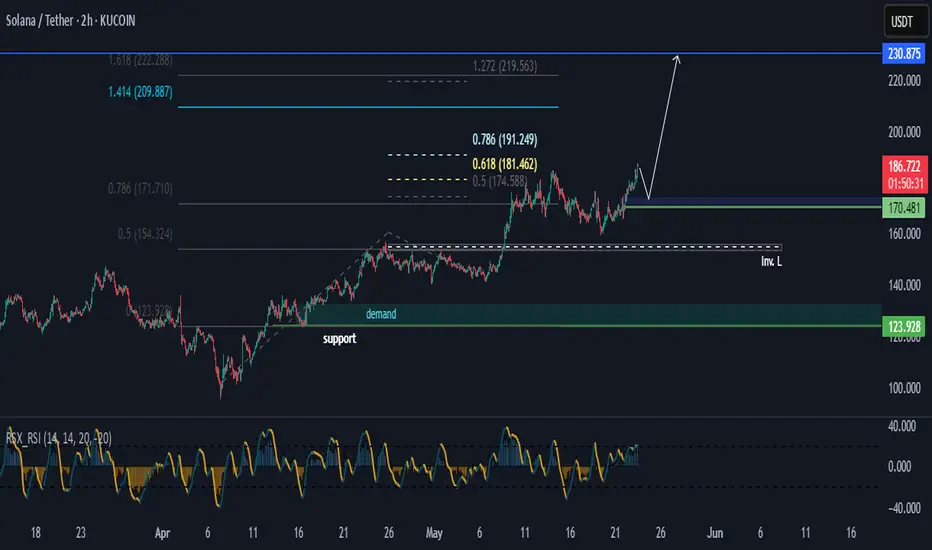
SOLUSDT Looking UpHi there,
Solana looks bullish on the 2-hour timeframe. There is a possibility of a retracement, but if the price falls below the 154.324 level, the setup will be invalidated.
For now, the price appears to be heading up toward the 191.249 level, aiming for a target of 209.887.
The low point at 170.481 maintains bullish pressure, supported by the 164.271 level, which boosts the chances of a higher high.
However, it will require monitoring due to the indicator reaching overbought regions.
Happy trading,
K.
Not trading advice
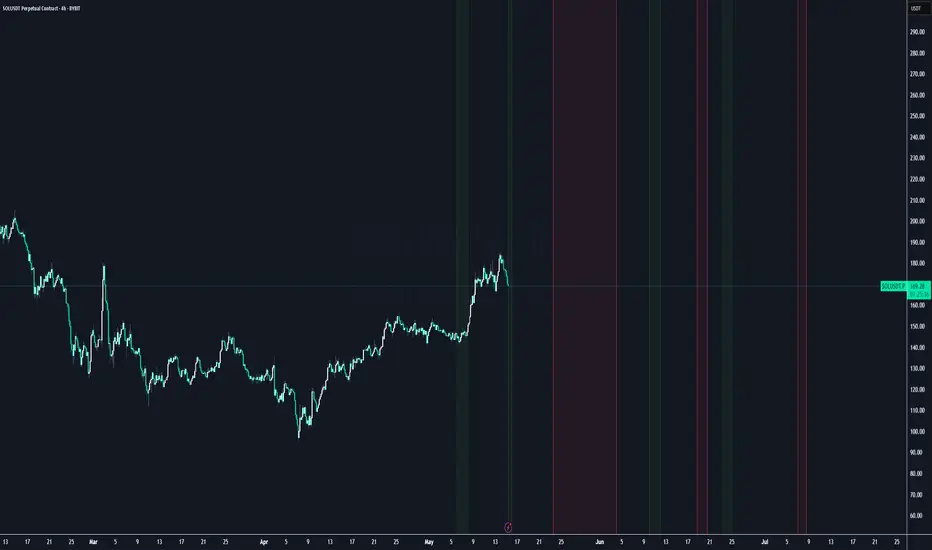
Buy/Sell (long/short) areas for major cryptos*experimental*
Buying (green) and selling (red) areas based on time and m2 supply lagged theory (77d)
using valid key levels (highs/lows) to get in and out within those coloured periods
should work on major alts and btc
SOL/USDTHello, I hope you are well. I left you the analysis of Solana. Tell me your opinion. I saw that it is bullish and it may reach the target I set. If the white area breaks, we can buy again and go up.

Solana is the futuremany new and upcoming projects are using Sol to launch the meme coins and platform sol is user friendly that you can literally make $100 000 from $10 and good marketing buying solana now is like buying Bitcoin 10 years Ago
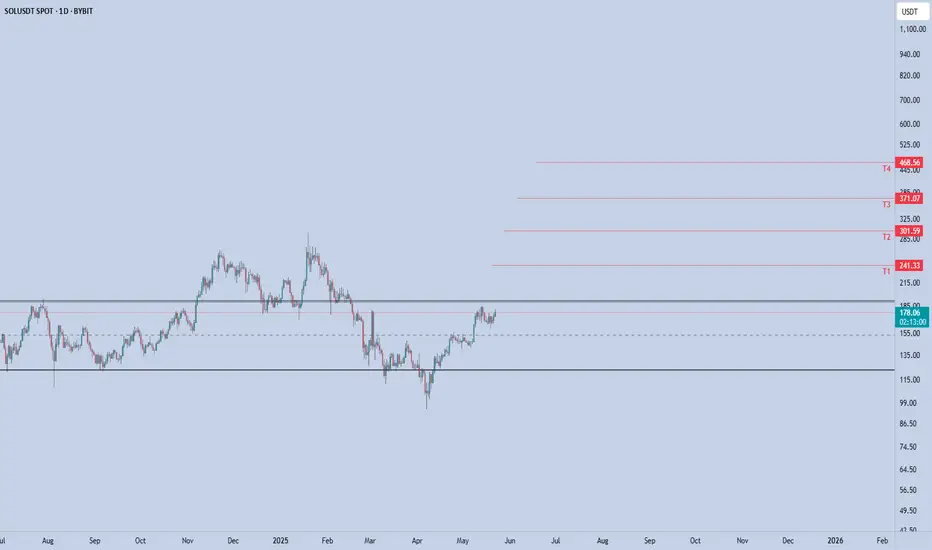
SOLANA - Light it up
SOLANA can flip the $185 resistance into support, it opens the door for a potential rally toward the next key levels:
T1: $241
T2: $301
T3: $371
T4: $468
The structure is clean, and the market sentiment is shifting. As long as SOL holds above the reclaimed range and macro conditions remain supportive, this setup could deliver serious upside.
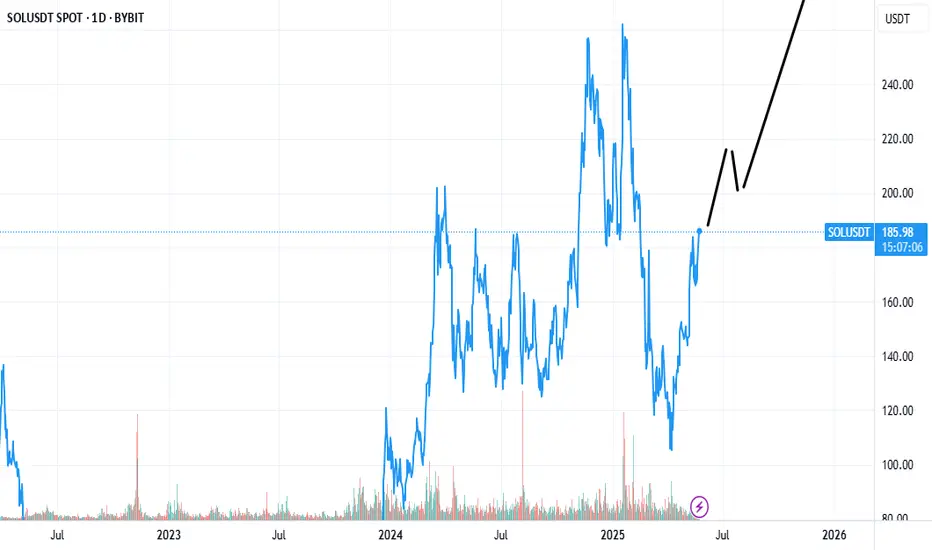
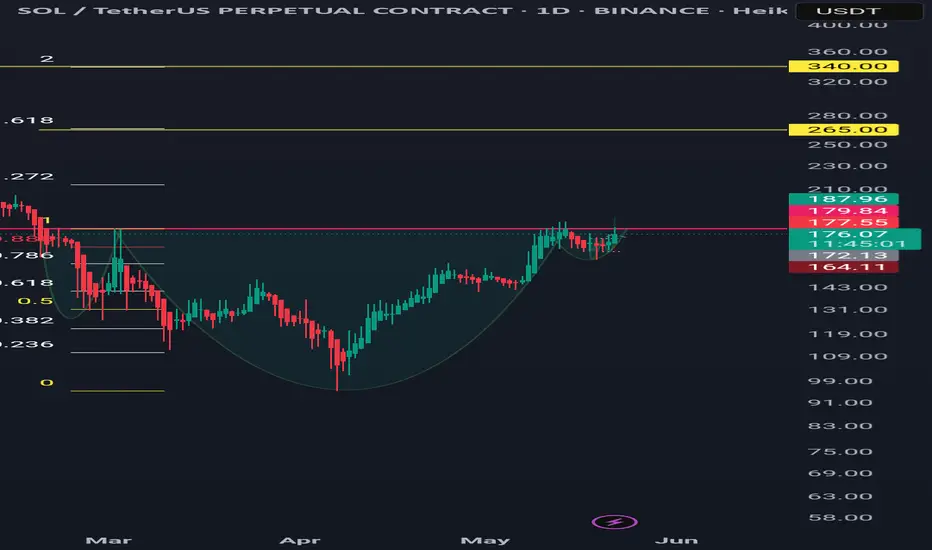
Solusdt daily time frame bullish cup and handle/iH&S patternSOLUSDT is forming a bullish pattern: a cup and handle or inverse head and shoulders. If it closes above 180 in the daily timeframe, the pattern may activate.
Targets are 265 and 340.
The pattern is invalidated if it closes below 159 in the daily timeframe, assuming it didn't break the previous low before the breakout.
Entry is from the neckline down to the low of the right shoulder, or whatever risk-reward ratio you are comfortable with.
#SOL/USDT#SOL
The price is moving within a descending channel on the 1-hour frame and is expected to break and continue upward.
We have a trend to stabilize above the 100 moving average once again.
We have a downtrend on the RSI indicator that supports the upward move with a breakout.
We have a support area at the lower limit of the channel at 166, which acts as strong support from which the price can rebound.
Entry price: 172.
First target: 176.
Second target: 181.
Third target: 186.

Greed: The Silent Killer Behind Your LiquidationsWhen the market turns green, everyone feels like a genius... But why do most traders lose the most money exactly at that point?
Is it your greed tricking you, or is the market designed to trap emotions?
In this analysis, we take a deep dive into how greed shapes your decisions — plus tools to help you stay rational before placing any trade.
Hello✌
Spend 3 minutes ⏰ reading this educational material.
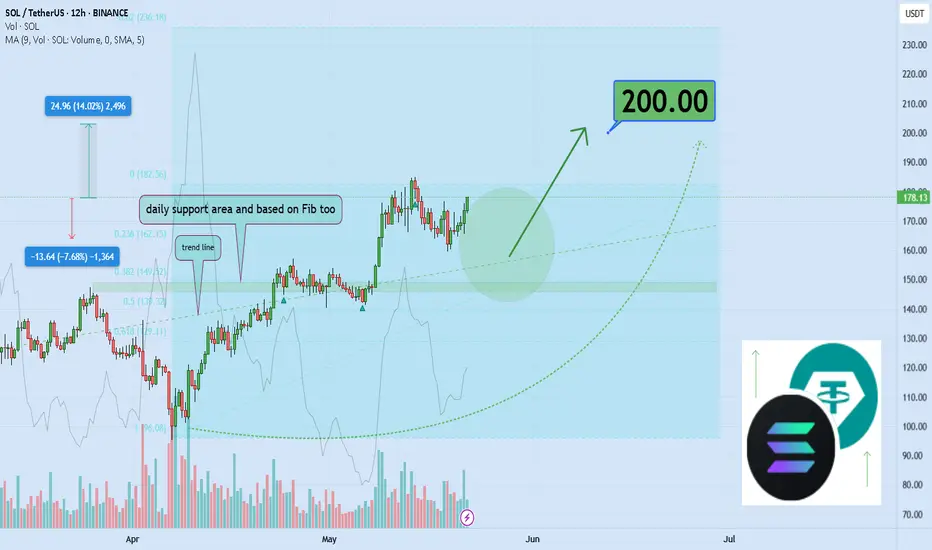
🎯 Analytical Insight on Solana:
SOL, a market leader and one of my top picks, is currently consolidating near the critical psychological level of $200. Given its historical momentum and influence over correlated assets, a clean break above this level could trigger a minimum 14% upside, with $200 as the immediate target . Market sentiment remains cautious, but the setup hints at a potential bullish continuation 🚀.
Now , let's dive into the educational section,
💥 Where Does Greed Actually Start?
Greed often wears the mask of motivation. The difference? Motivation is rooted in analysis. Greed is rooted in fantasy.
When a coin suddenly pumps 150%, the noise on social media explodes — and so do your imagined gains… often before you've even checked the 4H chart.
📊 TradingView Tools to Spot Greed Traps
TradingView isn't just about pretty charts — it's a powerful platform to organize your trading mindset, if you know how to use it right. Here are three practical tools to help you identify whether your next trade is based on logic — or just plain hype:
Fear & Greed Index:
A composite indicator showing the market's emotional state using volume, volatility, and other metrics. Readings above 70? You’re probably in a greed zone.
Volume Profile Visible Range (VPVR):
This shows where real money has flowed. If you’re buying in a price zone with historically low volume, you might be walking into a fake breakout.
Relative Strength Index (RSI) with 2 or 7 Settings:
A hyper-reactive RSI setting helps you catch emotional peaks in smaller timeframes. Above 80? Time to breathe, not buy.
Pro tip : Build a self-check list on your chart. Questions like: “Am I acting on impulse?” or “Is this revenge trading?” can save you from emotional trades.
🔁 Repeating Behaviors That Kill Accounts
Entering with high leverage and no stop-loss
Buying into massive green candles
Copying trades without personal analysis
Switching strategies based on emotions
Trading just to recover past losses (aka revenge trading)
These are not strategy flaws — they are emotional traps caused by unchecked greed.
🧘♂️ How to Calm Your Mind Before Trading
Ask yourself: "If this trade flips against me, what's my move?"
Use TradingView Alerts instead of staring at charts for hours
Define risk per trade as a percentage, not based on "gut feeling"
Always have an exit plan — the market doesn’t care about your hopes
📉 Is Liquidation Always a Sign of Bad Analysis?
Not always. Often, the chart was right, but greed kept the trader from exiting at the logical spot. Tools told you to get out — but your mind said, “What if it goes higher?”
🧭 How Greed Shows Up in Different Timeframes
In 5-minute charts, greed looks like sudden spikes. In 4H charts, it can be a fakeout or deceptive pullback.
Recognizing the form greed takes in your preferred timeframe is a game-changer.
🧲 How to Use Greed to Your Advantage
Yes — you can flip the script. When everyone is entering trades driven by greed, you can prepare to exit.
If RSI is high, volume is weak, and hype is everywhere — maybe it’s time to cash out, not load up .
💡Closing Note
Greed exists in every market — but that doesn’t mean you have to follow it.
Start treating your chart like a mirror — not a crystal ball. When a trade feels “too perfect,” stop and reflect. It might not be your edge talking — it might be your greed .
always conduct your own research before making investment decisions. That being said, please take note of the disclaimer section at the bottom of each post for further details 📜✅.
Give me some energy !!
✨We invest countless hours researching opportunities and crafting valuable ideas. Your support means the world to us! If you have any questions, feel free to drop them in the comment box.
Cheers, Mad Whale. 🐋

Solana (SOL): Good Possibility That We Will Move Towards $200Solana is showing strong signs of possible movement to upper zones, which would give us a chance to go towards the $200 area.
More in-depth info is in the video—enjoy!
Swallow Academy
