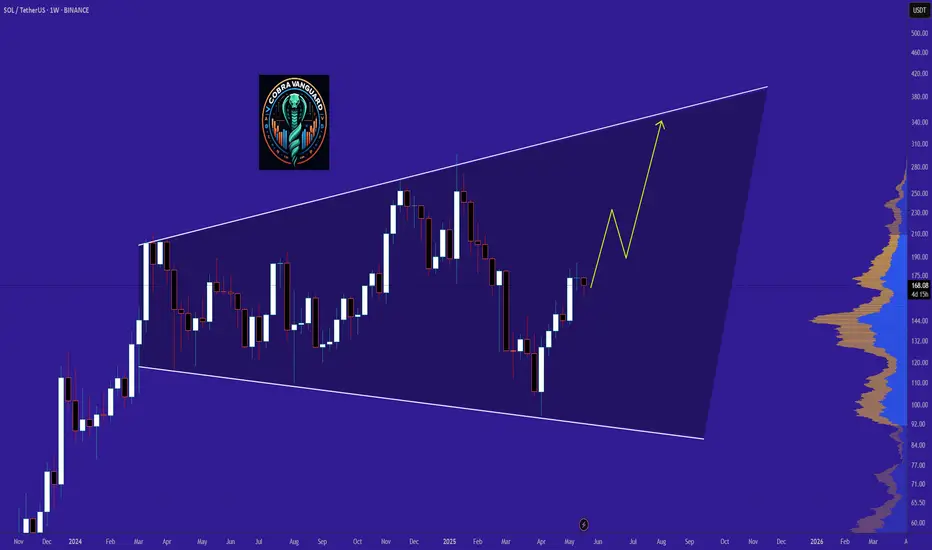
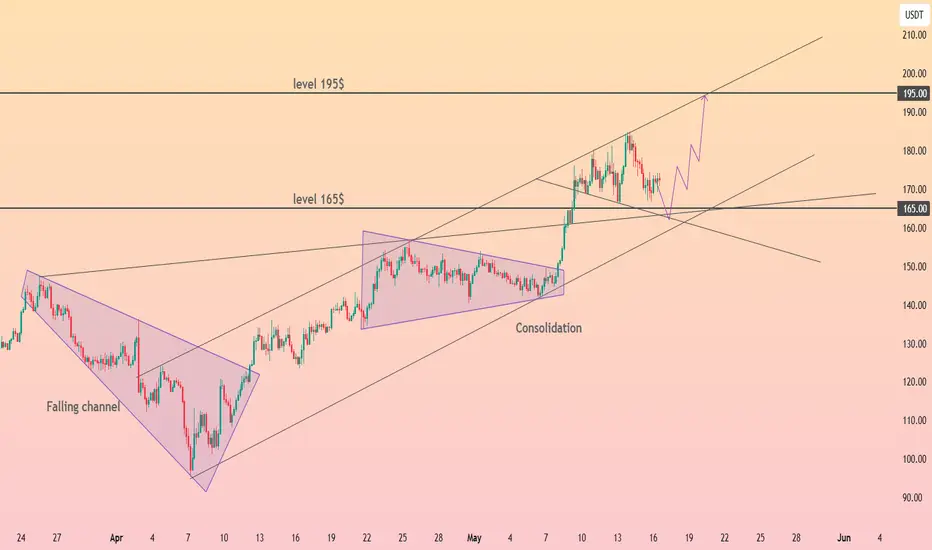
Give me some energy !!!The SOL will increase $150 and reach to the top of the wedge in the coming weeks .
Give me some energy !!
✨We spend hours finding potential opportunities and writing useful ideas, we would be happy if you support us.
Best regards CobraVanguard.💚
SOLUSDT.P trade ideas

SOL/USDT DAILY CANDLESOL/USDT
A bullish trend of daily candles has been ongoing for 13 candles and will end if 5 bearish candles form when the 13 candles are fulfilled.

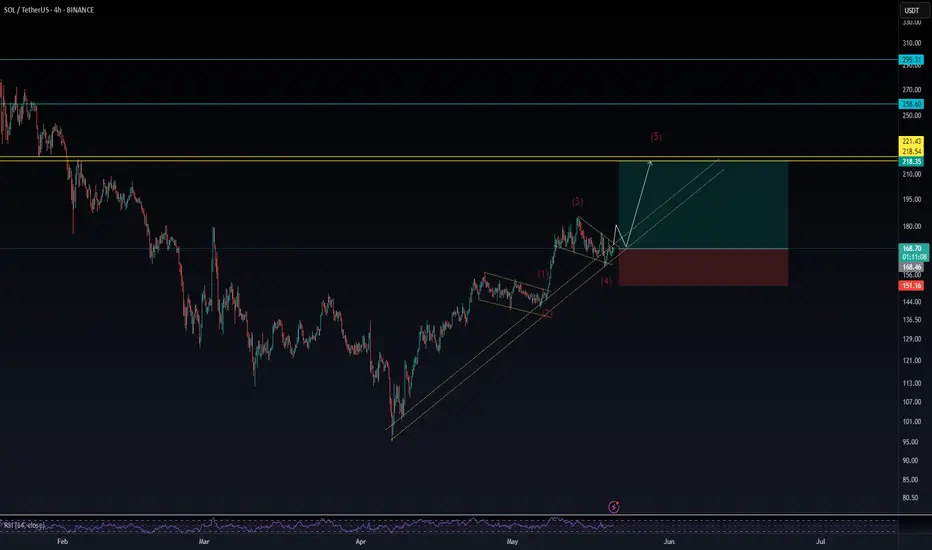
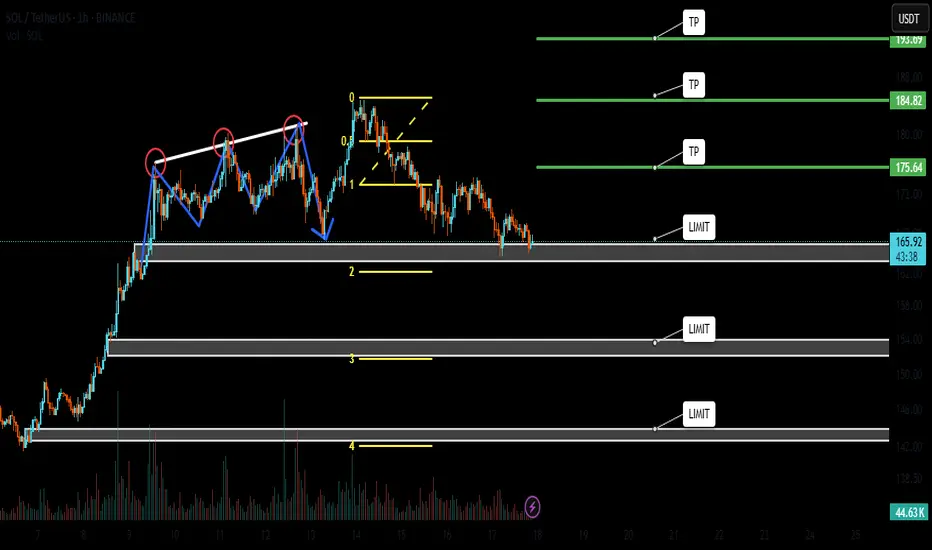
Sol/usdt📊 SOL/USDT Technical Analysis – Daily & 4H Timeframes
After a significant drop from its recent highs, Solana appears to be in a corrective phase. In both the daily and 4-hour charts, price action has formed a short-term bullish structure, indicating buying strength.
📈 Currently, SOL is trading within a rising wedge pattern. A breakout from the wedge could lead to a continuation of the upward move toward the $218–$221 zone, which aligns with the 0.618 Fibonacci retracement and is near the R3 Pivot Point—a key technical confluence zone.
🎯 Trade Plan:
✅ Phase 1 Entry: Initiating a position at current levels with proper risk management.
✅ Phase 2 Entry: Adding on confirmation of wedge breakout.
❌ Stop-loss: Placed below Wave 4 at $151
📌 This analysis reflects my personal trading idea and is shared for educational purposes only. Please manage your own risk accordingly.
SOL Trade Blueprint: Waiting for the High-Conviction EntryAfter printing a SFP at the key high of $180.52 followed by a sharp -8% rejection, SOL made a second attempt to breach the major resistance zone between $180–$185 — but once again, bulls fell short. Since then, price has been in a corrective phase. So the big question is: where’s the next high-probability trade setup? Let’s zoom out and break it down.
📏 Zooming Out: Structure, FVG & Fib Confluence
Back on May 8th, SOL broke through the April 25th swing high at $157 with strong momentum, leaving behind an untested Fair Value Gap (FVG) — a key displacement area that’s yet to be filled. When we draw the Fibonacci retracement from the low of that move to the current high, the 0.618 retracement lands precisely at $157.34 — right on the old breakout high. That’s a beautiful confluence.
Timing-wise, if SOL pulls back to that level between May 21–22, the 0.75 Fib speed fan also kicks in — adding dynamic trendline support to the static Fib level.
📉 What About the $164 Golden Pocket?
There's a golden pocket forming around $164 from a recent mini-impulse, and while it may look tempting, context matters. This pocket isn't supported by enough confluence — no major structure, volume shelf, or EMA alignment. For a quick scalp? Yes. But for a high-conviction swing? It's not ideal.
Remember, in trading we're not here to chase every candle — we're here to wait for the setups that stack the most reasons to say yes.
📍 The Zone to Watch: $157
Now let’s talk about that $157 zone — and why it’s standing out as the highest-probability long setup:
0.618 Fib retracement of the major impulse
Retest of the breakout swing high
Untested Fair Value Gap (FVG)
233 EMA + 233 SMA on the 4H timeframe lining up as dynamic support
1.5 outer pitchfork support line crossing through
1:1 trend-based Fib extension confluence
Prior area of interest
This is what we call a “stacked setup.” The more layers of confluence, the more conviction we have in the trade. Add to that the potential for a liquidity sweep (SFP) just below the current low at $159.44 — and it becomes a zone worth watching closely.
🎯 Long Setup:
Entry: $157–$159.44 (watch for SFP confirmation)
Stop-Loss: Below $154
Target: $200
R:R: Approx. 1:12 — a setup worth being patient for
🧠 Educational Note: Why Confluence Is King
High-probability trades don’t come from guessing. They come from stacking confluence: structure, Fibonacci, moving averages, time-based levels, pitchforks, VWAPs, volume profiles — the more that lines up, the less you need to hope and the more you can trust your edge. Think like a sniper, not a machine gun.
The market rewards patience and precision — not noise and FOMO.
🔻 Short Setup (Alternative Play)
While we’re primarily bullish, there’s a valid short opportunity at the psychological $200 mark — but only if price shows clear rejection and confirmation (e.g. SFP, bearish engulfing, high volume reversal).
Entry: $200 rejection
Stop-Loss: Above $205
Target: $185–$180
R:R: Approx. 1:3+
🔥 Final Words: Trade With Purpose
This is what trading is about — not chasing green candles, but waiting for structure, clarity, and alignment. Whether you’re trading long or short, focus on high-conviction setups backed by logic and levels, not emotion.
Don’t trade for action. Trade for precision. The market will always reward the patient ones who are willing to wait for that clean entry, stacked with reasons to act.
Trust the process, stay disciplined, and let the charts do the talking. 💪📈
___________________________________
If you found this helpful, leave a like and comment below! Got requests for the next technical analysis? Let me know.

SOL LONGSolana is bouncing off the Fibonacci retracement 0.382 level. The bullish trend to 173.12 is expected to continue

Exposing Price Inefficiencies: The Role of Fair Value Gaps (FVG)In the ever-evolving landscape of price action trading, one concept has gained significant traction among institutional and retail traders alike: Fair Value Gaps (FVGs) . At Xuantify, we believe that understanding market inefficiencies is key to anticipating high-probability setups—and FVGs offer just that.
🔍 What Is a Fair Value Gap?
A Fair Value Gap is a price imbalance that occurs when the market moves too quickly in one direction, leaving behind a "gap" in liquidity. This typically happens during high volatility or news-driven events, where price skips over levels without sufficient buying or selling.
In technical terms, an FVG is identified when a candle’s low (in a bullish move) or high (in a bearish move) does not overlap with the previous or next candle. This creates a three-candle structure :
- Bullish FVG : Candle 1 (bearish), Candle 2 (strong bullish), Candle 3 (bullish or neutral)
- Bearish FVG : Candle 1 (bullish), Candle 2 (strong bearish), Candle 3 (bearish or neutral)
These gaps often act as magnets for price , as the market seeks to rebalance and fill the inefficiency.
🧠 Why Do FVGs Matter?
FVGs are not just visual anomalies—they represent institutional footprints . When large orders are executed, they often cause price to move rapidly, leaving behind unfilled orders. Smart money tends to revisit these zones to complete their positions.
Key Benefits of Trading FVGs:
- ✅ High-probability entries: Price often returns to fill the gap before continuing its trend.
- ✅ Clear invalidation levels: The edges of the gap provide natural stop-loss zones.
- ✅ Works across timeframes: From scalping on the 1-minute to swing trading on the daily.
🧩 Using the “Fair Value Gap ” Indicator
To simplify the process of identifying and trading FVGs, we recommend the Fair Value Gap indicator on TradingView. This tool automatically highlights bullish and bearish FVGs, tracks their mitigation, and even provides alerts when gaps are filled.
Key Features:
- Auto-detection of bullish and bearish FVGs
- Mitigation tracking: See which gaps are filled and which remain open
- Threshold filtering: Focus on significant gaps by adjusting the minimum size
- Dynamic mode: Monitor evolving FVGs in real time
- Alerts: Get notified when price fills a gap
💡 No Repainting, No Delays
One of the most reassuring aspects of this indicator is that it does not repaint . Once a fair value gap is printed, it stays on the chart—no disappearing zones, no misleading signals.
Even better, the indicator plots FVGs in real time . It uses a three-candle structure and confirms the gap immediately after the third candle closes . This means you’re seeing valid, actionable gaps as they form—not in hindsight.
This makes the LuxAlgo FVG tool a reliable companion for both live trading and backtesting , giving traders the confidence that what they see is what the market actually delivered.
How to Use It:
1. Add the indicator : Search for “Fair Value Gap ” in the TradingView Indicators tab.
2. Adjust settings :
- Use the “Threshold %” to filter out smaller, less relevant gaps.
- Enable “Mitigation Levels” to track filled gaps.
- Use “Auto Threshold” for adaptive filtering based on volatility.
3. Trade setups :
- Contrarian : Wait for price to fill a gap and look for reversal signals.
- Trend-following : Enter trades in the direction of the gap when it forms.
⚠️ FVGs Are Not Always Honored
While FVGs offer powerful insight into market inefficiencies, it's important to remember: they are not guaranteed reversal or continuation zones . Sometimes price will blow right through a gap without reacting—especially in trending or news-driven markets.
Why this happens:
The gap may have already been mitigated on a lower timeframe
Strong momentum or macroeconomic catalysts override technical zones
The FVG is too small or lacks confluence with other key levels
How to manage this:
Always combine FVGs with structure, liquidity, and volume
Use alerts and confirmations (e.g., candle patterns or BOS/CHOCH)
Avoid trading FVGs in isolation—context is everything
🧠 Best Indicator Combinations with FVG
To increase the accuracy of FVG-based setups, we recommend combining the LuxAlgo FVG indicator with the following tools:
1. Market Structure (LuxAlgo Smart Money Concepts)
Identify breaks of structure (BOS) or change of character (CHOCH) near FVGs. Use structure shifts to confirm whether the FVG is likely to hold or fail.
2. Volume Profile or Session Volume
Confirm FVGs with low-volume nodes or volume gaps . FVGs aligning with volume imbalances are more likely to be respected.
3. Order Blocks
Look for FVGs that overlap with bullish or bearish order blocks . This confluence often signals institutional accumulation or distribution.
4. Relative Strength Index (RSI) or Stochastic
Use momentum indicators to confirm exhaustion or continuation near FVGs. For example, a bullish FVG + oversold RSI = potential long setup.
5. Liquidity Zones (Equal Highs/Lows, Swing Points)
FVGs near liquidity pools are often targeted before reversal. Combine with sweep setups for sniper entries.
Here’s a new section you can add to your blog post, focusing on the power of **Multi-Timeframe (MTF) FVG Alignments**:
🧭 Multi-Timeframe FVG Alignments
One of the most powerful ways to increase the reliability of Fair Value Gaps is by using multi-timeframe confluence . When FVGs align across different timeframes—say, a 1H FVG inside a 4H FVG zone—it often signals a high-probability reaction area .
Why it works:
Higher timeframe FVGs represent broader institutional imbalances
Lower timeframe FVGs offer precise entries within those zones
Alignment confirms that multiple layers of market participants are active in the same area
How to use it:
Start with a higher timeframe (e.g., 4H or Daily) and mark key FVGs
Drop to a lower timeframe (e.g., 15M or 1H) and look for fresh FVGs forming inside the higher zone
Wait for structure shifts or liquidity sweeps within the lower timeframe FVG before entering
This technique is especially effective when combined with tools like LuxAlgo Smart Money Concepts and Volume Profile , helping you time entries with sniper-like precision while staying aligned with the broader market narrative.
📊 Backtest It Yourself
FVGs are best understood through chart time . Load up your favorite pair on TradingView, activate the LuxAlgo FVG indicator, and observe how price reacts. You’ll be surprised how often these zones act as support, resistance, or launchpads for major moves.
🚀 Final Thoughts
Fair Value Gaps are more than just a buzzword—they’re a window into how smart money operates. By incorporating FVGs and tools like the LuxAlgo indicator , you gain a deeper understanding of market dynamics and a sharper edge in execution.
At Xuantify, we’re committed to decoding institutional logic and bringing it to the retail trader. Stay tuned for more insights, and as always— trade smart, not hard .
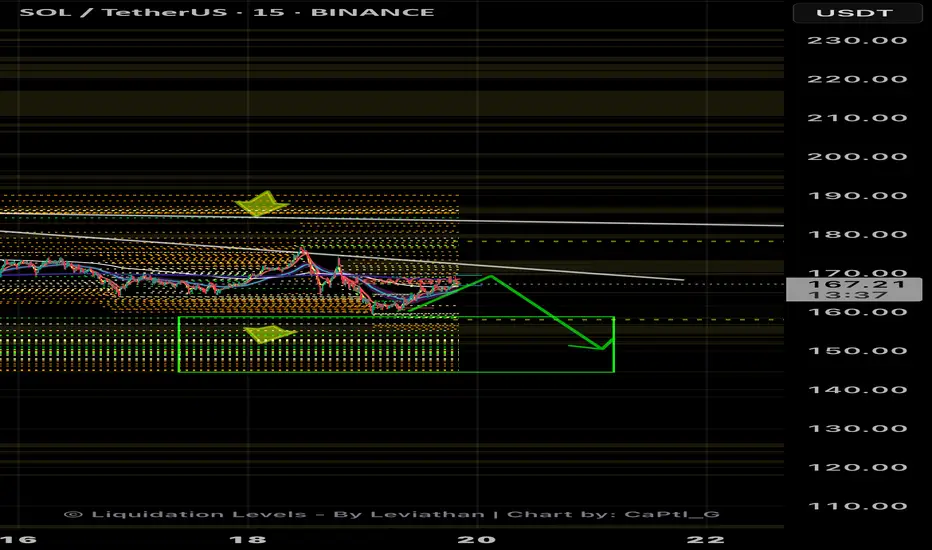
SOL range low sweep before chasing HIGHSWe continue to see the liquidity grow at the $180 price range but leveraged long traders are pouring into this chart.
My idea for SOL for the next few days is going to be a continuation to ~$150’s and an extremely manipulative move to the upside.
Invalidation is a break/retest/continue of the down trend on the daily
SOL/USDT – Bearish Setup DevelopingSolana has broken its dynamic support and is currently in a pullback toward the broken support zone on the 4H timeframe.
This move confirms weakness, and we're watching closely for rejection signals to validate the short setup.
As long as the broken structure holds, the bias remains bearish.
🧠 Stay patient — let price complete the pullback before reacting.

sol sell midterm"🌟 Welcome to Golden Candle! 🌟
We're a team of 📈 passionate traders 📉 who love sharing our 🔍 technical analysis insights 🔎 with the TradingView community. 🌎
Our goal is to provide 💡 valuable perspectives 💡 on market trends and patterns, but 🚫 please note that our analyses are not intended as buy or sell recommendations. 🚫
Instead, they reflect our own 💭 personal attitudes and thoughts. 💭
Follow along and 📚 learn 📚 from our analyses! 📊💡"

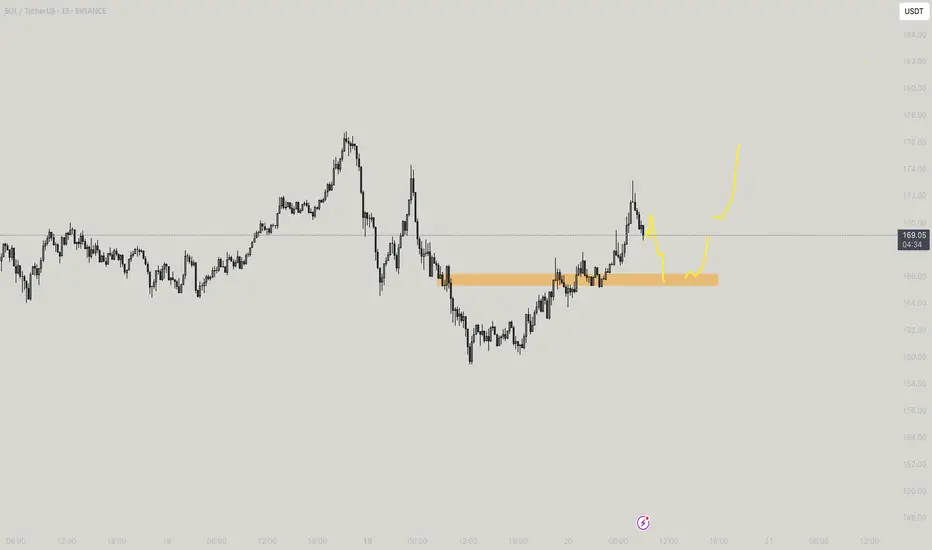
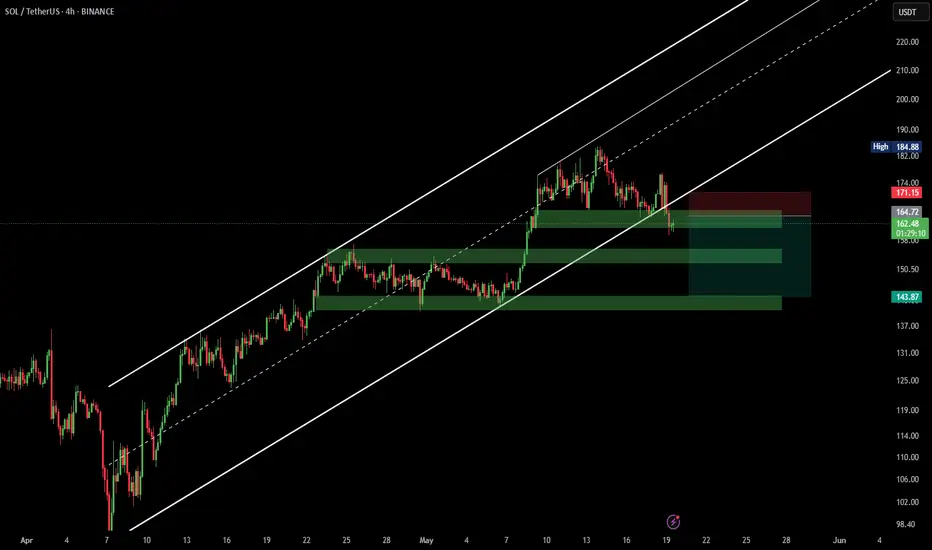
HolderStat┆SOLUSD 165 retest could launch 195-200CRYPTOCAP:SOL escaped a falling channel in April and has since respected a well-behaved growing channel. After tagging 180 USDT resistance, price is backing into the channel heart around 170 with potential for a classic 165 support retest. A bounce there would position bulls to challenge the 180 lid again and potentially sprint toward the channel extension at 195-200 USDT. Breakdown below 160 would mark the first technical warning of fatigue.
#SOL/USDT#SOL
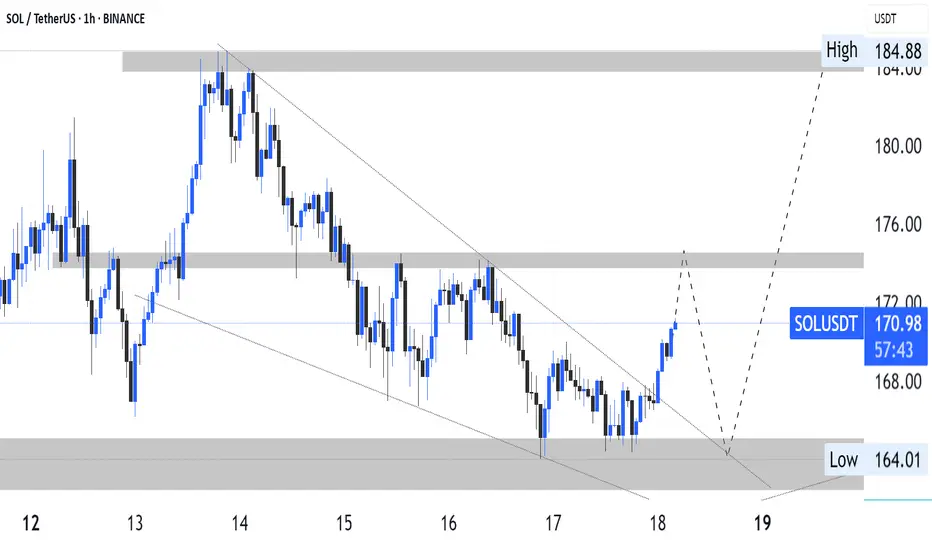
The price is moving within a descending channel on the 1-hour frame, adhering well to it, and is heading for a strong breakout and retest.
We are seeing a rebound from the lower boundary of the descending channel, which is support at 158.
We have a downtrend on the RSI indicator that is about to be broken and retested, supporting the upward trend.
We are looking for stability above the 100 moving average.
Entry price: 161.70
First target: 164
Second target: 168
Third target: 173

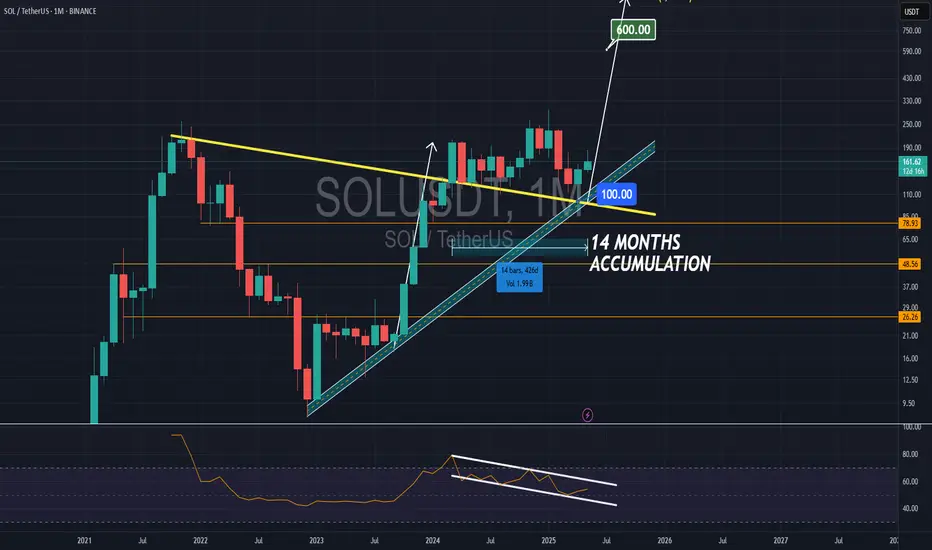
SOLANA 14Months AccumulationSOLANA had a rally from $20 to $190 , and now for 14 Months is accumulating above the strong support at $100.
As the RSI ON Monthly is playing inside a falling channel, upside movement for SOL in the coming months to about $600 is very likely IMO.
Solana has unfinished business up, 192.5 is nextGap still not filled there, likely up to there, then down to 149 zone before continue the bullrun with BTC

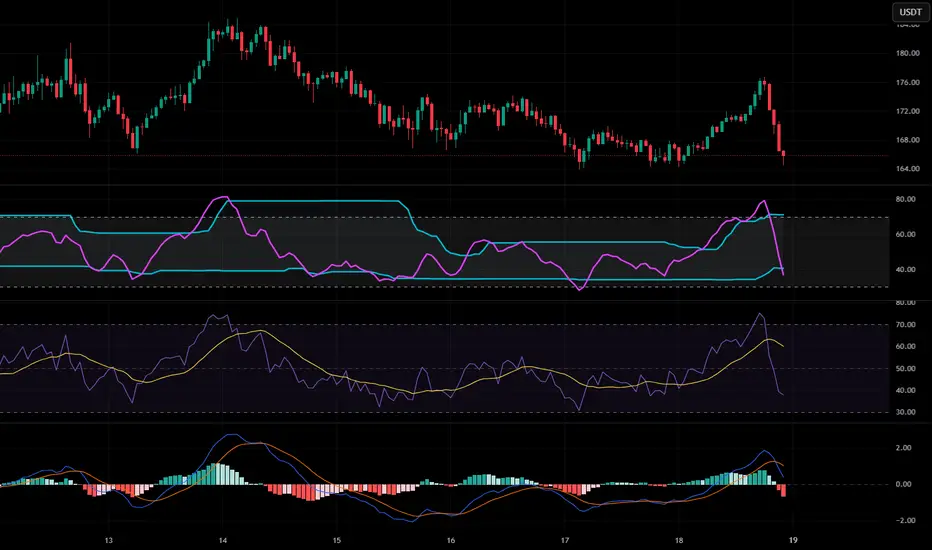
Unlocking Market Cycles with the RSI Cyclic Smoothed IndicatorIntro
In the world of technical analysis, the Relative Strength Index (RSI) is established. However, the RSI Cyclic Smoothed indicator takes this classic tool to the next level by incorporating cyclic smoothing and dynamic bands. This post will explore the features, configuration, and practical applications of this powerful indicator.
What is the RSI Cyclic Smoothed Indicator ?
The RSI Cyclic Smoothed indicator is an advanced version of the traditional RSI. It enhances the classic RSI by adding cyclic smoothing and cyclic memory, allowing it to better adapt to market cycles and provide more accurate signals.
Dynamic Bands
One of the standout features of the RSI Cyclic Smoothed indicator is its dynamic bands. These bands adjust automatically to the asset’s cyclical levels, providing clearer signals in varying market conditions. The adaptive upper and lower bands help traders avoid whipsaw trades and identify overbought and oversold conditions more effectively.
What kind of indicator is it ?
The RSI Cyclic Smoothed indicator falls into the category of oscillators. Oscillators are technical analysis tools that vary over time within a banded range, typically used to identify overbought and oversold conditions.
Leading or Lagging ?
The RSI Cyclic Smoothed indicator is primarily a lagging indicator. It smooths the RSI data to reduce noise and provide more reliable signals, but it does not predict future price movements.
Key Features
Cyclic Smoothing: Reduces noise and enhances signal accuracy.
Dynamic Bands: Adaptive upper and lower bands that adjust to market cycles.
Cyclic Memory: Uses the dominant cycle length to optimize signal accuracy.
Benefits Compared to Normal RSI
Enhanced Signal Accuracy: The cyclic smoothing reduces noise and false signals, providing more reliable trading signals.
Adaptability to Market Cycles: The cyclic memory allows the indicator to adapt to the dominant market cycle, making it more responsive to cyclical changes.
Dynamic Bands: Unlike the fixed levels in normal RSI, the dynamic bands adjust to market conditions, offering better identification of overbought and oversold levels.
Reduced Whipsaw Trades: The smoothing process helps avoid the frequent false signals that can occur with the normal RSI, especially in volatile markets.
Indicator Configuration
Configuring the RSI Cyclic Smoothed indicator involves setting the dominant cycle length and adjusting the smoothing parameters. The key parameters include:
Dominant Cycle Length: Defines the duration of the dominant market cycle.
Smoothing Factor: Reduces fluctuations and noise.
Cyclic Memory: Stores the indicator’s history to calculate dynamic reference levels.
Ideal settings vary based on market conditions, but a common approach is to start with a dominant cycle length that matches the asset’s typical cycle and adjust the smoothing factor to balance responsiveness and noise reduction.
Enhancing Signal Accuracy with a Trend Indicator
To enhance the accuracy of signals generated by the RSI Cyclic Smoothed indicator, it can be used in conjunction with trend indicators. Examples of trend indicators include:
Moving Averages: Simple Moving Average (SMA) and Exponential Moving Average (EMA) are widely used to identify trend direction.
MACD: Moving Average Convergence Divergence helps reveal both direction and underlying momentum.
ADX: Average Directional Index measures the strength of a trend.
Combining these tools helps confirm signals and reduce false positives.
MTF Chart Setup
Below is an example chart showcasing the RSI Cyclic Smoothed indicator in action. The chart highlights trading signals where the signal line crosses above or below the adaptive bands, providing clear entry and exit points. Below are the 1H, 2H and 4H overbought aligned.
Alternatives
While the RSI Cyclic Smoothed indicator is powerful, there are other alternatives that also focus on overbought and oversold conditions:
Stochastic Oscillator: This indicator measures the level of the closing price relative to the range of prices over a certain period. It identifies overbought and oversold conditions with key levels below 20 (oversold) and above 80 (overbought).
Williams %R: Similar to the Stochastic Oscillator, Williams %R compares the closing price to the high-low range over a specified period. It indicates overbought conditions above -20 and oversold conditions below -80.
CCI (Commodity Channel Index): The CCI measures the deviation of the price from its average price over a given period. It identifies overbought conditions above +100 and oversold conditions below -100.
Bollinger Bands: While not an oscillator, Bollinger Bands can be used to identify overbought and oversold conditions when the price touches the upper or lower band.
Additional Insights
The RSI Cyclic Smoothed indicator is highly responsive to market moves and can be fine-tuned to match the dominant cycle of the asset being analysed. For more in-depth information, refer to Chapter 4 of "Decoding the Hidden Market Rhythm, Part 1".
Practical Tips
Combine with Trend Indicators: Use the RSI Cyclic Smoothed indicator alongside trend indicators to confirm signals.
Adjust Cyclic Parameters: Fine-tune the cyclic parameters to match the market conditions and dominant cycle.
Monitor Dynamic Bands: Pay close attention to the adaptive bands for overbought and oversold signals.
Backtest Thoroughly: Before using the indicator in live trading, backtest it on historical data to understand its performance and adjust settings accordingly.
Stay Updated: Market conditions change, so periodically review and adjust the indicator settings to ensure they remain optimal.
Which Securities Does This Apply For?
The RSI Cyclic Smoothed indicator can be applied to a wide range of securities, including: Stocks: Useful for identifying cyclical patterns and overbought/oversold conditions in individual stocks. ETFs: Effective for analyzing exchange-traded funds, especially those tracking cyclical sectors. Forex: Valuable for currency pairs, helping traders identify market cycles and potential reversals. Commodities: Applicable to commodities like gold, oil, and agricultural products, where cyclical movements are common. Cryptocurrencies: Can be used to analyze digital assets, providing insights into cyclical trends and volatility.
Conclusion
The RSI Cyclic Smoothed indicator is a powerful tool for traders looking to enhance their technical analysis. By incorporating cyclic smoothing and dynamic bands, it provides clearer and more accurate signals, helping traders navigate complex market cycles.
SOL/USDT LONGBINANCE:SOLUSDT.P
Entry 66
SL 163.5
TGT 180
It can form a W pattern and give a big target
Remember we only follow risk reward ratio which is usually 1:6

SOLANA BUYLIMITHello friends
Considering the good growth we had, you can see that the price has made a small correction after reaching its ceiling and has entered a range.
Now, with the price correction, there is a good opportunity to buy in stages and with capital management and move towards the specified goals.
*Trade safely with us*
Solusdt forming bearish h&s patternIf the price closes below 167.2 on the 1-hour timeframe, the pattern may activate.
The entry area is between 167.2 and 174.42.
The target prices are 163, 158, and 152.
The pattern is invalidated if the price closes above the previous swing high (right shoulder) at 174.42."

SOLUSD OUT LOOKSOLUSD broke out of falling wedge in 1hr time frame. Meanwhile, it portrays a strong bullish bias. nice buy opportunity is possible if the analyzed scenario unfolds .
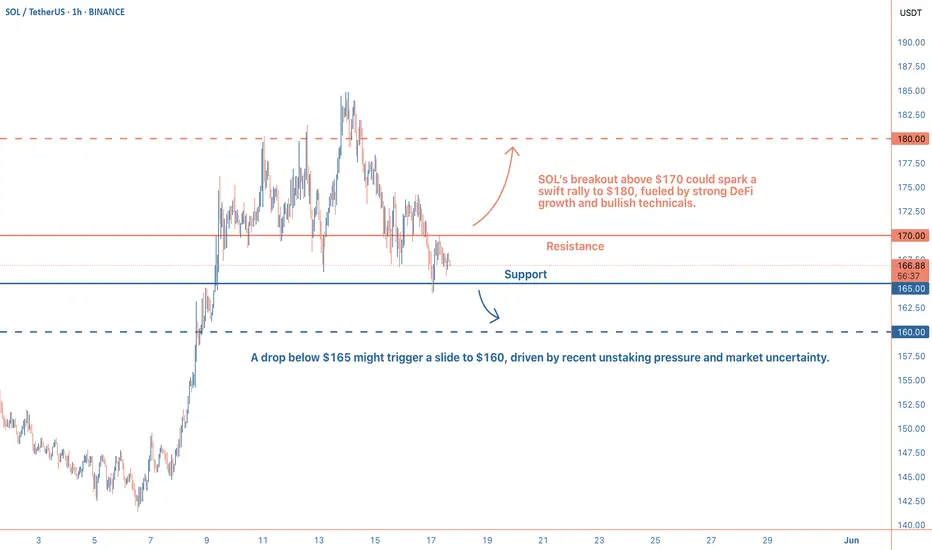
Poised for a Breakout at $168?Solana is currently trading around $168, showing a period of consolidation after some recent volatility. The price has been hovering in a tight range over the past few hours, which often signals that a bigger move could be on the horizon. With the broader crypto market showing mixed signals, SOL’s ability to hold this level suggests it’s gathering strength, but traders should stay alert for a breakout.
Recent News:
Solana’s ecosystem has been buzzing lately, with its decentralized finance (DeFi) sector showing solid growth, total value locked (TVL) recently jumped from $7.5 billion to $9.6 billion as of May 2025. This uptick reflects growing confidence in the network’s high-speed, low-cost transactions. On the flip side, over 1.4 million SOL tokens were unstaked in the past week, adding some selling pressure.
Meanwhile, Bitcoin’s stability above $100,000 provides a supportive backdrop for altcoins like SOL, though any sudden market shifts could sway the momentum.
Technical Analysis:
Solana is sitting just above the 50-hour moving average at $165, which is acting as a short-term support. The 200-hour moving average at $160 offers a stronger safety net below. As long as the price stays above $165, the short-term trend leans bullish.
A bullish flag pattern seems to be forming, hinting at a potential upward breakout. If SOL pushes past the $170 resistance, it could aim for $180 next.
The RSI is at 55, showing neutral momentum with room to climb before hitting overbought territory. The MACD is teasing a bullish crossover, which could confirm stronger upward pressure if it completes.
Watch $165 as key support, with $170 as the immediate resistance. A break above $170 opens the door to $180, while a drop below $165 might test $160.
SOL is at a pivotal moment on this 1-hour chart. Positive network developments and a stable broader market give it a bullish edge, but the recent unstaking adds a layer of caution. If the price clears $170, a run to $180 looks likely, especially with technical indicators tilting upward. However, a failure to break resistance could see it retest $165 or lower. Traders should keep an eye on volume and the $170 level—any surge there could signal the next big move!
SOL/USDT Technical Analysis (Daily Timeframe) – 17th May 2025In today’s technical outlook, we observe a bullish reversal pattern on the SOL/USDT daily chart — the Inverse Head and Shoulders. This classical formation suggests a strong potential for an upward trend continuation, especially after breaking above the neckline.
🔸 Pattern Identified: Inverse Head and Shoulders
🔸 Entry Point: 167.77 USDT – near the neckline breakout, confirming bullish sentiment
🔸 Stop Loss: 139.69 USDT – placed below the right shoulder for prudent risk control
🔸 Take Profit Targets:
• TP1: 208.26 USDT – aligns with previous resistance zone
• TP2: 252.47 USDT – a projected target based on the measured move from the neckline
📉 RSI Divergence Indicator currently sits at 58.59, indicating moderate bullish momentum. Several bullish divergences observed in March and April supported upward movement, while the recent minor bearish divergence warns of possible short-term consolidation before continuation.
The chart shows a clear neckline breakout with strong upward trajectory, validating the bullish structure. Entry at this level offers a favorable risk-to-reward ratio for swing traders targeting mid- to long-term price appreciation.
📌 Strategy Summary:
This setup provides an opportunity to enter on confirmed breakout with tight risk control and clear upside targets. Traders may consider entering near 167.77, with a stop loss at 139.69 and taking profits progressively at 208 and 252 levels.
📅 Analysis By: Musarrat
🗓️ Date: 17th May, 2025
