TradeCityPro | SOL: Key Retest at Support Before Next Breakout👋 Welcome to TradeCity Pro!
In this analysis, I’m going to review the SOL coin—one of the most requested assets and a very popular project in the crypto space.
✔️ This coin holds a market cap of $3.61 billion and is ranked 6th on CoinMarketCap.
⏳ 4-Hour Timeframe
As you can see, a bullish leg started from the 142.25 support and extended up to the 177.51 resistance.
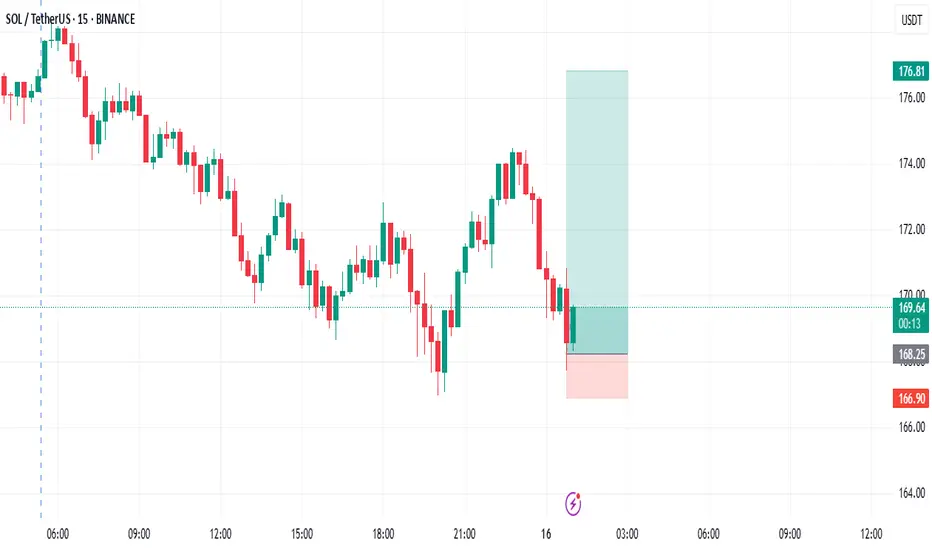
🔍 Currently, after a fake breakout of 177.51 and a rejection from 183.86, the price has dropped back below 177.51 and formed a support level around 166.82.
📈 So far, the price has tested the 166.82 level twice and shown a strong bullish reaction. Recently, a powerful support candle has formed at this level, suggesting it’s being defended.
💥 If the price can move back toward the upper levels, a breakout of either 177.51 or 183.86 would provide a long entry trigger. If a higher low and higher high form before the breakout of 177.51, the trigger becomes even more reliable.
📊 Market volume has declined since the upward move ended. If volume increases as price rises again, it would provide a volume confirmation.
🔽 For a short position, the 166.82 level serves as a valid trigger. In my view, it’s a strong enough level to justify opening a short. The next major support below lies at 142.25.
❌ Disclaimer ❌
Trading futures is highly risky and dangerous. If you're not an expert, these triggers may not be suitable for you. You should first learn risk and capital management. You can also use the educational content from this channel.
Finally, these triggers reflect my personal opinions on price action, and the market may move completely against this analysis. So, do your own research before opening any position.
SOLUSDT.PS trade ideas

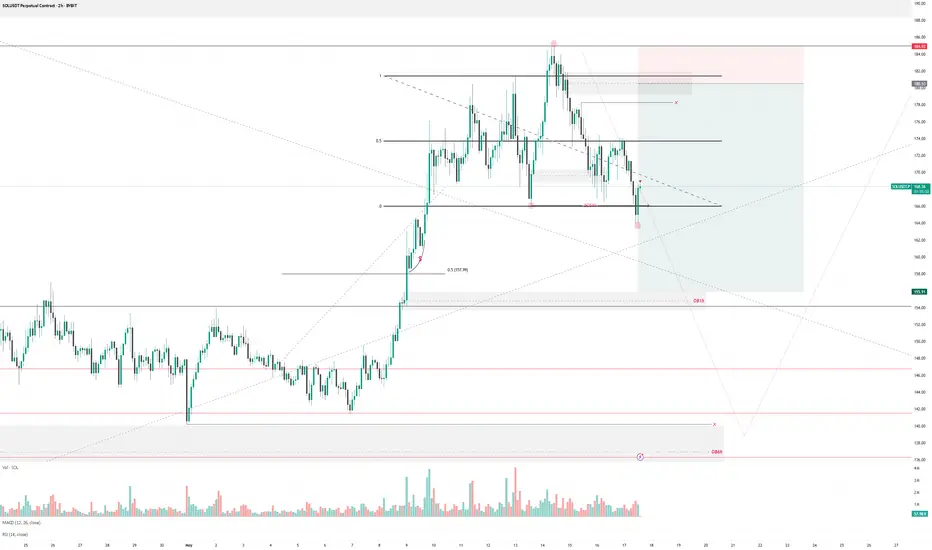
Quasimodo on 4hPrice arrived to POI of HTF. We can see a formation of BOS on 4h as part of Quasimodo. Mark short position with entry from the 2hOB to new low to the OB in 0.5 of correction of the last impulse. Stop behind first deviation.
2025.05.17 SOLANA Short-term long positionWe are the SeoVereign Trading Team.
With sharp insight and precise analysis, we regularly share trading ideas on Bitcoin and other major assets—always guided by structure, sentiment, and momentum.
🔔 Follow us to never miss a market update.
Long Position Strategy Proposal
Entry: At market price
Stop-loss: 167.80
Target 1: 173.34
Target 2: 175.89
Target 3: 177.97
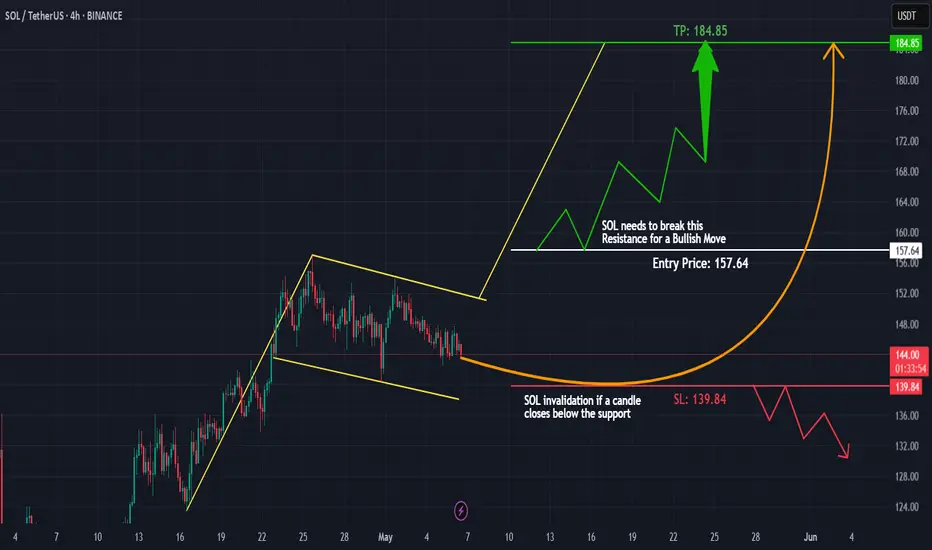
This strategy is based on the Elliott Wave Theory and assumes a continued bullish trend. Currently, Solana appears to be in the early phase of the 5th wave, following the completion of an extended 3rd wave and a corrective 4th wave.
The 3rd wave extended approximately 2.618 times the length of the 1st wave, which is characteristic of a strong bullish move.
The 5th wave typically mirrors the length of the 1st wave with a 1:1 ratio.

Skeptic | Solana’s Uptrend Ignites: Big Moves Ahead?Hey everyone, Skeptic here! Let’s kick off this Friday morning with a deep dive into Solana , one of my favorite coins! 😊 In this analysis, I’m breaking down the charts, spotting spot and futures triggers, and exploring what’s next for SOL. Stick with me to the end, and we’ll grow together! <3 Let’s start with the Daily Timeframe. 📊
Daily Timeframe: The Big Picture
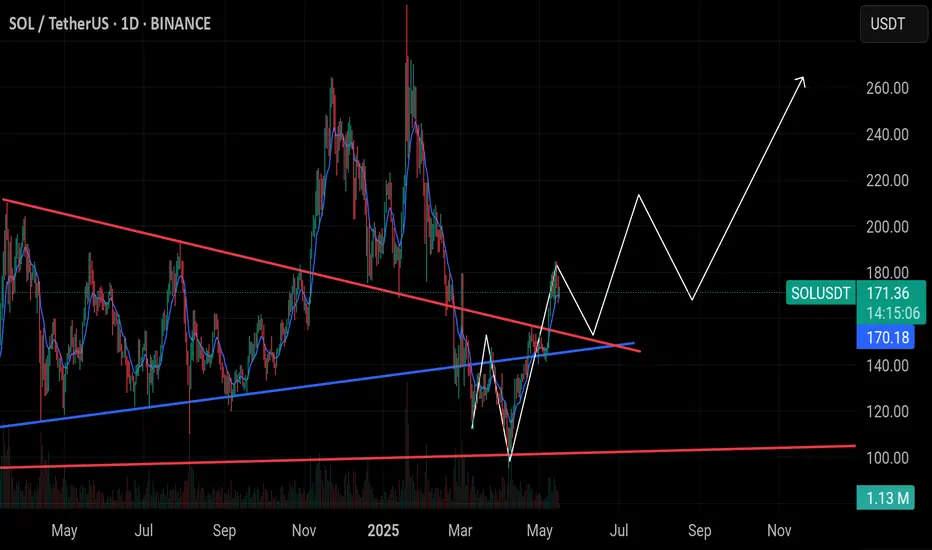
We’re riding a solid upward channel on Solana’s daily chart. The price has reacted beautifully to the ceiling, floor, and especially the midline, which gives this channel a ton of credibility—we can trust it. After a strong price surge starting October 20 and running through January 25 , we entered a price correction. I expected a pullback to 80.78 , but we corrected to 95.15 instead. Now, we’ve formed a head and shoulders pattern, and the neckline has broken, activating the pattern. This pattern, at the end of a correction, signals a trend reversal and a continuation of the major uptrend. The target for this pattern is the height from the head to the neckline, which takes us to 202.82 —coincidentally, a key resistance level ahead. I expect we might range around that level or, if we break it, it’ll likely be a sharp and messy move. So, plan ahead to avoid FOMO or making rash moves. Our spot entry was at 151.78 , but a break above 202.82 could be another solid trigger, with a stop loss below the support at 147.97 . Don’t FOMO —wait for confirmations from SOL/BTC and Bitcoin’s action. Volume is your friend for spotting momentum, so keep a close eye on it. Let’s zoom into the 4-Hour Timeframe for long and short triggers.
4-Hour Timeframe: Long & Short Setups
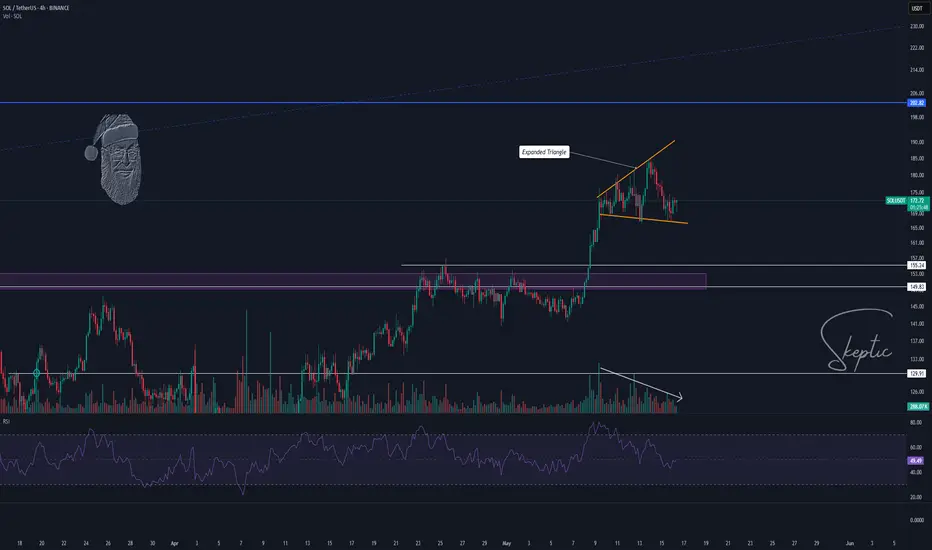
After breaking the 153.29 resistance, we saw a nice rally, but then we hit some turbulence. If you look closely, the market seems to have formed a symmetrical triangle—the worst pattern for breakout and momentum-based strategies. Why? The market doesn’t care about support or resistance here, making it tough to tell if moves are fake or real. So, what’s the plan?
Let’s drop to the 1-Hour Timeframe.
The last level we got rejected from was 174.51 . If we revisit this level with rising volume and candles showing buyer strength—think good lower shadows and strong green bodies with high closes—it means sellers pushed the price down, but buyers stepped in and drove it back up. If you see this setup and we break the 174.51 resistance, you can open a long position. For shorts, since the major and secondary trends are uptrends, I’m not giving any short triggers—it’s completely against the trend, and the risk of hitting a stop loss is way too high. Be patient. Wait for this uptrend to fake out and drop below 149.07 —then we’ll hunt for shorts. 🙂 Let’s also take a quick look at SOL/BTC.
SOL/BTC Analysis
On the daily timeframe, we’ve got a clean head and shoulders pattern for SOL/BTC, with the neckline broken and a pullback to it now. This could lead to a strong rally moving forward, provided it’s not a fakeout and we don’t fall back below the support at 0.0015043. What does this mean? If the market stays in an uptrend, Solana could outperform Bitcoin. And if BTC.D is dropping during a market rally, Solana could see some serious growth. That’s the Solana breakdown! If you’ve got your own technical or fundamental analysis on this coin, I’d love to hear it—drop it in the comments so we can grow together! 😄
💬 Let’s Talk!
If this analysis helped you out, give it a quick boost —it means a lot! 😊 Got a pair or setup you want me to tackle next? Drop it in the comments, and I’ll get to it. Thanks for hanging out, and I’ll see you in the next one. Keep trading smart! ✌️
$SOL Breakout & Retest SetupCRYPTOCAP:SOL Breakout & Retest Setup
SOL has broken out of a long-term descending trendline (red) and is currently trading at $171.49. The price has also reclaimed the ascending support trendline (blue), suggesting strong bullish momentum.
🔸 Key Support Zone at $150–$160:
This area aligns with a potential retest of the broken trendline and ascending support confluence. A successful retest here would confirm the breakout and offer a strong entry zone.
🔸 Upside Target: $250+
Once the retest confirms support and buyers step in, SOL could begin a strong upward move toward $200, with $250+ as a mid-term target.
🔸 Risk Level at $140:
A daily close below $140 would invalidate this bullish structure and shift the bias to bearish.
🔸 Action Plan:
Monitor for a pullback toward $150–$160
Look for bullish confirmation (wicks, volume, bullish engulfing) before entering
First major resistance around $200, followed by $225–$250
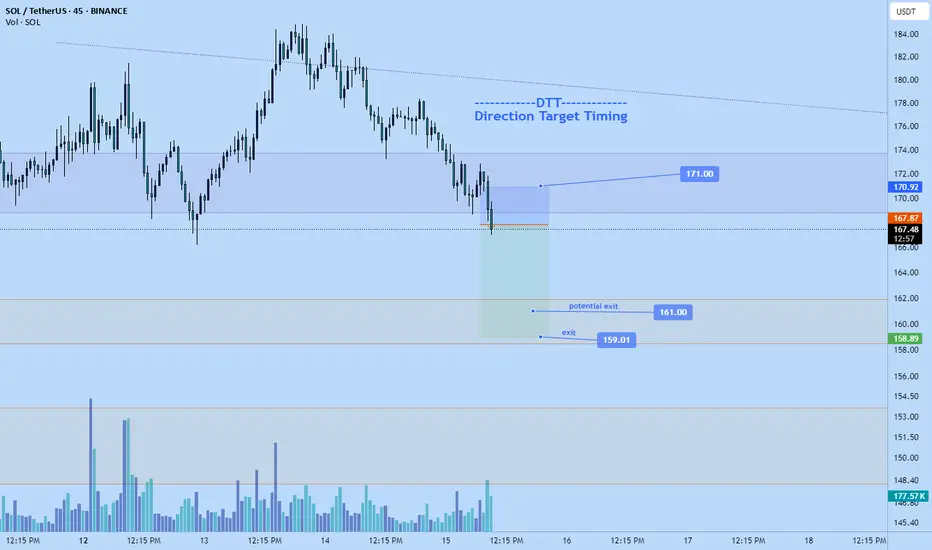
Solana short back to $159 todayJut now opened a short position on solana.
Targeting $159
Potential early close at $161
Stop: $171 or higher
Time sensitive
Solana (SOL) Cup & Handle (1W Log)BINANCE:SOLUSDT has formed a Cup & Handle pattern on the weekly chart, and arguably already broke out of the handle.
The measured move target based on the linear depth of the cup is ~$510.
Key Levels to Watch
• ~$100: Local low and 0.618 Fib of the cup depth, a typical handle retracement in a Cup & Handle pattern.
• $260: Cup & Handle neckline and key horizontal resistance. A decisive weekly close with strong volume above this level would confirm the pattern and activate the measured move target.
• $510: Measured move target based on the depth of the cup from the neckline.
Considerations
Volume confirmation remains key. A breakout above $260 with strong volume could validate the pattern and open the path to $510.

Its Solana summer time, SOL will outperform bitcoinBitcoin going to 114k zone then heading back to 96500, will fit this

Solana Faces Rejection at $180 Resistance — Eyes on $125 SupportSolana (SOL) recently showed a potential deviation at the key resistance level of $180, signaling a possible rotation lower toward significant support near $125.
Solana’s price action around the $180 level is critical in determining its short to medium-term direction. Recently, price candles closed above $180 but quickly reversed with the next candle closing back below this level, confirming a deviation-type rejection at this key resistance. This inability to hold above $180 suggests that sellers are defending this level, increasing the likelihood of a pullback.
If Solana fails to reclaim $180 decisively, the probability of a rotation toward the $125 support zone rises. This $125 level is significant as it represents a major support region on the macro daily trend, often acting as a technical high or low. A retracement to this zone would likely be considered bullish selling—a corrective dip before another potential leg higher.
Furthermore, the 200-day moving average is an important metric to watch. A break below this moving average could accelerate the downward momentum, making the move toward $125 more probable. Until then, Solana is still battling resistance and has yet to confirm a clear directional bias.

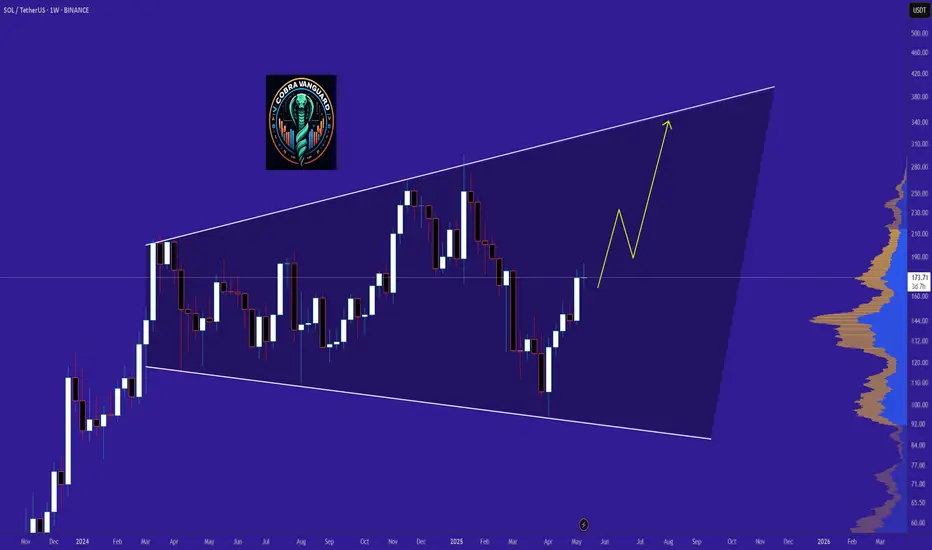
Nothing !!!The SOL will increase $150 and reach to the top of the wedge in the coming weeks .
Give me some energy !!
✨We spend hours finding potential opportunities and writing useful ideas, we would be happy if you support us.
Best regards CobraVanguard.💚
SOL / USDT - Perhaps First SHORT and then LONG opportunityLooking at the 1D chart, we see that a flag pattern has formed, but it looks like there could be another correction before the 3 upper limit tests and a breakout.
Short now, Long later when it bounces. We'll see..

HolderStat┆SOLUSD 180 $ flip, 200 $ nextSolana price escaped April’s consolidation box, flipped the old down‑sloping resistance into a rising support line, and is now pressing the 180 $ ceiling inside a well‑defined growing channel. A decisive daily close above 180 transforms that barrier into a launch pad, opening the measured channel extension toward 200‑205 $. Channel lows near 150 remain key invalidation for the bullish momentum.
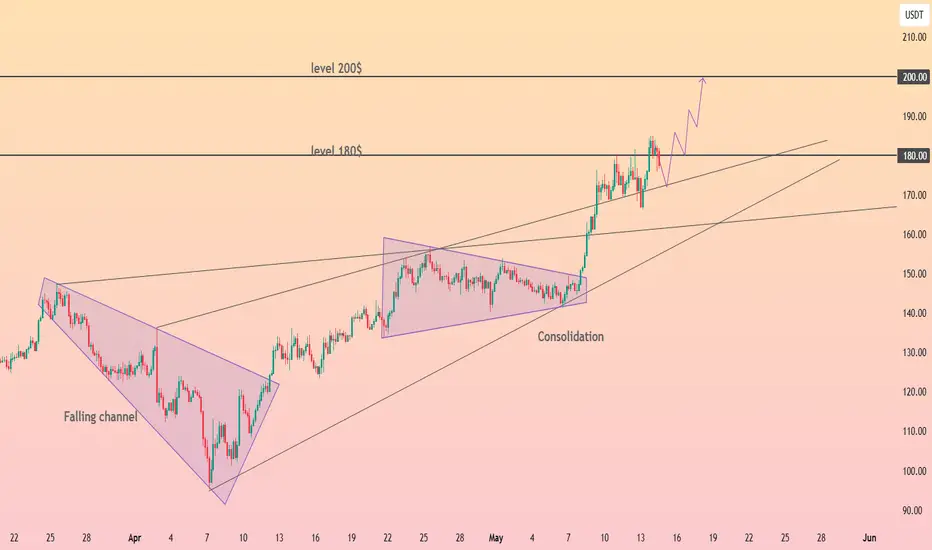
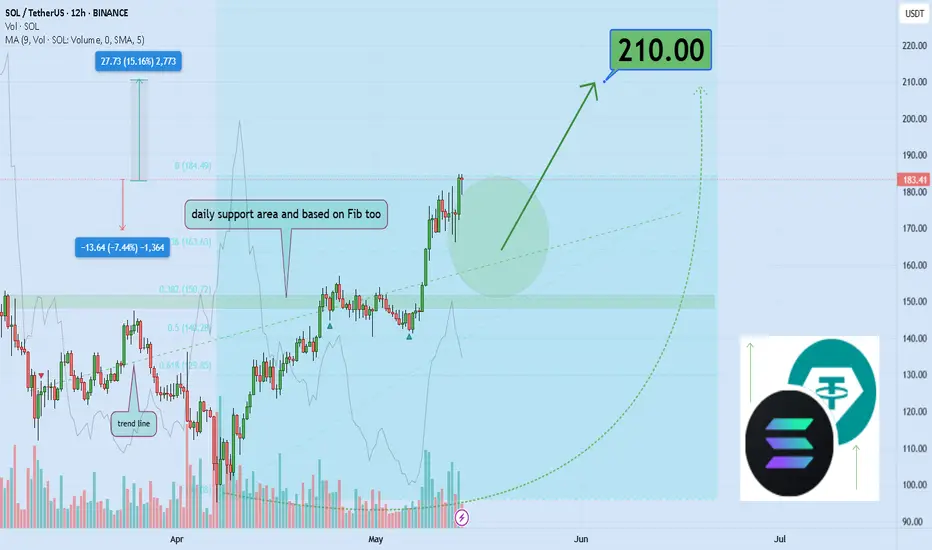
Could SOL Break $200 and Fly 15% Higher Soon?Hello and greetings to all the crypto enthusiasts, ✌
All previous targets were nailed ✅! Now, let’s dive into a full analysis of the upcoming price potential for Solana 🔍📈.
Solana has finally broken out 🚀 — signaling the potential start of a strong bullish leg. With solid confluence between the daily support, Fibonacci retracement, and a well-respected monthly trendline, I’m eyeing a move toward the $210 leve l. A clean break above the key psychological resistance at $200 could confirm this setup. Stay alert — SOL is showing real strength 🔍.
🧨 Our team's main opinion is: 🧨
Solana has kicked off a strong move, and I’m targeting a 15% upside with a main target at $210, once the key $200 psychological level breaks with momentum 🚀.
Give me some energy !!
✨We invest hours crafting valuable ideas, and your support means everything—feel free to ask questions in the comments! 😊💬
Cheers, Mad Whale. 🐋
Solana start a bearish trend in 1h tf!According to macd in 1h and 4h tf we expect a strong bearish trend.

SOL SCALP SetupSOl can retrace to 175$ on ltf, must use sl before taking any trade. Market is too volatile now
Full elliot count 360$ next targetHello traders! I Think something like this can play. The wave 5 is not finished by maybe we are close to make it, like 190-200$ sounds right. I spect a correction for summer and a big rally until december.

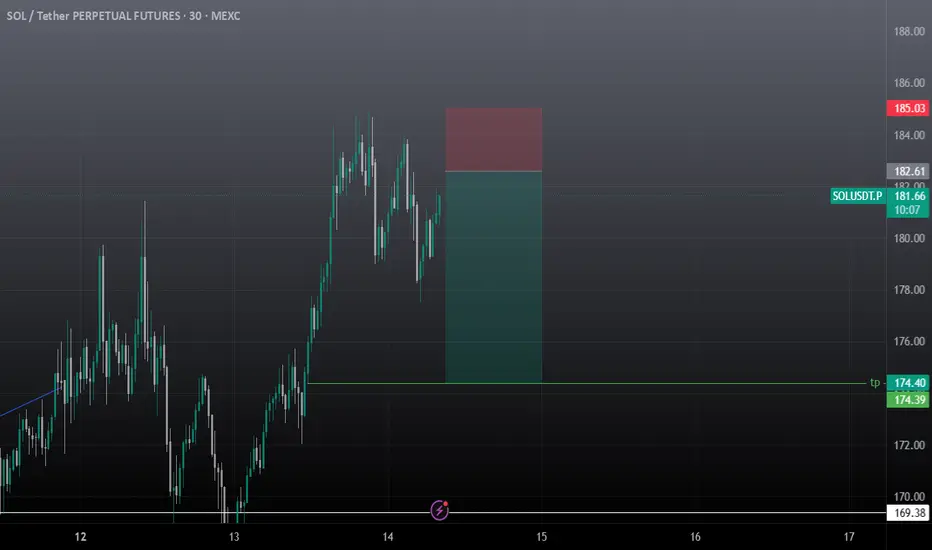
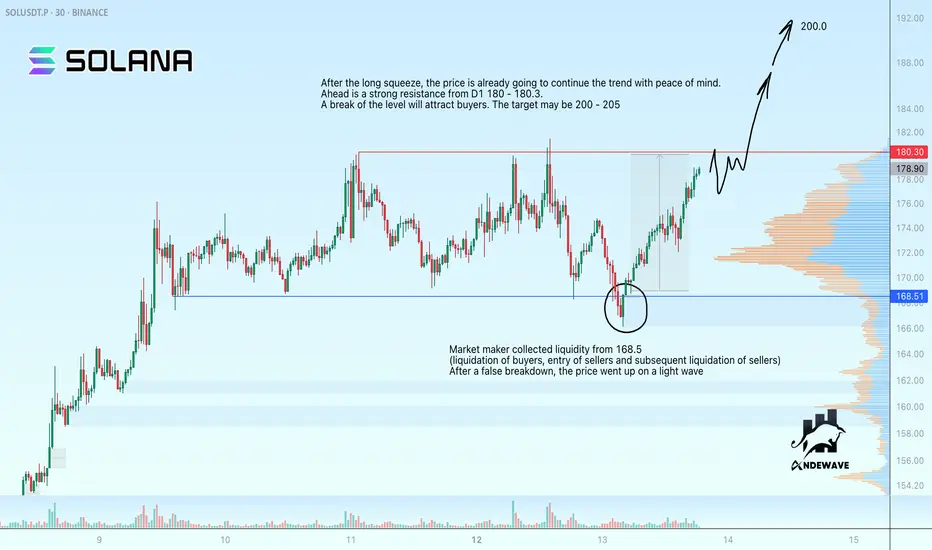
SOLUSDT may rise to 200.0 after long-squeezeMarket maker collected liquidity from 168.5 (liquidation of buyers, entry of sellers and subsequent liquidation of sellers)
After a false breakdown the price went up on a light wave
After the long squeeze, the price is already going to continue the trend with peace of mind.
Ahead is a strong resistance from D1 180 - 180.3.
A break of the level will attract buyers. The target may be 200 - 205
Scenario: a retest of the resistance may end in a small correction. If there is no reversal and the price continues to test 180-180.3, we can expect a breakout, which may attract buyers and further growth to 200 - 205.
Solana Builds Bullish Case – Targeting $170 With 17% UpsideHello and greetings to all the crypto enthusiasts, ✌
All previous targets were nailed ✅! Now, let’s dive into a full analysis of the upcoming price potential for Solana 🔍📈.
Solana is showing strong accumulation within a tight range, with increasing volume suggesting strategic positioning by larger players. Price action is approaching a critical support zone, adding confluence to the bullish bias. A potential upside of at least 17% is in play, with the primary target set at $170. 📈
🧨 Our team's main opinion is: 🧨
Solana is consolidating near key support with strong whale activity—looking for at least **17% upside** toward the **\$170** target. 🚀
Give me some energy !!
✨We invest hours crafting valuable ideas, and your support means everything—feel free to ask questions in the comments! 😊💬
Cheers, Mad Whale. 🐋

SOLANA (SOL/USDT) – Bullish Flag Forming on 4H!Hey traders!
#SOLANA is currently consolidating sideways and printing a bullish flag pattern on the 4-hour timeframe – a classic continuation signal after a strong upward move! 🚀
Here's the plan:
Wait for a clean breakout above the flag's resistance
Enter on the retest of the breakout level to confirm support
Apply strict risk management and target the next major resistance zone
Watch for increasing volume to validate the move
Why this matters?
The bullish flag often leads to explosive moves when confirmed properly. Don’t chase the breakout — let price come to you. Patience = profits. 🧘♂️
Key Levels & Entry Plan marked on chart
Drop your thoughts below – do you agree with this setup or see it differently?
Like & Follow for more clean, no-hype trade ideas!
#Solana #SOL #CryptoTrading #BullishFlag #TradingView #TechnicalAnalysis #Altcoins #CryptoSetup #BreakoutTrade

Is Solana's Price Action Already Priced In?We are the SeoVereign Trading Team.
With sharp insight and precise analysis, we regularly share trading ideas on Bitcoin and other major assets—always guided by structure, sentiment, and momentum.
🔔 Follow us to never miss a market update.
🌟 Solana: One of the Highest Potential Assets in the Market Right Now
Riding the wave of Bitcoin’s bull market, Solana is showing remarkable potential, moving in sync with the broader market trend.
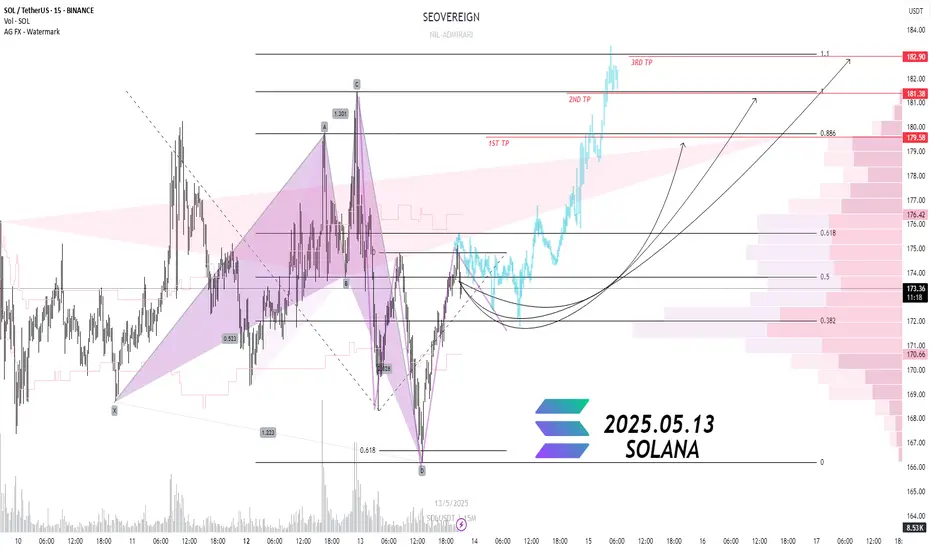
🎯 Price Targets:
1st Target: 179.5 — Breaking the initial resistance
2nd Target: 181.3 — Mid-term upward objective
3rd Target: 182.9 — Strong trend formation zone
We are positioning to buy Solana in bulk, capitalizing on its high potential during Bitcoin’s bull run.
However, whether Solana will continue its upward trajectory or if it has already been priced in and is due for a pullback is something only time will tell.
🚀 Is now the perfect moment to enter Solana, or should we wait? The market will reveal the answer.
HolderStat┆SOLUSD fixed above the trend lineSOL spent March in a messy consolidation box before rotating into a disciplined rising channel that has marched price from 110 to the doorstep of 180. Bulls are now wrestling with that major horizontal barrier; acceptance above it would turn the former ceiling into fresh support and open the calculated channel extension toward 205. Until channel lows around 150 give way, trend traders may lean on pullbacks inside the lane to stay positioned with momentum. 🔥
