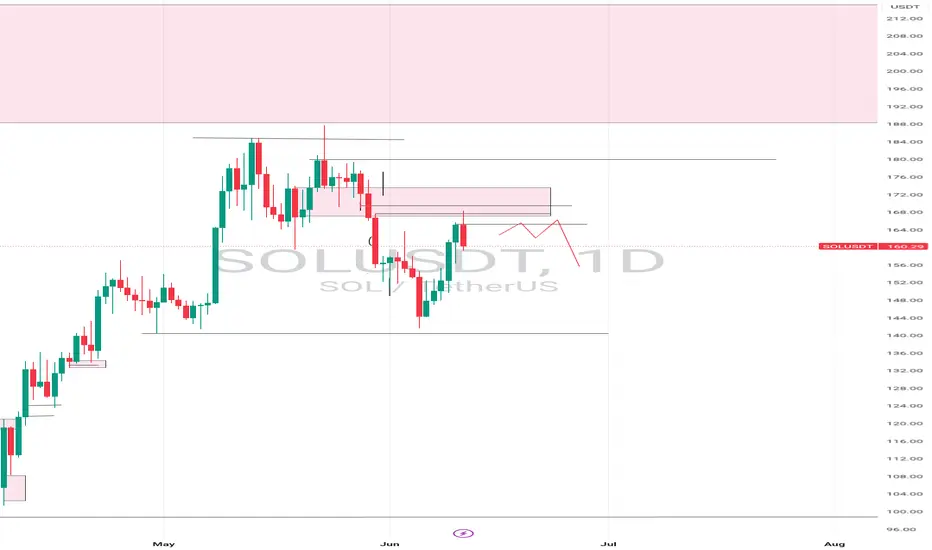
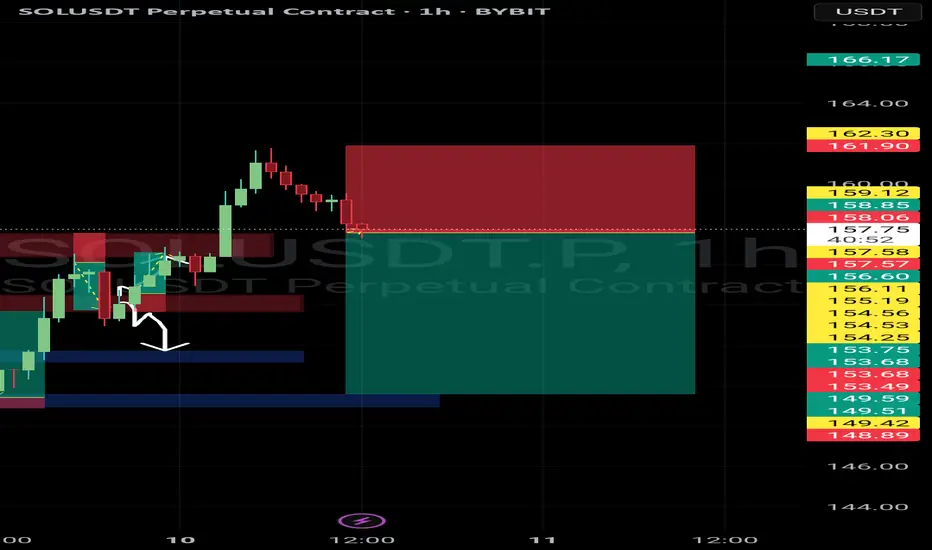
Possible bearish outlook After mitigation of the breaker block, I would love to see Solana resume it's bearishness to the downside
SOLUSDT.PS trade ideas
soluusd for short *The content on this analysis is subject to change at any time without notice, and is provided for the sole purpose of assisting traders to make independent investment decisions.
Solana Short Position Update – June 9, 2025We are the SeoVereign Trading Team.
With sharp insight and precise analysis, we regularly share trading ideas on Bitcoin and other major assets—always guided by structure, sentiment, and momentum.
🔔 Follow us to never miss a market update.
--------------------------------------------------------------------------------------------------------
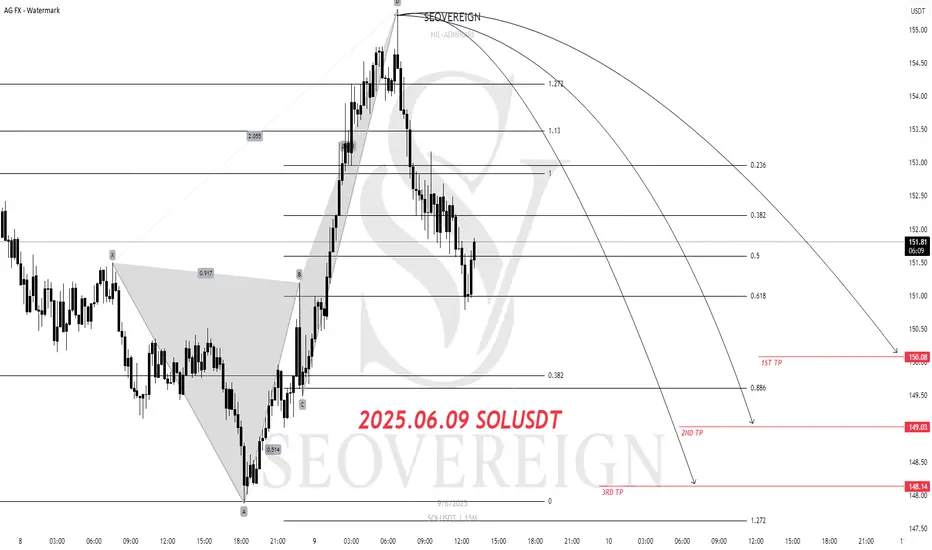
Solana (SOL) Short Position Strategy
DEPP CRAB Short
1st Target: 150
Analysis Summary:
Recently, SOL's price movement faced downward pressure after a short-term rebound and resistance in the overbought zone. From a technical perspective, a short position was taken near the Fibonacci retracement zone and previous resistance level, with targets set based on a gradual decline.
Each target is considered a zone with a high probability of support testing, and a partial take-profit strategy may be effective depending on market conditions. Risk management is essential, and a stop-loss should be set in case of an unexpected rebound.
Solana Short Position Update – June 7, 2025We are the SeoVereign Trading Team.
With sharp insight and precise analysis, we regularly share trading ideas on Bitcoin and other major assets—always guided by structure, sentiment, and momentum.
🔔 Follow us to never miss a market update.
--------------------------------------------------------------------------------------------------------
Solana Short Position Share
Currently, Solana appears to have entered an overbought zone after a technical rebound, and the pattern is reaching the completion area of a 0.382 ratio ALT BAT (Alternative Bat) pattern.
This pattern typically appears in areas with a high possibility of price reversal, and especially the 0.382 retracement is an early reversal form unique to the ALT BAT, indicating conditions where selling pressure in the market may strengthen again.
Accordingly, entering a short position at the current level is considered meaningful in terms of pattern reliability and risk-reward ratio.
The first target price is set at $150, which corresponds to a structural support level and the target range of a short-term corrective wave.
After entry, additional downside targets can be reviewed depending on market flow and candlestick development.

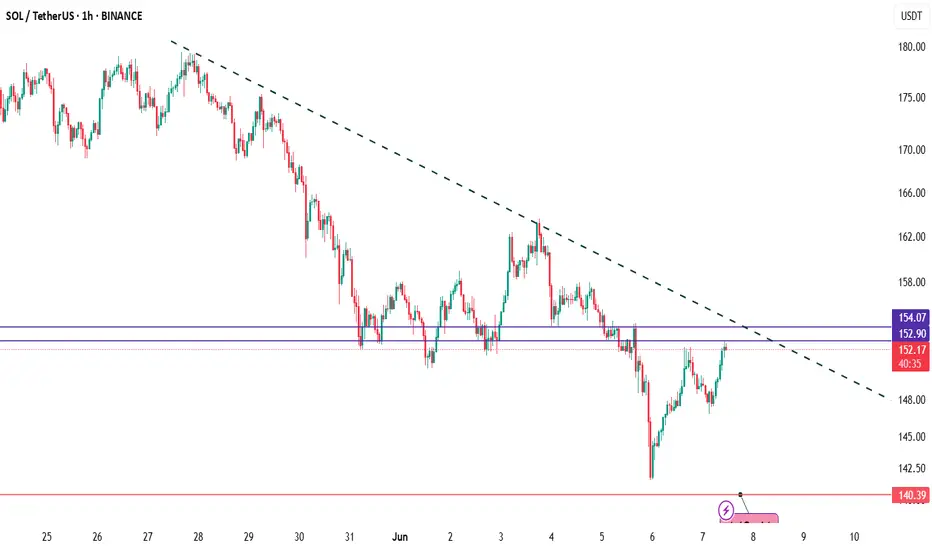
SOLANASolana is now testing a key resistance zone around $152.90 – $154.00, which overlaps with a well-respected descending trendline📉
So far, this zone has rejected price multiple times, and we’re yet to see a strong breakout or close above it. A clear move above $154 with volume could trigger a bullish breakout 🟢, targeting the $160–$166 range.
However, failure to break this level might result in another drop toward the $145 area or even revisit the $140 demand zone below. ⚠️
📌 Key levels to watch:
Resistance: $152.90 – $154.00
Support: $145.00 → $140.00
Breakout confirmation: Close above $154 on strong volume
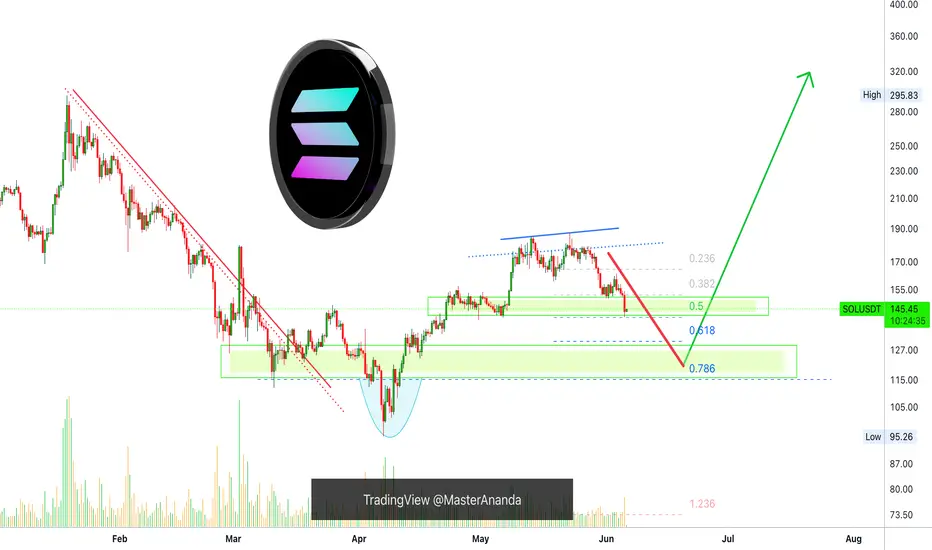
Solana Bullish, Retrace Over! Aim For $620 or $1,020 In this 2025 Cryptocurrency bull market, you should be aiming for $620 or $1,020 for Solana, $420 is the minimum.
How are you feeling today my dear friend?
I hope you are having a wonderful day.
Retraces and corrections, they can only last so long.
Solana dropped from $188 to $141 and I believe this is enough, a 24% drop (-24%).
As the retrace ends, the chart will produce a higher low and, as the higher low becomes confirmed, SOLUSDT starts a new wave of growth.
$420 is the minimum target for this bullish wave and should hit first but, you should aim higher, much higher. Crypto is showing to be many times stronger than what most people think.
Remember, the mistake we always make is not aiming too high but aiming too low. In each bull market, we tend to underestimate the market. Aim high, because we are going up.
Retraces and corrections are an opportunity to buy-in, 2nd entries, rebuy and reload.
Don't try to SHORT within a bull market, it is dangerous and not worth the risk. It is better to wait for support and go LONG. Always trade with the trend, specially if you are using leverage. Crypto is going up. Solana will now turn green.
Thank you for reading.
Namaste.

Solana Long Setup – Chart Analysis (June 5, 2025)We are the SeoVereign Trading Team.
With sharp insight and precise analysis, we regularly share trading ideas on Bitcoin and other major assets—always guided by structure, sentiment, and momentum.
🔔 Follow us to never miss a market update.
--------------------------------------------------------------------------------------------------------
Solana technical analysis is presented as follows.
Currently, Solana appears to have entered the final WAVE 5 phase of the 5-wave upward structure. The technical basis is as follows.
WAVE 5 = (WAVE 1 ~ WAVE 3) × 0.618
This length ratio is commonly observed in Elliott Wave Theory and often appears in the final wave of a strong trend. At the current level, this ratio is applied accurately, leaving room for further upside.
Confirmation of the Shark Pattern
One of the advanced harmonic patterns, the Shark pattern, has been completed within a valid zone, acting as a bullish reversal signal. In particular, reversals occurring at the 88.6% and 113% levels provide high reliability.
Comprehensive Assessment
With both of these technical elements satisfied simultaneously, the current level offers a solid basis for entering a long position.
1st target: 158.20
This price level aligns with a major structural resistance and Fibonacci extension zone, making it an appropriate target for short-term profit-taking.

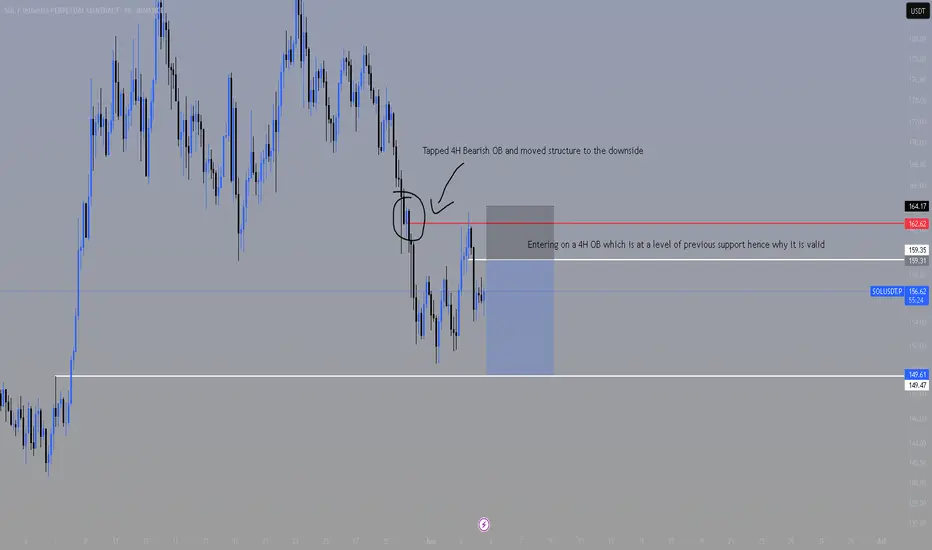
SOLANAA scalp on solana here. We have generally a short term downtrend with confirmation
Hence I was looking for shorts.
I identified a valid Bearish OB because it lies near previous support level thus entering on the body of this OB.
Putting my SL above local highs and target closest 4h demand zone.
#SOL/USDT#SOL
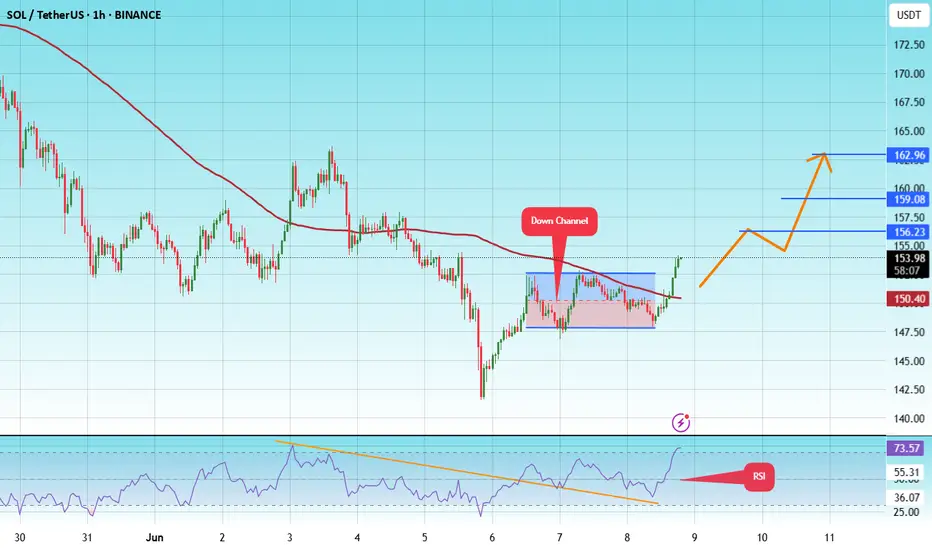
The price is moving within a descending channel on the 1-hour frame and is expected to break and continue upward.
We have a trend to stabilize above the 100 moving average once again.
We have a downtrend on the RSI indicator that supports the upward move by breaking it upward.
We have a support area at the lower limit of the channel at 148, acting as strong support from which the price can rebound.
Entry price: 153
First target: 156
Second target: 159
Third target: 162
SOL next target is 216, after filling this GAP⚡️ Hello everyone! I decided to update my thoughts on SOL. Everything is happening exactly as I wrote last time.
We went down and gathered some liquidity, and also closed the GAP. And now we are near strong resistance at 160-161.
Whether we can consolidate above this level is what will determine the direction of the next price movement.
⚙️ Let's take a look at the most likely direction going forward:
Money Flow - there was an outflow of liquidity at levels above 160, as profit-taking began after a strong rally from the April correction.
However, the inflow ratio is still neutral.
Liquidity Depth - a large accumulation of liquidity has gathered directly above us, at levels 187-200. And as we know, the price moves from one liquidity zone to another.
Overall, liquidity at the top is only increasing, with the difference now almost 5 times greater in favor of short positions.
DSRZ - strong resistance at levels 156-164. This must be overcome and turned into support in order to continue the momentum. As long as we are below it, this is a more bearish signal.
The next nearest liquidity zone is at 130 and below.
📌 Conclusion:
The next move now largely depends on the market as a whole. Historically, markets have frozen in the summer due to a lack of liquidity. However, this cycle has already shown many deviations, and another one would not be a surprise.
I am keeping my position open and continuing to monitor the situation. So far, the overall mood is bullish, and I continue to stick to my thesis that a move to at least 187 is likely, gathering liquidity from shorts in such an obvious place.
Have a great start to the work week, everyone! ☀️

Solana Approaches the Breaking Point.Solana is currently testing a key resistance zone (highlighted in purple), which has rejected the price multiple times in the recent past. At the same time, it continues to respect a well-defined ascending trendline, indicating building bullish pressure.
The blue zone marks an important horizontal support level, which served as the base for the previous breakout.
This chart is displayed in logarithmic view to better capture percentage-based price movements over time.
At the moment, price is being squeezed between:
the static resistance zone (seller area)
the rising trendline (buyer pressure)
What to watch for?
Break above resistance = potential bullish continuation
Break below trendline = possible retracement to support area
What do you think will happen next? Are you bullish or bearish on Solana?
Let me know in the comments!
If you enjoyed this post, feel free to share it with your friends!
Thank you!
#Solana #SOLUSDT #CryptoTrading #TechnicalAnalysis #LogChart #PriceAction #Breakout #SupportResistance #TradingView #Altcoins

SOL UPDATE - BOXES STILL VALID (ANALYST CRYPTO TANTRIK)boxes provided in the group earlier , had 2 good trades , still looking for a move
boxes are still valid , look for opportunities

SOL - TradeOur CRYPTOCAP:SOL setup was triggered perfectly.
Now I’ll let it play out and stick to my trading system.
A short-term drop is always possible —
but from here, we should be heading higher in the near future.
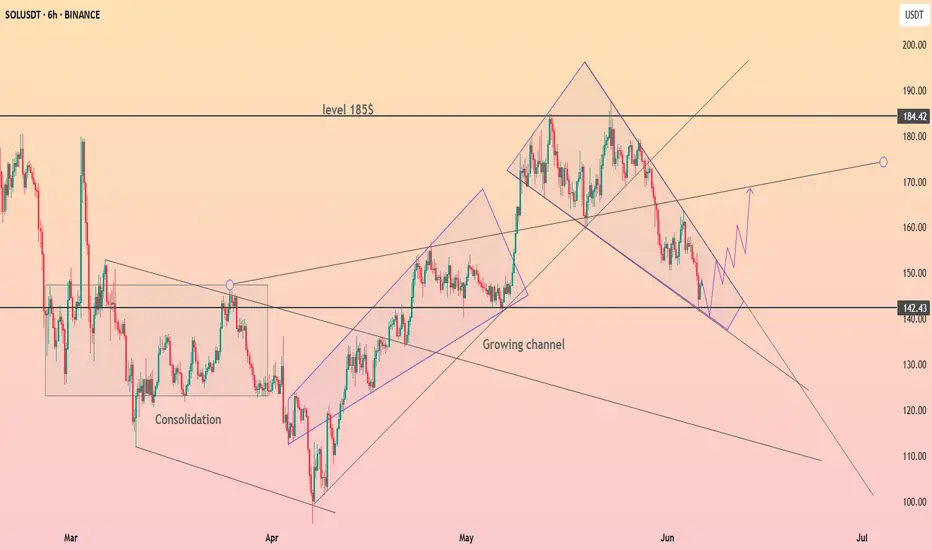
HolderStat┆SOLUSD rebound from 142CRYPTOCAP:SOL just kissed 142 support at the base of its growing channel. Solana price slips from a descending wedge, and holding above trend could propel bids toward 155, then the 170-184 supply band; lose the line and 125 beckons.
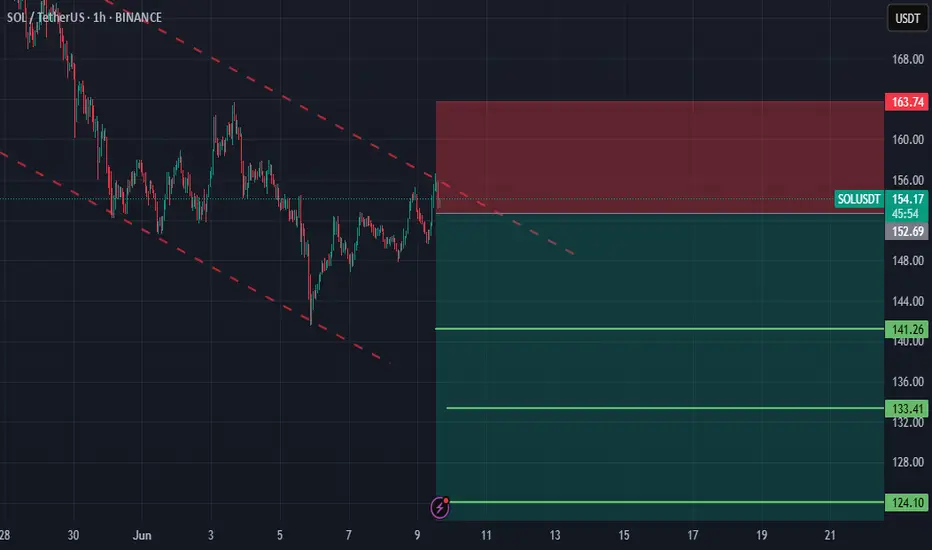
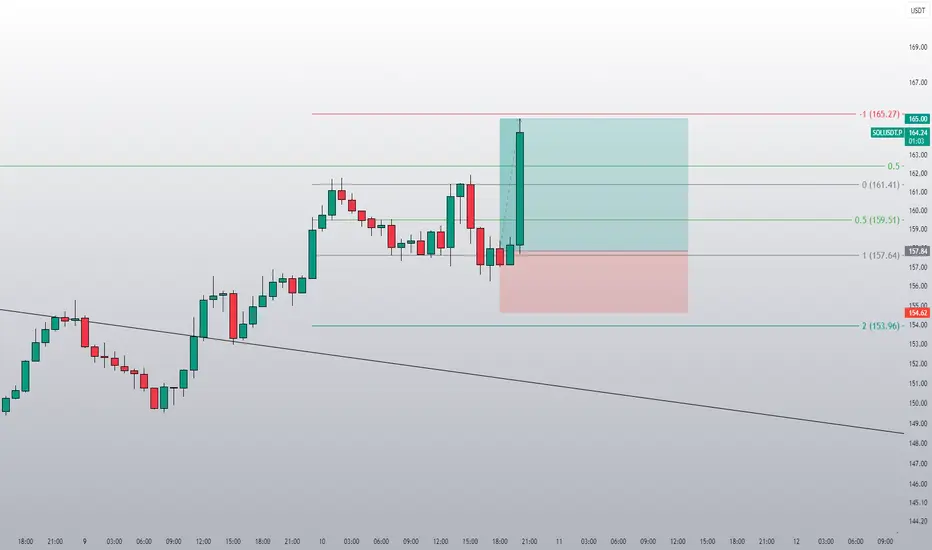
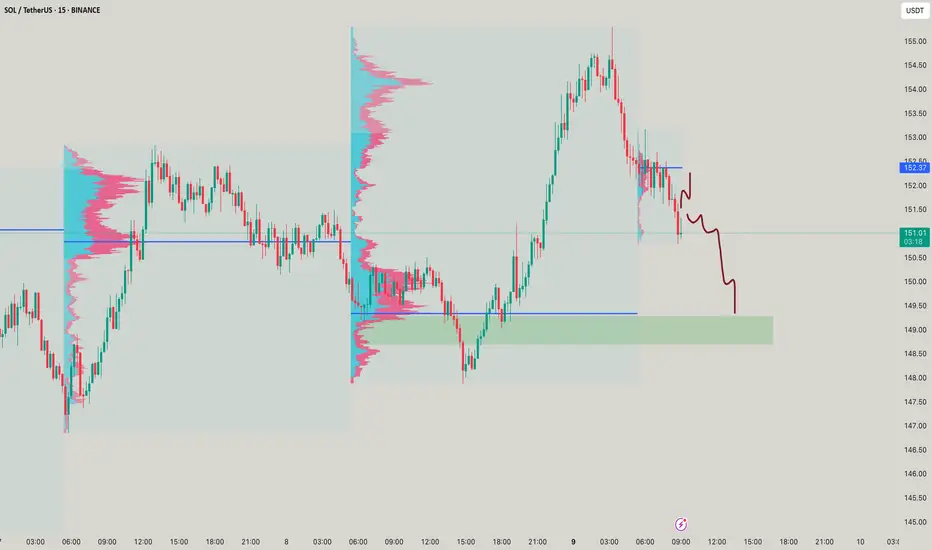
They took the low — now let’s see if they deliver the high.BINANCE:SOLUSDT just tapped into the BTS 15M zone sitting right above the 0.786 retracement — this isn’t your typical dip, it’s a stop-run with intent.
Here’s the setup:
Sweep of liquidity below 149.47 (key 0.786 fib)
Immediate rejection candle and reclaim of the OB 15M zone
Volume surge near the bottom = likely Smart Money entry
Price is following a textbook schematic. Manipulate, mitigate, and then distribute or expand.
Targets:
TP1: 151.59 (0.5 level — OB 15M reclaim test)
TP2: 153.55 (0.236 + inefficiency fill)
TP3: 155.35 (full expansion to STB 15M zone)
Invalidation: close below 147.88 (sweep without follow-through)
The move has already begun — this isn’t about predicting, it’s about recognizing.
For full market narratives and more setups like this, check the profile. No fluff — just smart structure.

SOL - Whats next?Planning the move as drawn, just moving it up and then down as depicted - Its a small short scalp
Sol will it drop again?Shorting sol with the Profit we made from last trades.
Having tight sl
Book profit wisely. Im going to sleep now
Will Solana Go Lower? Yes! Only To Recover HigherI've been asked: Will Solana continue lower?
I think it is a fair question but it is also pretty hard right now to say based on the chart, there are just too many mixed signals.
For example, if we take Solana in relation to Bitcoin, it is trading daily below EMA55 and MA200, while Bitcoin is trading daily above these levels. Bitcoin hit recently a new all-time high while Solana only produced a small recovery in May.
When it comes to the chart signals, SOLUSDT produced a volume breakout on the bearish side and the support zone was completely challenged on a single candle. What's more, Solana will grow really strong later this year, so it would be normal to see as much bearish action as possible now because later we will have sustained long-term growth.
It is a coin flip, but if you ask me, it can go a bit lower before moving up. It can go lower to end up producing a higher low.
I will wait for clear reversal signals before going LONG.
I closed all my LONGs a while back, when it became clear that the market was going into correction. Now we can just wait easily and patiently until the correction unravels, after the correction comes a new wave of growth. Down and up, down and up... The market continues to cycle. Never straight down, never straight up. It moves in waves.
Namaste.
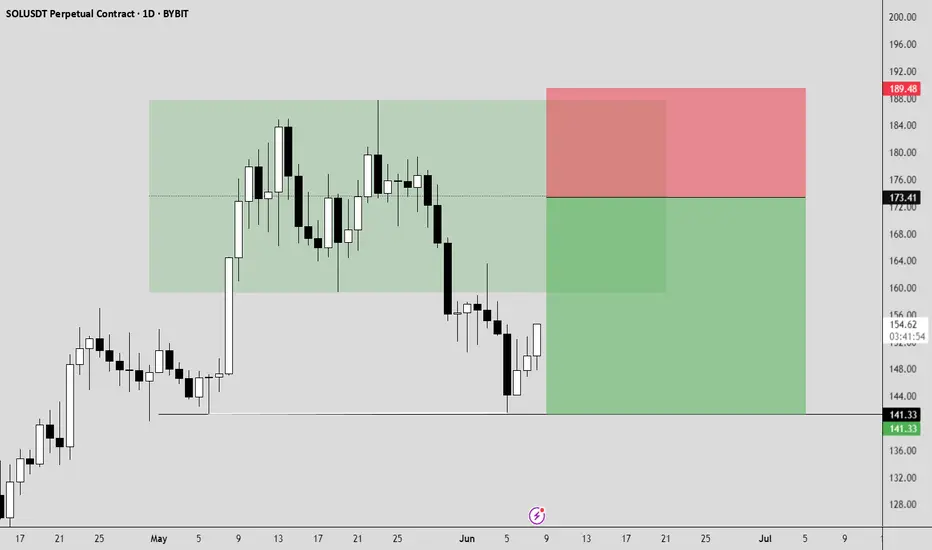
SOLANA SHORT SETUP The price has induced the pml and did not sweep it, by that it acumullated large ammount of liquidity at the relative equal lows.
I think we are going to retest the orderblock that I marked by the green box which essentialy is the wick on previous monthly candlle, after that the price should break to the downside taking out the acumulated liquidity.
Entry at 173.41
TP 141.33
SL 189.48
SOLANA SOLANA , sol have broken a demand floor and few weeks ,expect more sell before buying the deeps .
#sol #btc

Bearish flag on the 4H timeframe for SOL/USDT.Key Characteristics of a Bearish Flag:
1. Sharp downtrend before the flagpole – You can see a strong downward move leading into the pattern, forming the “flagpole”.
2. Consolidation in an upward-sloping channel – The price then moves upward within parallel trendlines, which is the “flag”.
3. Volume often decreases during the flag – While not shown in your chart, volume typically drops during the flag consolidation.
4. Bearish continuation expected – A break below the lower trendline often signals continuation of the previous downtrend.
Additional Notes:
• RSI is rising but still below overbought territory, suggesting there’s room for price action in either direction. However, if a breakdown occurs from this channel with an uptick in volume, it would strengthen the bearish thesis.
• The target for a bearish flag breakdown is typically the length of the flagpole, projected downward from the breakdown point.
Watch for:
• A confirmed break below the lower channel.
• Increased bearish volume during the breakdown.
• Potential support levels around $150 and $145.

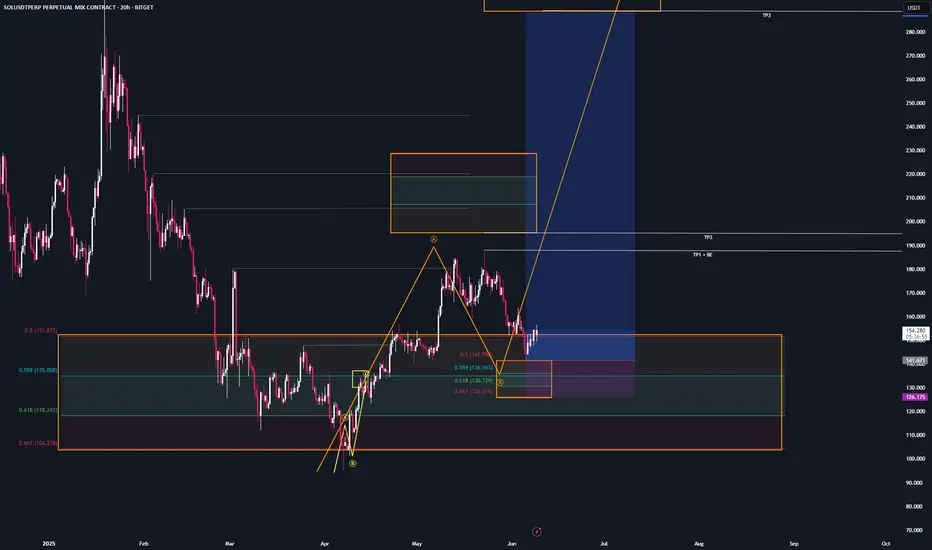
SOL - SetupOpened another long swing position on CRYPTOCAP:SOL
Tp1 + BE : at $188 — recent highs
Tp2: at $295 — trend reversal area
Tp3: at $288 — target region
If you have any questions about my system or trade logic, drop them below — I read every comment 👇
