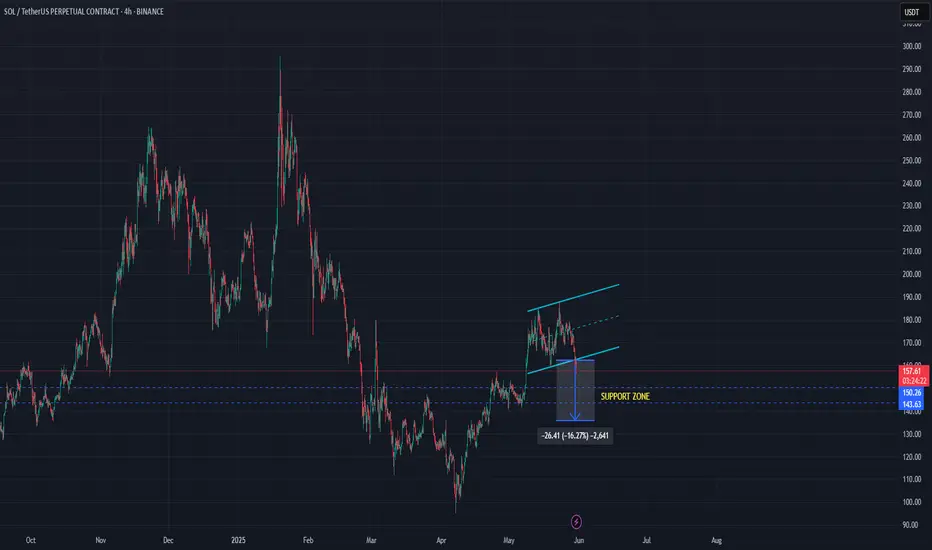
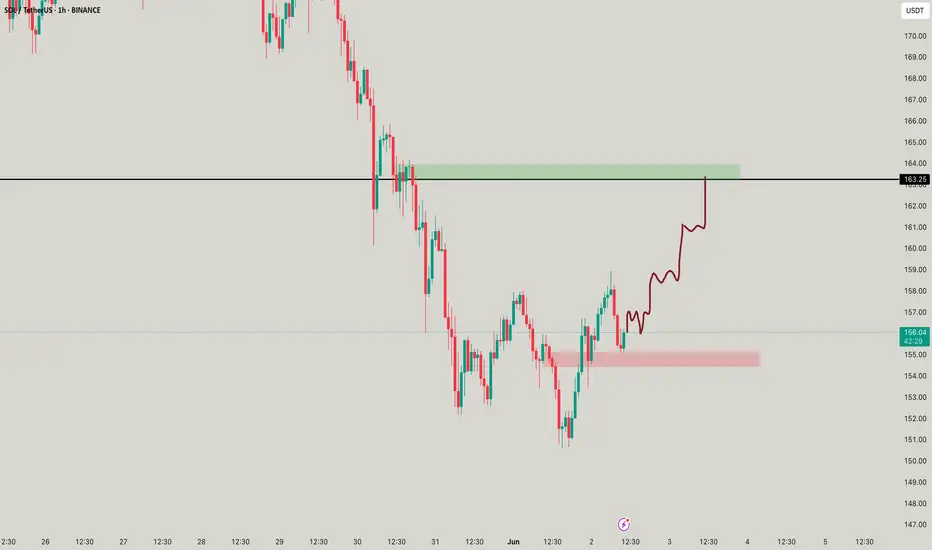
On Solana, 162$ is criticalBINANCE:SOLUSDT
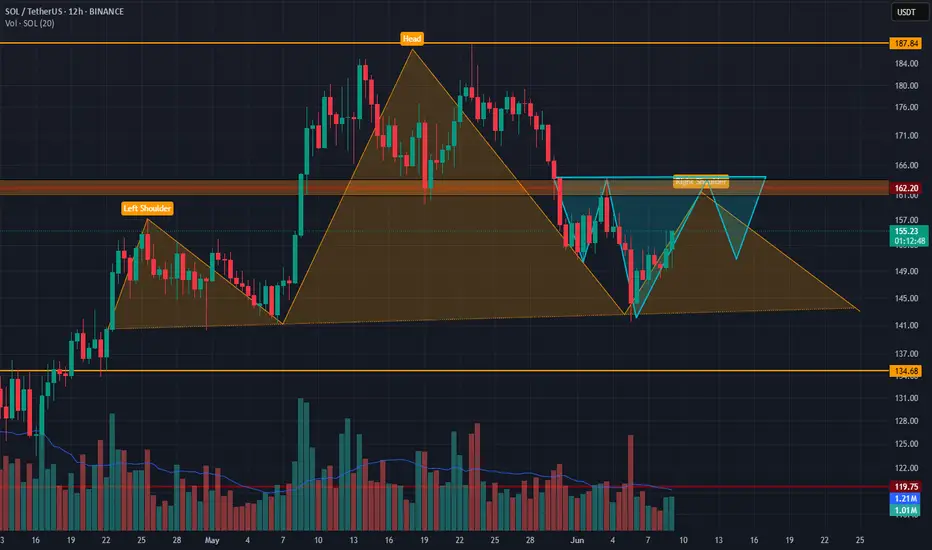
On Solana we are see 2 possible head ans shoulders pattern. İf we cant go past 162$ and the bigger pattern works, things for solana is not so good.
But if we can past beyond 162$ dollars with or without a reverse head and shoulders pattern, the bigger patterns is breaks and we can look for a further bullish movement.
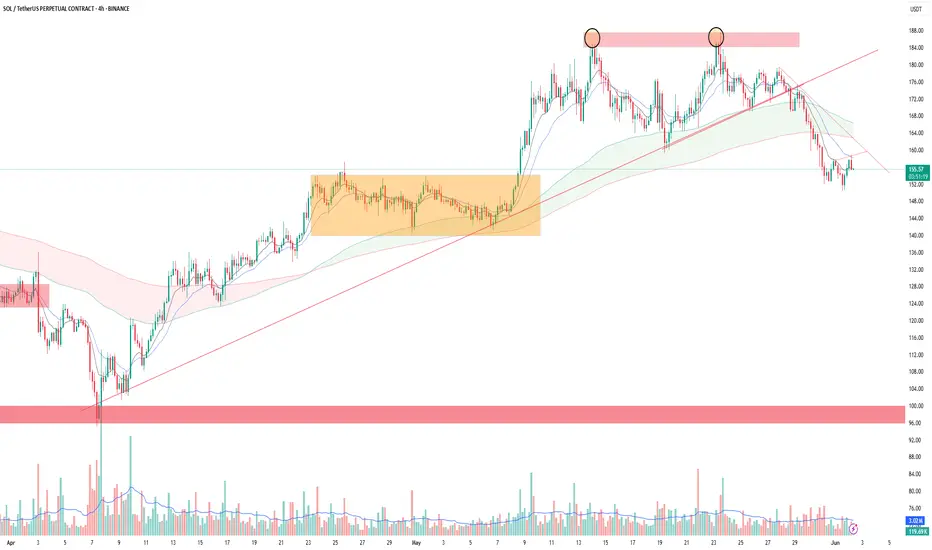
İf you look to my analysis from past, you see a falling wedge on solana too.
I think if Btc dont give any harm, solana wants to go up but one piece of news can change everything.
SOLUSDT.PS trade ideas
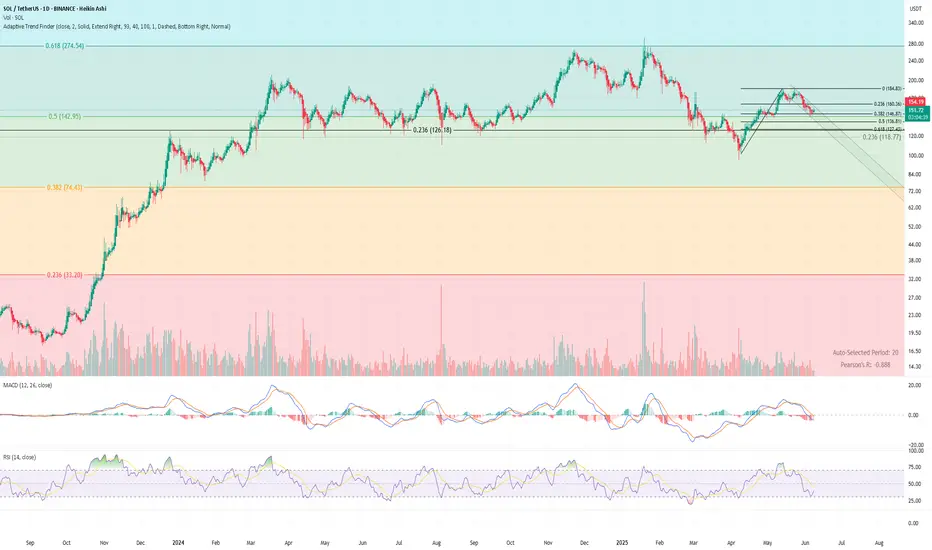
$SOL Tight Range. Big Move Loading? Full Multi-TF Breakdown📊 CRYPTOCAP:SOL Daily Chart
Price bounced from confluence support around $126 (0.236 fib + local structure), but remains below all key retracements from the $184 high.
– RSI hovering around 39 → oversold but no bullish divergence
– MACD still below signal line, weak momentum
– Structure remains inside a descending channel
BTC is testing $106K into weekly close.
If Bitcoin confirms a breakout, SOL could follow with a push above $160.3 (0.236 fib).
Reclaim of $160 → $184 next
Failure → $126 retest, with risk of break toward $118
Trend bias: bearish → neutral
Watching BTC for confirmation.
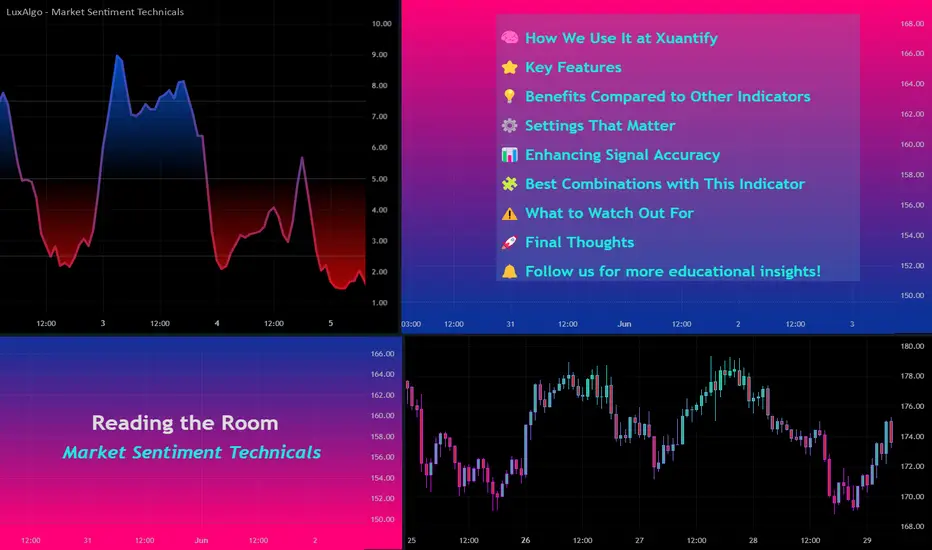
Reading The Room: Market Sentiment TechnicalsThe Market Sentiment Technicals indicator, created by LuxAlgo , is a powerful tool that blends multiple technical analysis methods into a single, easy-to-read sentiment gauge. It’s designed to help traders quickly assess whether the market is bullish, bearish, or neutral by synthesizing data from trend, momentum, volatility, and price action indicators.
🧠 How We Use It at Xuantify
At @Xuantify , we integrate this indicator into our multi-layered strategy stack. It acts as a market context filter , helping us determine whether to engage in trend-following, mean-reversion, or stay on the sidelines. We use it across multiple timeframes to validate trade setups and avoid false signals during choppy conditions. This example uses MEXC:SOLUSDT.P , symbols like BINANCE:BTCUSDT or BINANCE:ETHUSDT are fine to use as well.
⭐ Key Features
Sentiment Panel: Displays normalized sentiment scores from various indicators.
Market Sentiment Meter: A synthesized score showing overall market bias. (Below image)
Oscillator View: Visualizes trend strength, momentum, and potential reversals.
Divergence Detection: Highlights when price action and sentiment diverge.
Market Sentiment Meter: A synthesized score showing overall market bias.
💡 Benefits Compared to Other Indicators
All-in-One : Combines multiple indicators into one cohesive tool.
Noise Reduction : Filters out conflicting signals by averaging sentiment.
Visual Clarity : Histogram and oscillator formats make interpretation intuitive.
Adaptability : Works across assets and timeframes.
⚙️ Settings That Matter
Smoothing Length: Adjusts how reactive the sentiment is to price changes.
Indicator Weighting: Customize which indicators influence the sentiment more.
Oscillator Sensitivity: Fine-tune for scalping vs. swing trading.
📊 Enhancing Signal Accuracy
We pair this indicator with:
Volume Profile: To confirm sentiment with institutional activity.
VWAP: For intraday mean-reversion setups.
Breakout Tools: To validate momentum during sentiment spikes.
🧩 Best Combinations with This Indicator
LuxAlgo Premium Signals: For entry/exit confirmation.
Relative Volume (RVOL): To gauge conviction behind sentiment shifts.
ADX/DMI: To confirm trend strength when sentiment is extreme.
⚠️ What to Watch Out For
Lag in Consolidation: Sentiment may flatten during sideways markets.
Overfitting Settings: Avoid tweaking too much—stick to tested configurations.
False Divergences: Always confirm with price structure or volume.
🚀 Final Thoughts
The Market Sentiment Technicals indicator is a game-changer for traders who want a 360° view of market psychology . At Xuantify, it’s become a cornerstone of our decision-making process—especially in volatile conditions where clarity is key.
🔔 Follow us for more educational insights and strategy breakdowns!
We break down tools like this weekly—follow @Xuantify to stay ahead of the curve.
Sell signal by tiqgptMARKET NARRATIVE: The analysis across the four timeframes for SOL/USDT reveals a coherent narrative of smart money activity and price manipulation. Starting with the 1-hour chart, we observe a descending price action indicating a potential distribution phase. This is characterized by a series of lower highs and lower lows, a classic indication of a market structure shift towards a bearish bias. The presence of a significant Order Block (OB) around the $150.50 level, which has not been revisited, suggests that this level may act as a ceiling for future price actions.
Drilling down to the 15-minute and 5-minute charts, we see a continuation of this bearish sentiment with a clear Break of Structure (BOS) to the downside, confirming the shift in market structure observed on the higher timeframe. The 5-minute chart shows a rapid descent through previous low points, indicating liquidity sweeps below these levels. This action is typical of smart money inducing positions before a potential reversal or continuation.
The 1-minute chart provides a more granular view of the price action, showing recovery attempts being capped by lower highs, which aligns with the bearish market structure set by the higher timeframes. This micro-level view is crucial for pinpointing precise entries and understanding the immediate market sentiment.
INSTITUTIONAL THESIS: The overarching smart money intent appears to be a continuation of the bearish momentum, with potential liquidity targets below the current lows. The repeated failure to break above previous minor highs suggests an accumulation of sell-side pressure. Smart money may be positioning for a further push downwards, exploiting the liquidity pools formed below recent lows as retail traders are likely to have placed stop losses in these regions.
LEARNING POINT: The key concept here is the Break of Structure (BOS) on multiple timeframes confirming a bearish market structure shift. This is complemented by liquidity sweeps below recent lows, which are indicative of smart money's manipulation to trigger retail stop losses before potentially driving the price lower.
SIGNAL: SELL SYMBOL: SOL/USDT ENTRY PRICE: $148.60 STOP LOSS: $149.10 TARGET PRICE: $147.10 CONDITION: LIMIT ORDER: Place sell limit at $148.60 after a retest of the minor high on the 1M chart confirms rejection. RATIONALE: The trade is predicated on the bearish market structure across timeframes, with a recent BOS and liquidity sweeps indicating further downside. The entry at $148.60 is chosen based on the recent rejection points on the 1-minute timeframe, providing a tight stop loss just above the minor high at $149.10 to protect against potential whipsaws. The target is set at $147.10, near the next significant liquidity pool, offering a favorable risk/reward setup. STRATEGIES USED: 1H Bearish OB Continuation, Multi-Timeframe BOS, Liquidity Sweep Execution URGENCY: MEDIUM TIMEFRAME: Short-term CONFIDENCE SCORE: 75%

Accurate SOL Momentum TrackerSolana Tracker with a custome SMACD Indicator tuned to track swings for swing trades. Bottom Red pass = bearish potential green line pass + bullish potential

Solana Can Go Up AgainBINANCE:SOLUSDT.P
I am sharing this analysis for myself, it is not investment advice.

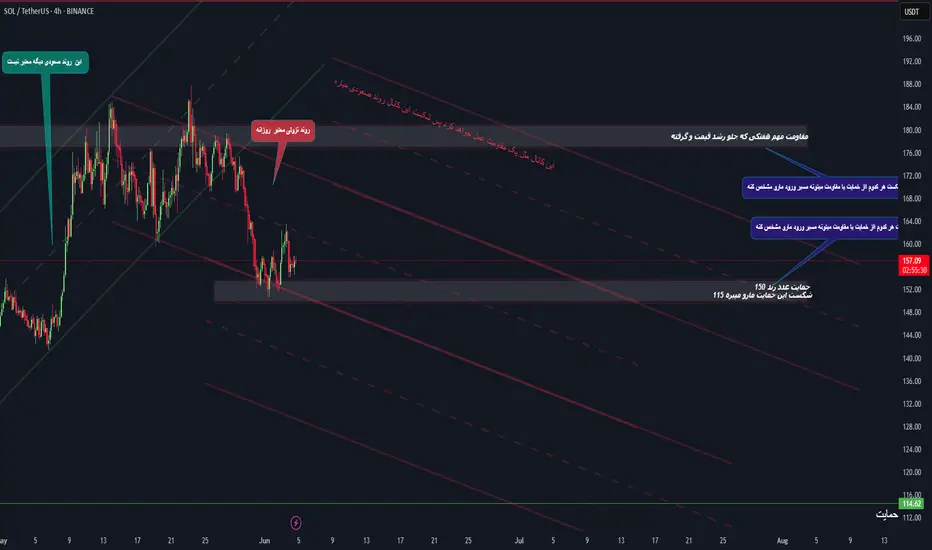
SOL Structural Analysis – Facing Weekly Resistance and Key LevelOn the 4H chart of Solana (SOL), the price has broken out of a temporary bullish trend and entered a clearly defined descending channel.
🔸 The major resistance around $164–$172 could limit further upside in the short term.
🔸 A confirmed breakdown below the $150 support may lead to a deeper correction toward the $115 zone.
🔸 The descending channel is currently guiding price action, and reactions to its midline and upper boundary will determine the next major move.
🔸 The analysis distinguishes between short-term impulses and the dominant daily downtrend, helping identify potential trade setups.
📌 This analysis is for educational purposes only.
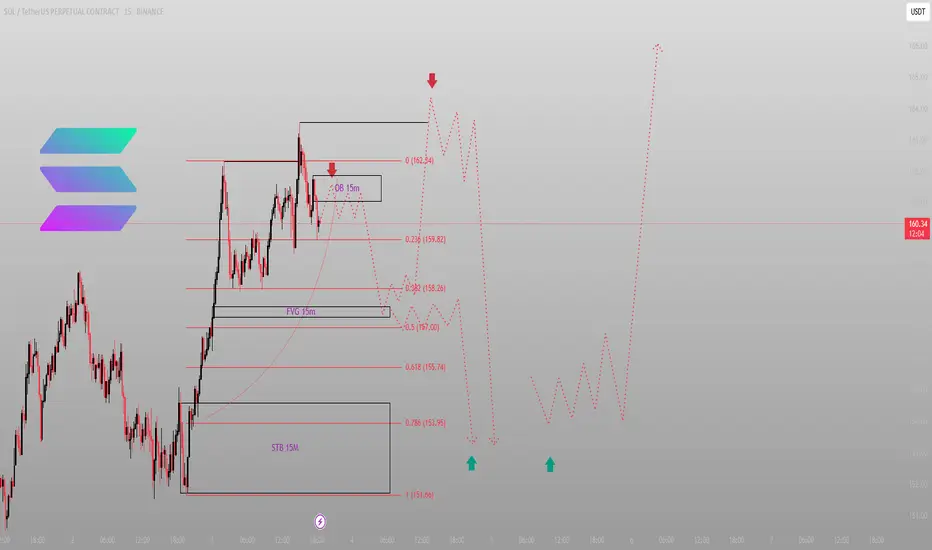
Smart Money doesn’t chase. It collectsSOL just rejected off a 15M OB — not by accident, but by design.
The market isn’t bullish or bearish here. It’s preparing to offload the next wave of liquidity.
Here's the logic:
Price hit 162.34, sweeping liquidity and rejecting inside a 15M OB
That rejection aligned with confluence at 0.0 fib — engineered resistance
We're now coiling just above 0.236 (159.82), with a roadmap back into inefficiency
FVG at 15M sits cleanly between 158.26 and 157.00. This is where premium meets discount and where most will hesitate. I won’t.
If we get that flush lower — 155.74 → 153.95 becomes the key liquidity zone.
STB at 151.66? That’s the ultimate draw if this unravels cleanly.
Execution plan:
Short-term bounce is valid only if 159.82 holds — anything below 158.26 confirms bearish leg
I want to buy from 153.95–151.66 — that’s where price will seek to rebalance
Break 162.34 impulsively? Re-evaluate — structure is shifting
This isn't a reaction trade. It's engineered delivery.
More entries like this, built off logic not noise? You know where to find them — profile description.
HolderStat┆SOLUSD channel surferCRYPTOCAP:SOL exited a falling channel, built a clean growing channel and parked on 165 USDT support. Repetitive consolidation mid-way and a projected path to the 190 USDT level underscore continuing strength, with trendline confluence favoring upside continuation.

Solana Bounces From 0.618 Fib — Bullish Structure Eyes Rotation Solana (SOL/USDT) has respected its 0.618 Fibonacci retracement level, which aligns with a high-timeframe higher low in the ongoing bullish market structure. If this level continues to hold, Solana may be preparing for a rotation toward $175—and potentially beyond.
The current support level is not only a Fibonacci retracement zone but also represents a structural higher low in Solana’s trend. As price bounces from this area, the bullish market structure remains intact, characterized by consecutive higher highs and higher lows. This setup suggests that Solana is merely in a corrective phase before a potential continuation.
Key Technical Points
- 0.618 Fibonacci Confluence: Aligned with a key higher low in the structure, this level is providing strong technical support.
- $175 as Immediate Resistance: A breach of this level could open up a continuation move toward $200 and $216.
Bullish Market Structure: Solana continues to print higher highs and higher lows, maintaining the integrity of the uptrend.
If Solana successfully reclaims and breaks above $175, it would confirm a short-term shift in momentum. This move would likely accelerate price toward $200—the next psychological and technical level. If that level is breached as well, the door opens for a rotation toward the $216 high, completing the current projected trend wave.
As long as the 0.618 Fibonacci support holds, Solana remains bullish. A clean move above $175 would confirm the trend continuation, with $200 and $216 as the next logical upside targets. Watch for strong volume on the breakout to validate the move.

SOL Ready for Explosive Move? | Must-Watch Levels Ahead!📈 SOLANA is at a major turning point! After breaking down from the bullish channel, it's now testing the demand zone around 150. But here’s the catch...
🚨 A new bearish trend channel is forming, and we’re at a key decision point:
Breakout = 🚀 bullish continuation
Rejection = 🔻 more downside to come
💡 Key insights from this chart:
✅ Old bullish structure is invalidated
✅ Red trend channel now in control
✅ Watch the gray demand zone and reaction to minor resistance levels
✅ Macro resistance at 202–217 still untouched!
🎯 Levels to watch:
Support: 150 – 114
Resistance: 170 → 202 → 217
📌 If you trade SOL, you don’t want to miss this setup. Follow for more alpha!
🧠 Made by: TradeWithMky – where altcoins speak louder than Bitcoin!
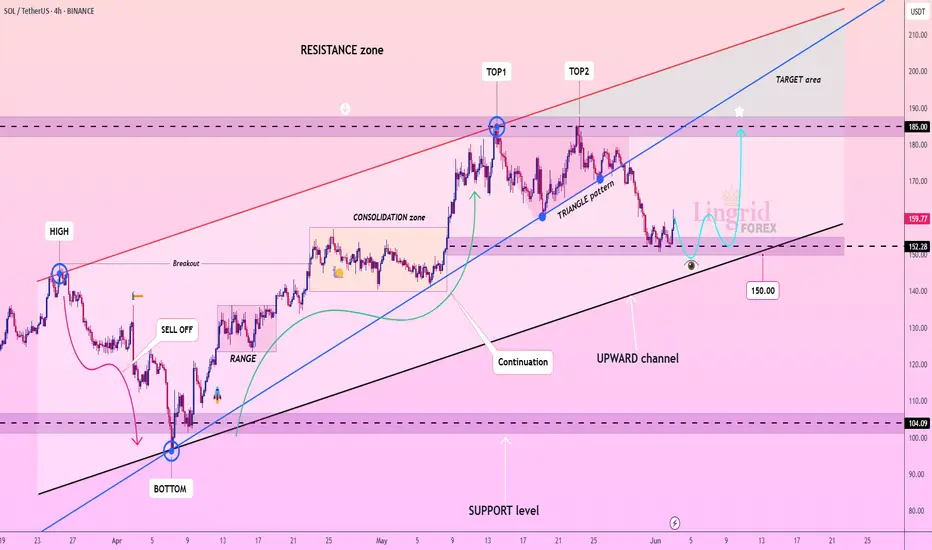
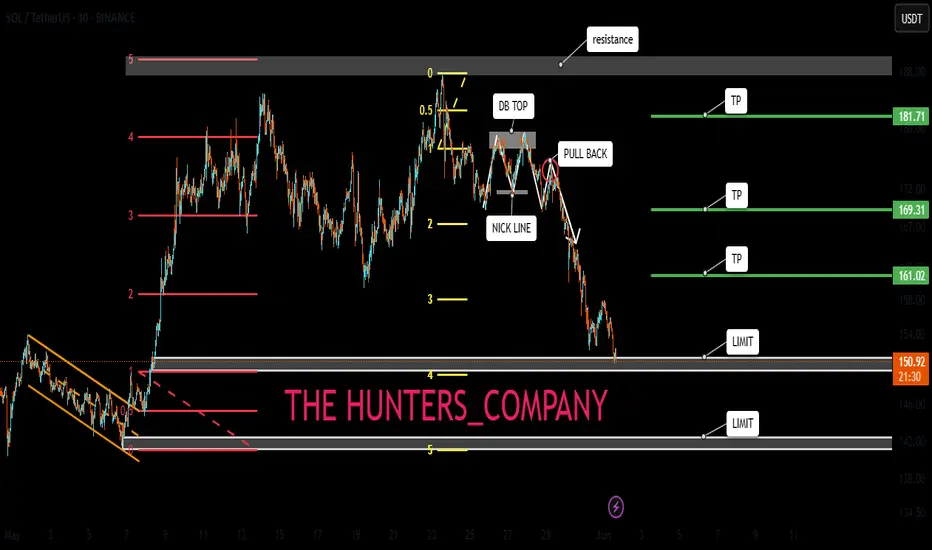
Lingrid | SOLUSDT channel Continuation Pattern Eyes Higher LevelThe price perfectly fulfilled my previous idea . BINANCE:SOLUSDT has declined from the double top structure (TOP1 & TOP2) and is now resting within a support box around the 152–160 zone, which coincides with the lower bound of the upward channel. The price action shows a potential bounce setup forming with a projected move toward 185 if bulls reclaim momentum. A successful rebound from the black trendline could trigger a new impulsive wave toward the upper resistance region.
📈 Key Levels
Buy zone: 150.00–160.00
Buy trigger: bounce from 152.00 trendline
Target: 185.00
Sell trigger: breakdown below 150.00
💡 Risks
Continued weakness could break the uptrend channel
Failure to close above 160.00 would weaken rebound prospects
Broader market downturn may override the setup
Traders, if you liked this idea or if you have your own opinion about it, write in the comments. I will be glad 👩💻
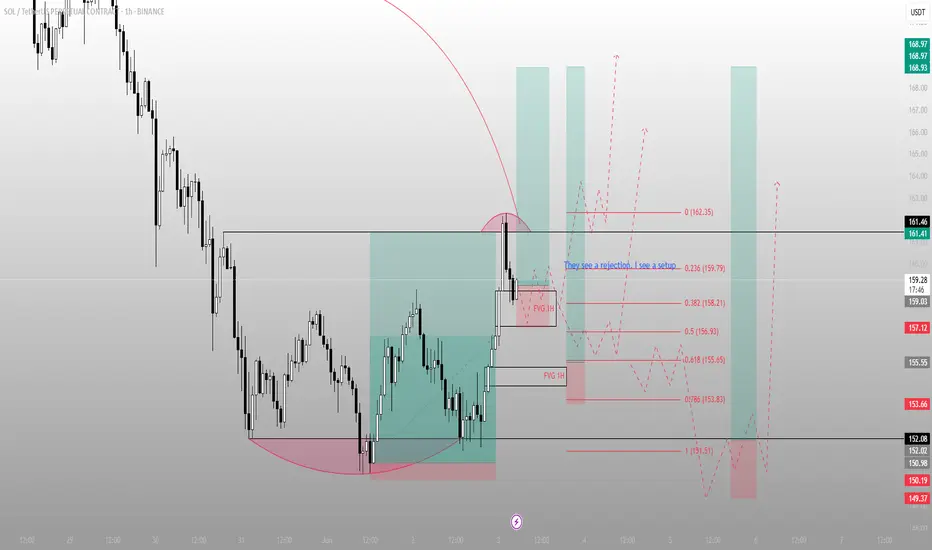
They see a rejection. I see a setupSOL swept the low, ran back to premium, and is now hovering in a reactive FVG.
Most traders see uncertainty here — but this is exactly where structure sharpens.
Here’s what just happened:
Price reversed off a well-defined STB and reclaimed the inefficiency above
It pierced into 162.35 before rejecting — not a failure, but a setup
That move left behind two stacked 1H FVGs
We’re now in the upper one — a re-entry pocket if you understand what this is
This zone between 158.21 and 156.93 is where I expect a reaction. If it holds, structure is preserved and the push toward 161.41 → 168+ resumes.
If it fails, we likely probe 153.83 or deeper into 151.51 — one last shake before the run.
Bias: Long
Trigger: Clean reaction off 1H FVG, higher low formed
Invalidation: Below 151.51
Target: 162.35 first, then 168.93+ on continuation
More setups like this — structured, timed, no fluff — are in the profile description.
No group chat noise. Just levels that matter.
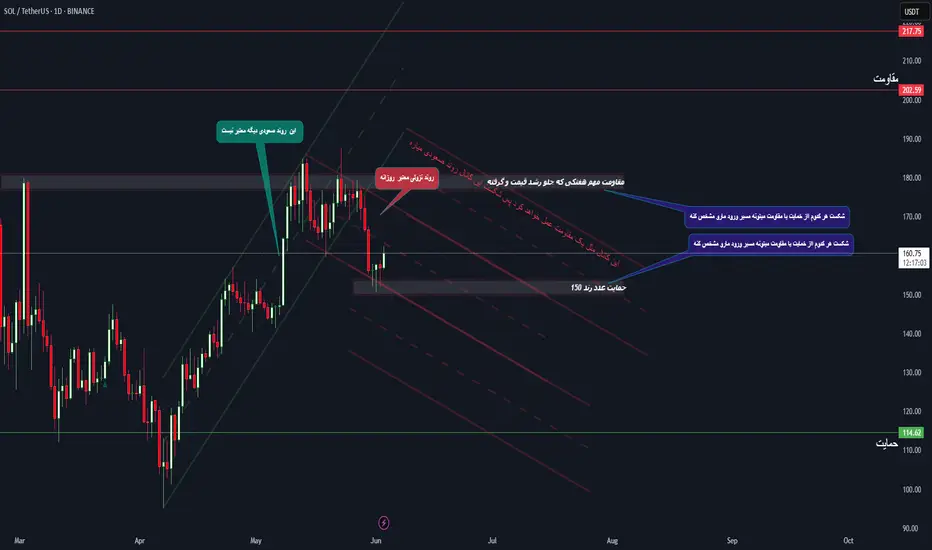
Watch out for Solana today.Hello friends
You can see that in the image we have done a complete and comprehensive analysis of Solana for you and identified points that are good supports and can be bought in the areas.
Given the deep correction we had, the market has fallen into fear and a good opportunity has been provided for buying.
The targets have also been identified.
Please observe capital management and avoid irrational risks.
*Trade safely with us*
SOL is next to set new ATH and here's whyHey guys! Like I said in my last review - SOL went to close GAP from the bottom, gathering liquidity.
❓ GAP is almost closed and time to reflect, what's next?
The liquidity imbalance has gotten bigger. If, as recently as last week, there was 1.5 times more liquidity in shorts. Today liquidity in shorts is almost 4 times more than liquidity in longs.
Which means that most of the speculative positions have already been closed. Of course, the volume of liquidations is not even close to the peak, which indicates that there is still no fresh liquidity on the market and therefore it is difficult for the token to maintain the current momentum.
Besides, summer is coming soon and liquidity will only become less. But for SOL this is a plus rather than a minus and here's why:
⚙️ Metrics and Indictors:
VRVP - we are approaching one of the most active levels, in the 148-136 zone. This zone is where the largest area of trader interest is concentrated. And it is in this zone that I think a lot of people will start looking at SOL from a spot buying perspective.
RSI - is 40. It is not in the oversold zone yet, but the GAP is not closed to the end. That means that the probable continuation of the decline to the psychologically important level of 150-147, may provoke a decline to the oversold level and the beginning of short-term purchases by traders.
DLD - as already mentioned. Liquidity of shorts is now 4 times more than liquidity in longs. And as we know, the price moves from one liquidity to another, which acts as fuel for it.
📌 Conclusion:
Unlike ETH and even BTC - there is no more GAP below in SOL! This means that all further declines will be based on effectively traded zones where there is already organic supply and demand. So we are unlikely to see 20% drops overnight (unless if Trump don't do something weird).
Besides, there is a lot of liquidity in shorts at levels 185 - 201 (local double top of the current momentum).
Short squeezes in historically bearish patterns are not uncommon now. As traditional technical analysis has not been working as it should for a long time due to its proliferation.
So I see the first test of the 146 -141 level as the first possible point for a price reversal, at least to renew the local high.
🔥 Congratulations to everyone on the start of summer and have a good week!

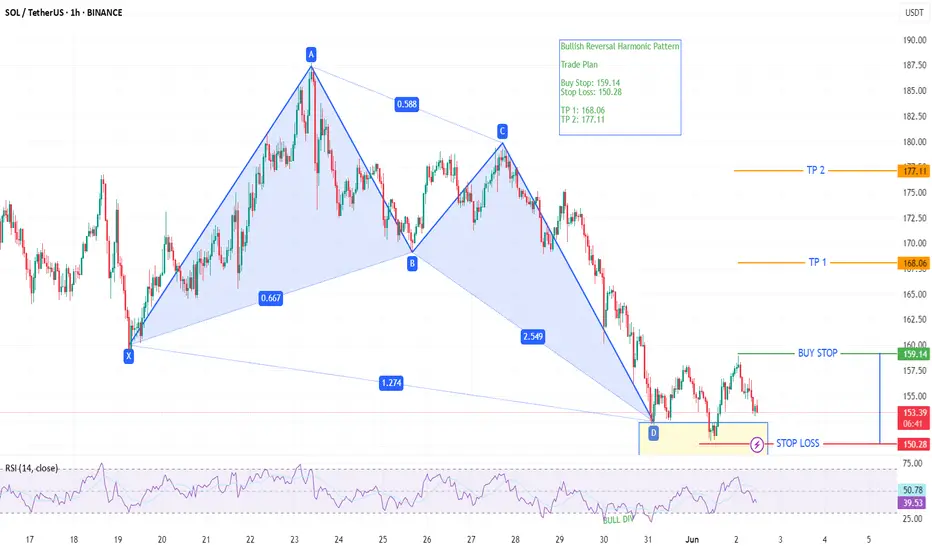
SOLUSDT Bullish Reversal Harmonic PatternSOLUSDT on 1hr time frame making the bullish diversion on RSI indicator and potential reversal zone according to XABCD bullish reversal harmonic pattern
SOLANA It has good growth potential in midtermThe SOL will increase $150 and reach to the top of the wedge in the coming weeks .
Give me some energy !!
✨We spend hours finding potential opportunities and writing useful ideas, we would be happy if you support us.
Best regards CobraVanguard.💚

SOL/USDTAs you can see, we have a textbook cup and handle pattern for $SOL. The measured target is $400.

They saw consolidation. I saw controlled accumulation at OB.SOL just printed what looks like sideways noise — but structure tells a different story.
Price swept the 0.786 fib at 151.44, tapped into a refined 4H OB, and held. That isn’t indecision. That’s deliberate compression — Smart Money accumulating just beneath the surface while the herd waits.
Volume profile confirms it. We’re sitting on a high-volume node, and price hasn’t broken it with conviction. Every wick down is a test — and every recovery is another sign of intent.
If price holds above the 4H OB zone, I expect delivery first into 161.49 — an unmitigated OB that lines up with prior liquidity. From there, 171.62 becomes the macro draw. That’s where imbalance meets memory.
Execution alignment:
🟩 Entry: 151.44–153.00 (OB retest zone)
🎯 TP1: 161.49
🎯 TP2: 171.62
❌ Invalidation: Break below 150.53 with displacement
This isn’t consolidation. This is foundation.
I don’t wait for permission. I wait for price to tip its hand.

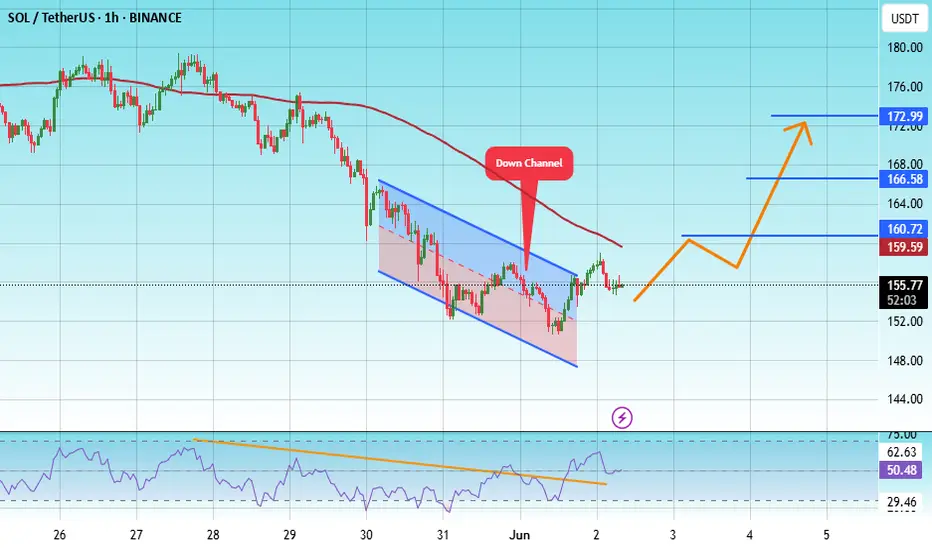
#SOL/USDT#SOL
The price is moving within a descending channel on the 1-hour frame, adhering well to it, and is on its way to breaking it strongly upwards and retesting it.
We are seeing a bounce from the lower boundary of the descending channel, this support is at 150
We have a downtrend on the RSI indicator that is about to break and retest, which supports the upward trend.
We are looking for stability above the moving average of 100.
Entry price: 156
First target: 160
Second target: 167
Third target: 173
SOL - Another run?Look another run means another buy and buy looks dope only if it doesnt breaks the red box for whatsoever reasons!!
SOL/USDT at the Razor's Edge! Critical LevelsHey Traders!
Solana (SOL/USDT) is at a fascinating, yet precarious, technical juncture. We're seeing a tug-of-war between short-term bearish onslaughts and underlying long-term structures. Let's break down what the charts are telling us for early June 2025.
📉 Current Market Pulse:
Short-Term (15M, 1H):
Decidedly BEARISH. Sharp declines, broken supports, and high volume on selling candles signal immediate seller control. Price is well below red MA clouds.
Mid-Term (4H, Daily):
Trend has flipped BEARISH. Multiple ascending trendlines broken after a significant rejection from the $ 185-$ 189 resistance. MA cloud is red and capping rallies.
Long-Term (Weekly):
The established bull trend is under SEVERE PRESSURE. Price is testing the lower boundary of the long-term green MA cloud. The ~$ 100 level looms large as ultimate macro support.
Key Levels You CANNOT Ignore:
Immediate Support Zone: ~$ 150 - $ 155 USDT (Currently being tested! This is the old May consolidation top).
CRITICAL Support: ~$ 140 USDT (Lower boundary of May's yellow consolidation box. A break here could accelerate downside).
ULTIMATE Macro Support: ~$ 100 USDT (THE historical pivot. Acted as major resistance, then powerful support. Vital for the bigger picture).
Immediate Resistance: ~$ 157 - $ 158 USDT (Underside of broken short-term trendline, ST MA cloud).
MAJOR Resistance / "The Wall": ~$ 185 - $ 189 USDT (Proven supply zone, potential double top formation here).
Chart Patterns & Indicator Insights:
Potential Double Top: Strong rejection around $185-$189 hints at a significant local top.
Broken Trendlines: Multiple bullish trendlines on mid-term charts have snapped – a clear warning.
MA Clouds: Red across short/mid-terms acting as resistance. The long-term green cloud is being seriously challenged.
Volume: Recent sharp drops on the short-term charts came with convincing volume spikes, validating selling pressure.
Potential Scenarios on the Horizon:
Bearish Continuation (Higher Probability ST/MT):
Trigger: Clean break and close below $ 140 USDT.
Path: Likely targets $ 125-$ 130 first. Sustained selling could then push SOL towards the critical $ 100 USDT macro support. A break below $ 100 would be a major bearish signal for the long term.
Bullish Reversal (Lower Probability without Strong Catalyst):
Trigger: Strong defense of the $ 140-$ 155 USDT zone, ideally forming a bottoming pattern (e.g., double bottom) on significant buying volume.
Path: Needs to reclaim ~$ 158, then ~$ 170-$175. The real test would be a break above the formidable $ 185-$ 189 resistance to challenge the bearish narrative.
Sideways Grind:
Path: Price could get stuck in a range, potentially between ~$ 140 and ~$ 170 USDT, as bulls and bears battle for control. This means market indecision.
Key Takeaway:
SOL is at a knife's edge. The immediate pressure is downwards. A failure to hold $ 140 could see a swift move to $ 100. Bulls need a heroic stand here and a reclaim of $ 185-$ 189 to turn the tide. Risk management is paramount in this environment!
What are your thoughts? Which scenario do you see playing out for SOL?
Disclaimer: This is not financial advice. Analysis based on provided information for educational purposes only. Markets are volatile. DYOR.
Wedge broken > Short expected until support zoneHello Folks.
As you can see, the descending channel has been broken, There is world where we can expect a short until the next support zone. It can fall even until 138 USD (realistic). Depending on how BTC will react this week end after official macro releases.
Trade with caution.
Regards