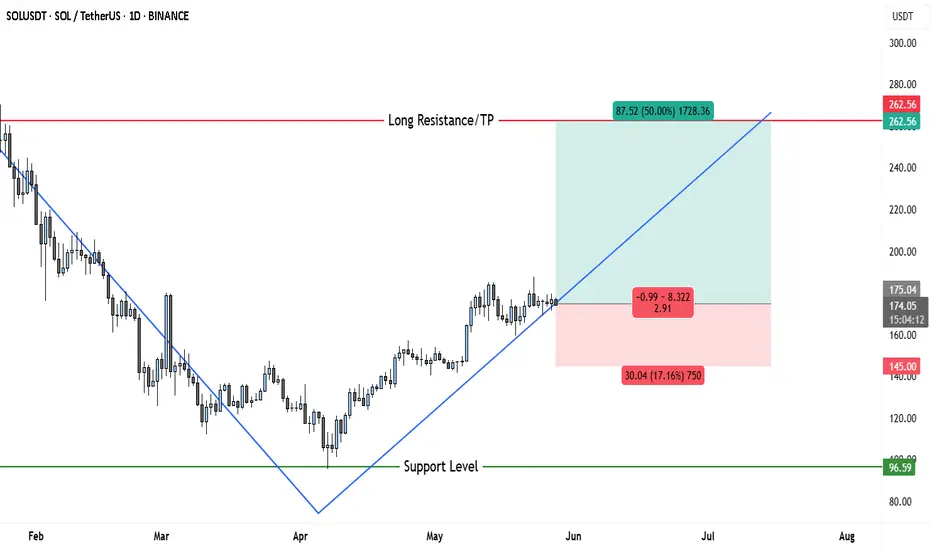
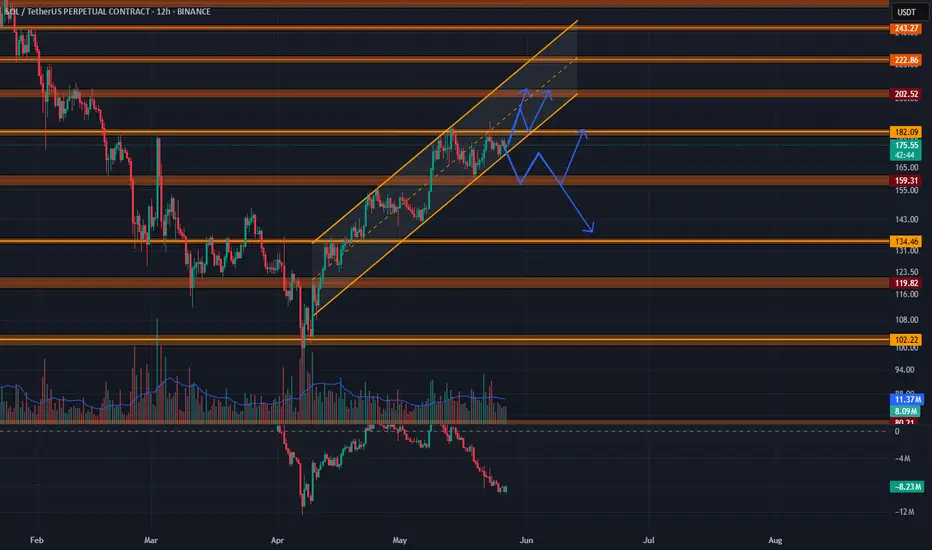
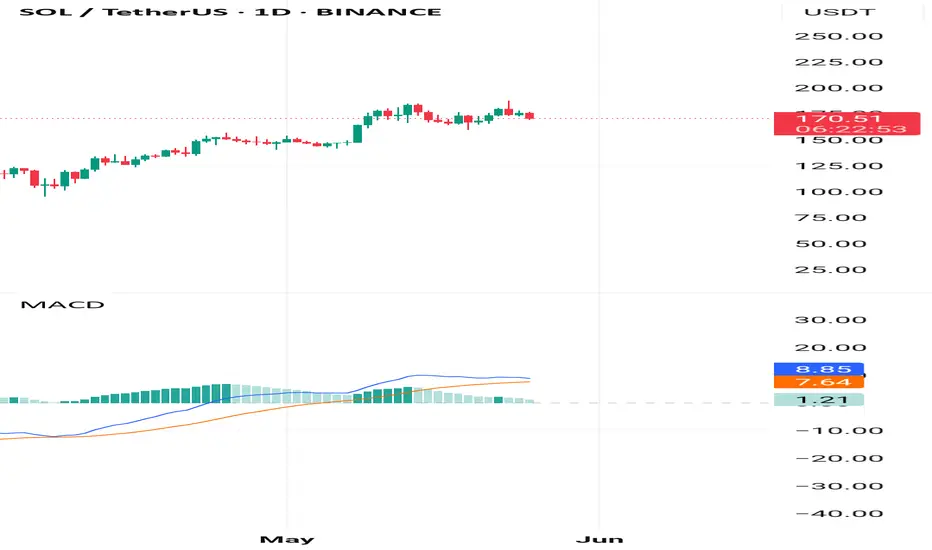
$145 Stop, $262 Target — SOL Bullish Breakout Looks UnstoppableThe chart presents a clean bullish reversal from the previous downtrend observed between February and early April. After breaking the long-term descending trendline, Solana (SOL) flipped structure and has been printing higher highs and higher lows, signaling a transition into an uptrend.
This is reinforced by the ascending blue trendline that currently acts as a dynamic support. Each price correction respects this trendline, showing that buyers are defending higher levels.
✅ Key Technical Justifications for Bullish Bias
1. Break of Downtrend
The long-term descending trendline from the February highs was broken decisively.
This signifies a trend reversal, which has since seen SOL push into a new bullish channel.
2. Strong Higher Lows
Price has been consistently making higher lows, respecting the blue uptrend line.
This price behavior confirms increasing bullish momentum.
3. Support Level Holding
The horizontal support around $96.59 was respected during the reversal.
This base forms the foundation of the bullish wave we’re seeing now.
4. Bullish Price Compression
After a strong impulsive rally, SOL has entered a consolidation just above the trendline.
This resembles a bullish flag or pennant, typically a continuation pattern.
5. No Major Resistance Until $260+
The nearest strong resistance sits around $262.56, which aligns with a previous breakdown zone and coincides with your take-profit (TP) zone.
With no serious resistance in the $200–$250 range, price can climb smoothly once bullish continuation triggers.
📊 Trade Setup (Long Position)
• Entry: Around $174.30 (current market zone as per chart)
• Stop Loss (SL): $145.00 (Below recent swing low and dynamic support — gives the trade breathing room)
• Take Profit (TP): $262.56 (Aligned with horizontal resistance and measured move target)
Risk-to-Reward Ratio: 2.91
Potential Reward: +50%
Potential Risk: -17%
This trade setup is not only favorable from a risk/reward standpoint but also follows price structure, trend, and technical confirmation.
🧠 Final Thoughts
Solana (SOL) on the daily chart has shifted into a clearly bullish phase after a textbook breakout from its multi-month downtrend. The current setup shows a healthy trend structure, room for price expansion, and favorable technicals across the board. The next key breakout will likely occur above $180, and that can send SOL quickly into the $240–$260 range. If you're looking to ride a swing position into Q2-Q3, this is one of the cleaner long setups currently on major altcoins.
SOLUSDT.PS trade ideas
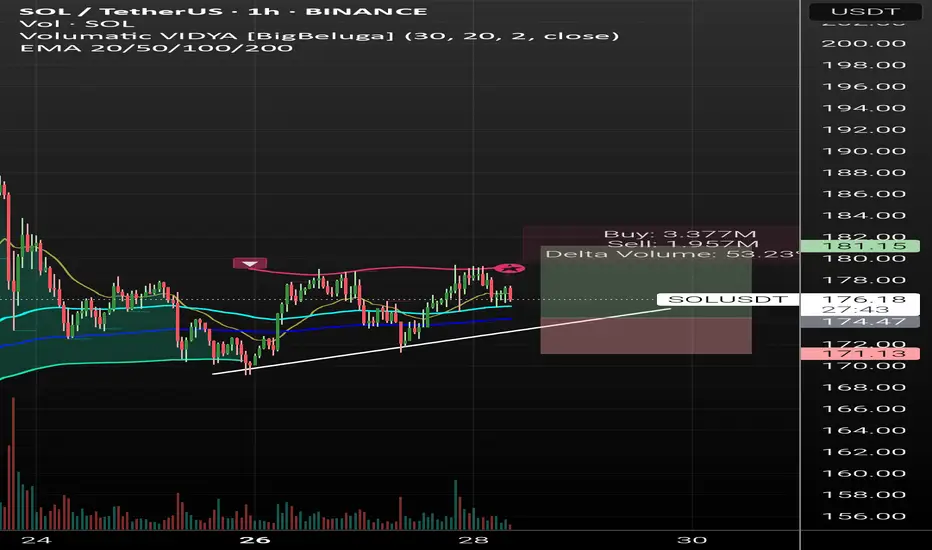
SOL/USDT Analysis – 1H Timeframe🟩 Entry: $174.00
🟥 Stop Loss: $171.13
🎯 Take Profit: $181.15
📈 R:R Ratio: ~2.4:1
Technical View:
Price respects ascending trendline support.
Entry near EMA100/200 confluence – strong technical demand zone.
Delta Volume +53.5% shows aggressive buyers.
EMA20/50/100/200 stacked upward → bullish structure.
Fundamental Bias:
$1B funding from SOL Strategies boosts institutional confidence.
Capital rotation signals long-term support for Solana ecosystem.
Market likely to price in bullish sentiment → supports long bias.
✅ Setup aligns technically and fundamentally. Justified long.
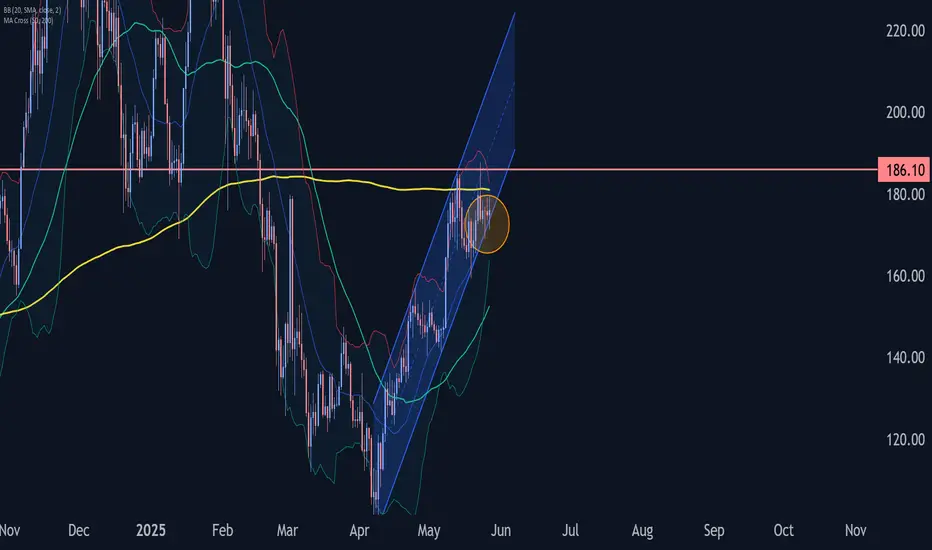
Solana Wave Analysis – 27 May 2025
- Solana rising inside daily up channel
- Likely to reach resistance level 186.10
Solana cryptocurrency recently reversed up from the support trendline of the daily up channel from the start of April (coinciding with the 20-day moving average).
The upward reversal from this support trendline continues the active impulse wave 3 of the intermediate impulse wave (3) from last month.
Solana cryptocurrency can be expected to rise to the next resistance level 186.10, which stopped the previous impulse wave 1 in the middle of May.
SOL Contract Expiry BreakdownChart shows how SOLANA is on trend with contract expiries that show a surge or breakdowns near, at, and after expirations. DYOR and make informed choices

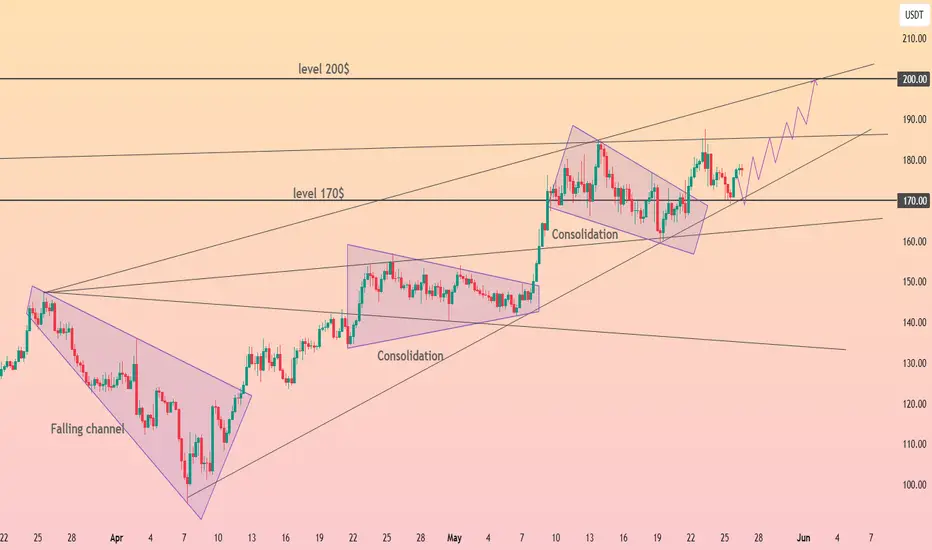
HolderStat┆SOLUSD channeling the sun toward $200CRYPTOCAP:SOL — After escaping a falling channel, price is tracking a neat growing channel between 170$ pivot and 200$ overhead resistance. Repeated consolidation diamonds reinforce upward trajectory and signal strength. Watch 160-165$ baseline—above it, 195-200$ target remains on radar.
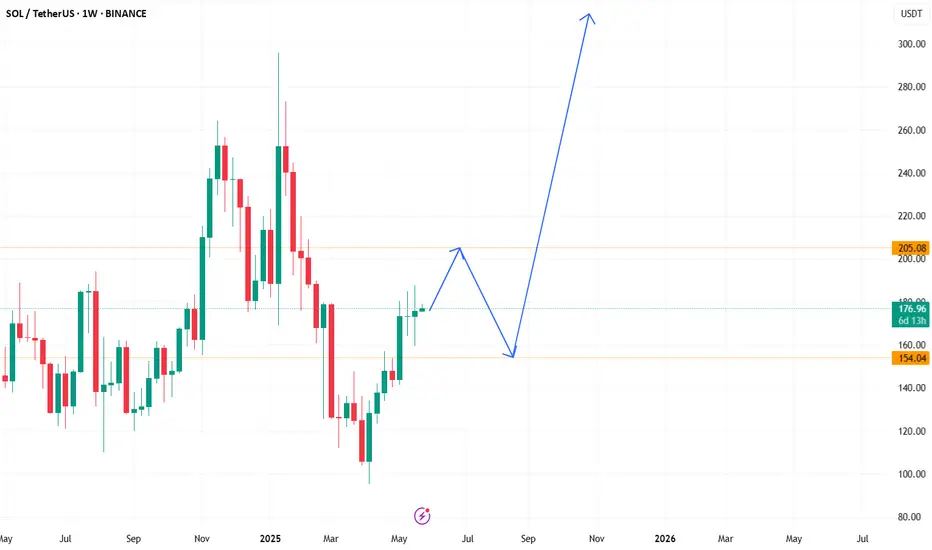
Solana summer approachingSOL moving sideways into resistance area with higher highs and higher lows, blow off to $200+ before a pullback to 150$ zone

Solana Short Term PossibilitiesBINANCE:SOLUSDT.P
I am sharing this analysis for myself, it is not investment advice.
Solana has a minor bullish trend and I think we are in a cricitical zone. İf solana go with the channel and pass its last peak we see 202.5 firstly. İf Solana break the channel there is a possibilty 160 support can hold us but if we break the 160, then the bearish move can go deeper.
Solana has broken out!The neckline was broken with a strong bullish candle.
After the breakout, price is currently retesting the neckline.
This area also aligns with previous structure and trendline breakout, strengthening the case for a bullish continuation.
Two possible bullish scenarios are outlined:
🔸 A direct continuation from current levels
🔹A deeper retest of the FVG zone before resuming the uptrend
📈 Target projection: Based on the height of the inverse H&S pattern, the potential upside targets the $260–$270 area.
📉 Invalidation: A clean break below the FVG zone (~$162) would invalidate the setup and suggest a deeper retracement.
Overall, the structure remains bullish until proven otherwise. Watching the next daily closes for confirmation.

SOLANASOLANA,on strong ecosystem application has shown a strong resilience and return to the demand floor after the price adopted a descending trendline as support floor.a break of the current daily roof will be buy confirmation

SOL Crypto Futures Trade Plan 2025-05-26SOL Crypto Analysis Summary (2025-05-26)
Model Summaries
Grok/xAI Report
Technical: Price $176.77 above 20/50-day MAs but below 200-day SMA. RSI 60.6 (neutral-bullish). MACD shows slight bearish divergence. Bollinger bands suggest price near upper band. Sentiment: Limited positive news impact from luxury watch integration. Neutral funding rate. View: Moderately Bullish (75% confidence). Trade: Long at $177.50, SL $171.00, TP $183.00, 50× leverage, 1% equity position.
Claude/Anthropic Report
Technical: Similar MA and RSI readings; below 200-day SMA. Bollinger bands point to moderate volatility. Sentiment: Balanced funding rate; positive branding news but limited price impact. View: Moderately Bullish. Confidence 72%, below threshold—no trade recommended.
Llama/Meta Report
Technical & Sentiment: Aligns with Grok on MAs, RSI, Bollinger. Neutral overall market backdrop. View: Moderately Bullish (80% confidence). Trade: Long at $176.77, SL $171.74, TP $186.48, 75× leverage, 0.5% equity.
Gemini/Google Report
Technical: Bullish on short-term MAs and RSI but MACD bearish crossover and resistance at 200-day SMA. Sentiment: Neutral funding, niche positive news. View: Moderately Bearish short term (75% confidence). Trade: Short at $176.77, SL $179.50, TP $169.00, high leverage, size 1.
DeepSeek Report
Technical & Sentiment: Highlights 200-day SMA resistance and MACD divergence after 18.5% monthly rally. View: Bearish (75% confidence). Trade: Short at $176.77, SL $181.00, TP $171.74, size 1. Areas of Agreement and Disagreement
Agreement
Price is above the 20/50-day moving averages. RSI (~60) indicates healthy, not overbought conditions. Key resistance near the 200-day SMA (~$181) and upper Bollinger Band (~$186.5). Funding rates are neutral; no extreme positioning. Luxury watch news is a mild positive but not a strong market mover.
Disagreement
Directional bias: Three models lean moderately bullish (Grok, Claude, Llama), two bearish (Gemini, DeepSeek). Trade triggers: Bullish models target breakouts above current price; bearish models emphasize MACD crossover and 200-day SMA rejection. Position sizing and risk thresholds vary widely (1% equity vs. 0.5% vs. full contract). Conclusion
Overall Market Direction Consensus: Moderately Bullish Recommended Trade: Long SOL futures
Entry Range: 177.50 (to confirm continued upside momentum) Stop Loss: 171.00 (just below 20-day SMA) Take Profit: 183.00 (near upper Bollinger Band resistance) Position Size: 1 contract (≈1% of equity at 50× leverage) Confidence Level: 73% Key Risks and Considerations: MACD bearish divergence could trigger a short-term pullback. Strong resistance at the 200-day SMA (~$181) and upper Bollinger band. Correlation with BTC/ETH and broader crypto market swings. Volatility spikes can induce slippage—strict risk management required. TRADE_DETAILS (JSON Format)
{ "instrument": "SOL", "direction": "long", "entry_price": 177.50, "stop_loss": 171.00, "take_profit": 183.00, "size": 1, "confidence": 0.73, "entry_timing": "market_open" }
📊 TRADE DETAILS 📊 🎯 Instrument: SOL 📈 Direction: LONG 💰 Entry Price: 177.5 🛑 Stop Loss: 171.0 🎯 Take Profit: 183.0 📊 Size: 1 💪 Confidence: 73% ⏰ Entry Timing: market_open
Disclaimer: This newsletter is not trading or investment advice but for general informational purposes only. This newsletter represents my personal opinions based on proprietary research which I am sharing publicly as my personal blog. Futures, stocks, and options trading of any kind involves a lot of risk. No guarantee of any profit whatsoever is made. In fact, you may lose everything you have. So be very careful. I guarantee no profit whatsoever, You assume the entire cost and risk of any trading or investing activities you choose to undertake. You are solely responsible for making your own investment decisions. Owners/authors of this newsletter, its representatives, its principals, its moderators, and its members, are NOT registered as securities broker-dealers or investment advisors either with the U.S. Securities and Exchange Commission, CFTC, or with any other securities/regulatory authority. Consult with a registered investment advisor, broker-dealer, and/or financial advisor. By reading and using this newsletter or any of my publications, you are agreeing to these terms. Any screenshots used here are courtesy of TradingView. I am just an end user with no affiliations with them. Information and quotes shared in this blog can be 100% wrong. Markets are risky and can go to 0 at any time. Furthermore, you will not share or copy any content in this blog as it is the authors' IP. By reading this blog, you accept these terms of conditions and acknowledge I am sharing this blog as my personal trading journal, nothing more.

SOL to $200+ over the next daysSOL moving sideways at resistance area which higher lows and higher highs, means some big breakout about to happen
SOL/USDT Analysis (1H Timeframe)
Solana has shown a strong bullish reversal from the support zone around $170, forming a parabolic curve pattern, which often indicates strong bullish momentum.
Trend: Bullish, with steep upward movement and consistent higher highs and higher lows.
Support: The breakout level near $176.65 can act as a new support if price pulls back.
Immediate Resistance: Price is currently testing the $177.67 – $179.93 supply zone. A breakout above this could push SOL towards the next resistance at $180.47, and eventually towards the $186 – $188 zone.
Bias: Bullish continuation is likely if the current resistance is broken with volume. However, temporary rejection or consolidation is also possible here.

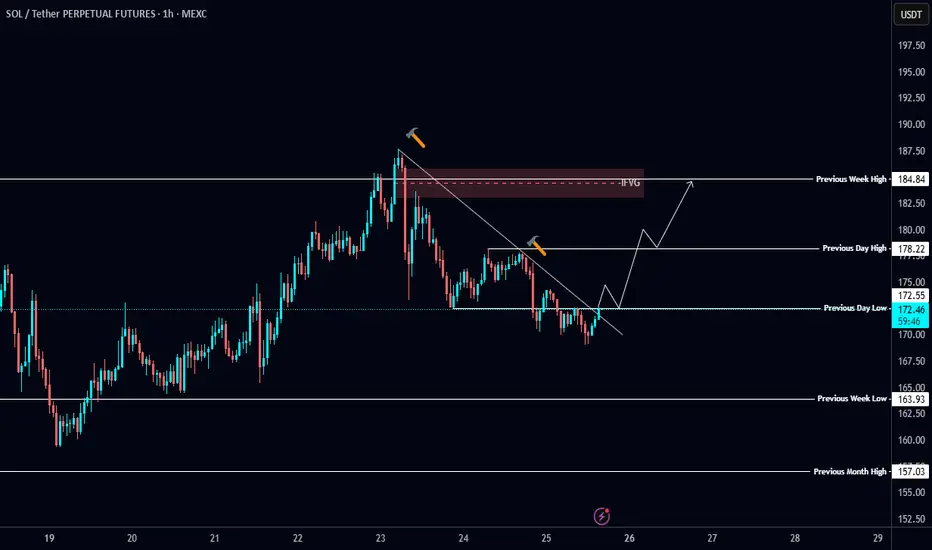
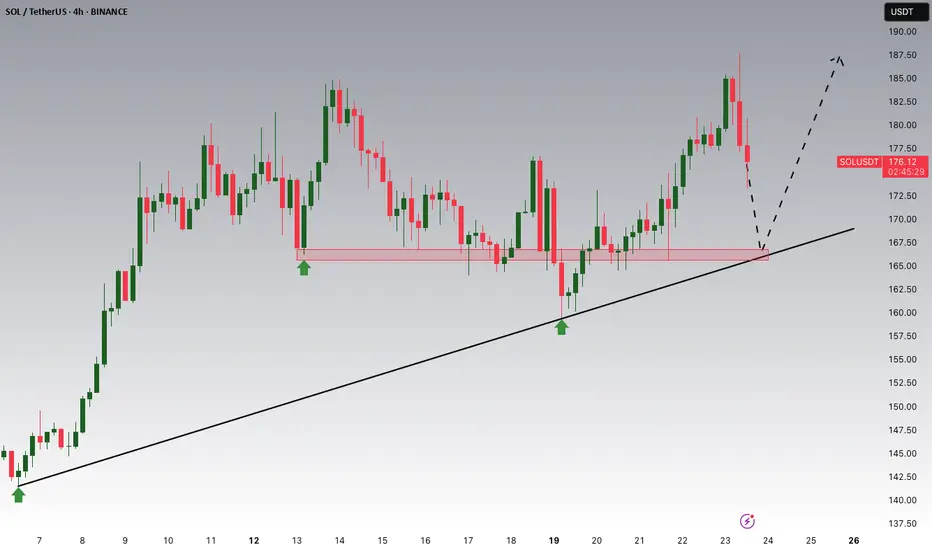
$SOL Breakout Watch📈 CRYPTOCAP:SOL Breakout Watch 📈
#SOL is breaking the 1H diagonal trendline — eyes on PDL at $172.6 🚨
Want to see it reclaimed + retested as support for a long entry 🎯
Local resistance = PWH at $184.84
Let it reclaim, then ride the wave 🌊
Solana's fate: pump or dump ?Hello friends
You see that Solana, after its good growth, got stuck in a range and is gathering strength. Now, considering the strong upward trend of this currency, it can be said that this force can push the price upwards, but everything is possible in the market, so observe capital management and trade with your will and wisdom.
*Trade safely with us*
Alert!! Very very strong bearish trend is coming!!If macd in daily timeframe crosses and confirm bearish trend it it may goes down below 96$!! I will let you know the confirmation in ideas. So please follow me to get notified when its happen!
Solana Potential UpsidesHey Traders, in today's trading session we are monitoring SOL/USDT for a buying opportunity around 166 zone, SOL/USDT is trading in an uptrend and currently is in a correction phase in which it is approaching the trend at 166 support and resistance area.
Trade safe, Joe.

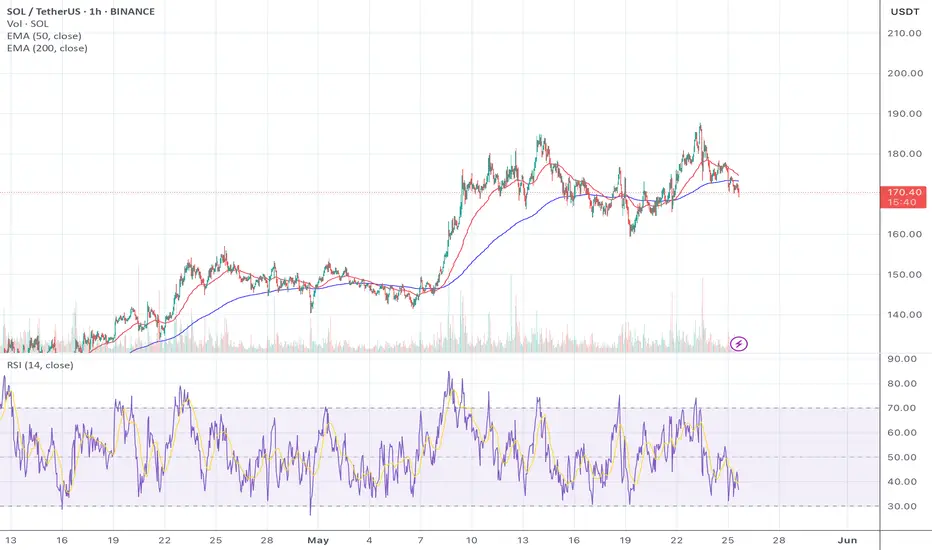
Solana updateSolana (SOL) is testing key support levels after a strong rally earlier in May. Price has dipped below the 50 EMA while staying just above the 200 EMA, signaling potential consolidation or reversal territory. RSI is showing early signs of bullish divergence, hovering near the 40 level. This setup could indicate either an upcoming bounce or deeper correction, depending on volume and trend confirmation.
Indicators:
EMA 50 / EMA 200 crossover watched closely
RSI 14 showing volatility near oversold
1H timeframe (Binance spot chart)
Solana | SOL spot TRADE SETUP +65%Firstly, let's look at the SOL chart from a larger view to confirm the agreement for a bullish setup.
What we see above is a clear bullish bottom, followed by a sharp V-Shaped recovery in the daily timeframe.
From here, the ideal entry could be within this zone, either dollar-cost average or just one spot buy:
With the STOP-LOSS around here:
And THREE TP (take profit) points:
1️⃣
2️⃣
3️⃣
Naturally with the timeframe of your HOLD increasing as your target moves higher.
_________________________
BINANCE:SOLUSDT

SOLANAKey Drivers of Solana (SOL) Price Action in 2025
Network Usage and Adoption
Growing adoption in DeFi (Decentralized Finance) and NFT (Non-Fungible Token) sectors is a major price driver. Increased transaction volume and new dApps boost demand for SOL tokens.
Institutional interest and partnerships, such as Visa’s integration of Solana for USD Coin (USDC) payments, enhance credibility and usage.
Technological Progress
Solana’s high transaction speed and low fees remain competitive advantages over Ethereum and other blockchains.
Ongoing improvements in scalability, security, and infrastructure (e.g., Solana-based smartphones, integration with financial systems) support long-term growth.
Upgrades that improve network reliability and reduce outages are crucial, as past network insability has posed risks.
Market Sentiment and Investor Confidence
Positive news, such as new partnerships, product launches, or regulatory clarity, can boost investor confidence and drive price rallies.
Conversely, regulatory pressures, macroeconomic uncertainties, or network security concerns can trigger sell-offs or price stagnation.
Competition and Macro Risks
Competition from Ethereum, Layer 2 solutions, and other fast blockchains poses a challenge to Solana’s market share and price appreciation.
Broader crypto market trends and macroeconomic factors (interest rates, inflation, USD strength) influence overall sentiment and liquidity.
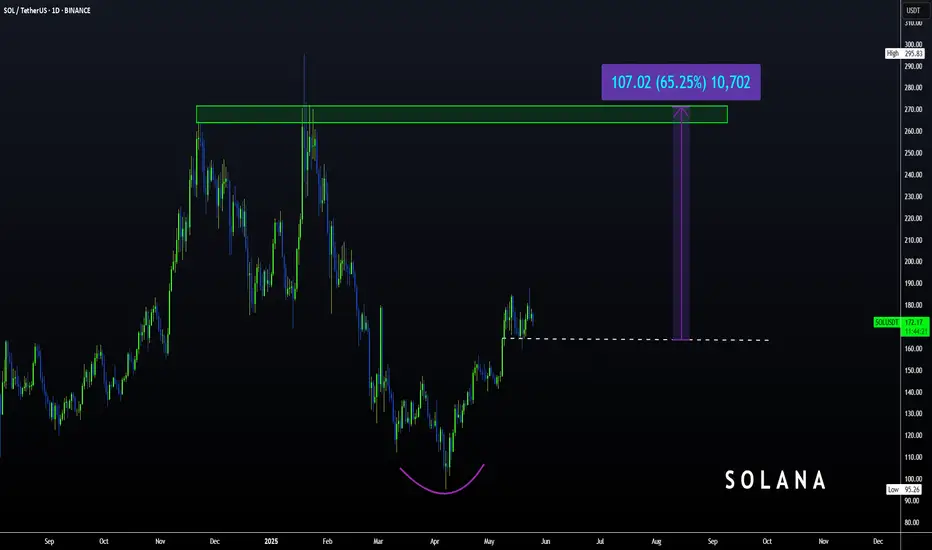
Longer-term bullish forecasts see Solana reaching $270–$280 by September 2025 and possibly exceeding $350–$370 by year-end, driven by ecosystem growth and institutional adoption.
Technical indicators suggest potential consolidation phases with possible breakouts if momentum builds.
Summary Table
Driver Impact on Solana Price
Network adoption (DeFi, NFTs) Increases demand and price
Technological upgrades Enhances scalability and reliability
Institutional interest Boosts liquidity and investor confidence
Market sentiment & news Drives short-term volatility
Competition & macro risks Can limit upside or cause corrections
Technical support/resistance Guides price action and breakout points
Conclusion
Solana’s price action in 2025 is primarily driven by network usage growth, technological improvements, and institutional adoption, balanced against competition and macroeconomic uncertainties. Positive developments in DeFi, NFTs, and partnerships support bullish scenarios, while regulatory and security risks pose downside challenges. Technical analysis suggests key price levels to watch for potential breakouts or corrections throughout the year.


SOL - SOLANA Daily Chart🧠 Chart Summary (SOL on 1D / Binance / Heikin Ashi):
🔍 1. Recent Price Action:
- Price has been rallying from the $115-$120 support zone since early April.
- A Break of Structure (BOS) occurred around late April — a bullish sign.
- After the BOS, SOL pushed up into the $170–$180 zone, which is acting as short-term resistance now.
- Price is consolidating around $172, forming a range.
🔴 2. Key Zones:
- Resistance (Red Zone): $190 – $200 → Last strong supply zone; price rejected from here in February.
- Support (Blue Zone): $150 – $160 → Previous breakout area and recent BOS level.
- Major Support (Deep Blue Zone): $95 → Labeled as "Weak Low" – if SOL crashes below this, trend shifts bearish.
📉 3. Indicators:
Stochastic RSI: Overbought and curling down → momentum could slow.
Volume: Decreasing as price consolidates → possible upcoming volatility.
⚠️ 4. What to Watch Next:
A break and close above $180–$185 could send SOL toward the $200–$220 zone.
If it drops below $160, expect a possible retest of the $140–$150 support.
Stochastic cooling may lead to short-term retracement before another leg up.
🧾 TL;DR:
SOL is consolidating near resistance after a strong rally. Bulls need a breakout above $185 to stay in control. A dip toward $150 wouldn’t break the trend but could be a better re-entry point.
------------------
------------------
Other Low Market Cap #RWA #RealEstate #Tokenization Platforms by FDV
SQRB $100K on PROBIT
$RNB $310K
$HTS $1.9M
$STBU $3.5M
LAND $3.6M
-----
Not for recommendations to BUY SELL any stocks, cryptos, FX or securities
Not for Financial Advise
DYOR
