SOL Both scenarios are valid! SOL is still bullishSOL Both scenarios are valid! SOL is still bullish
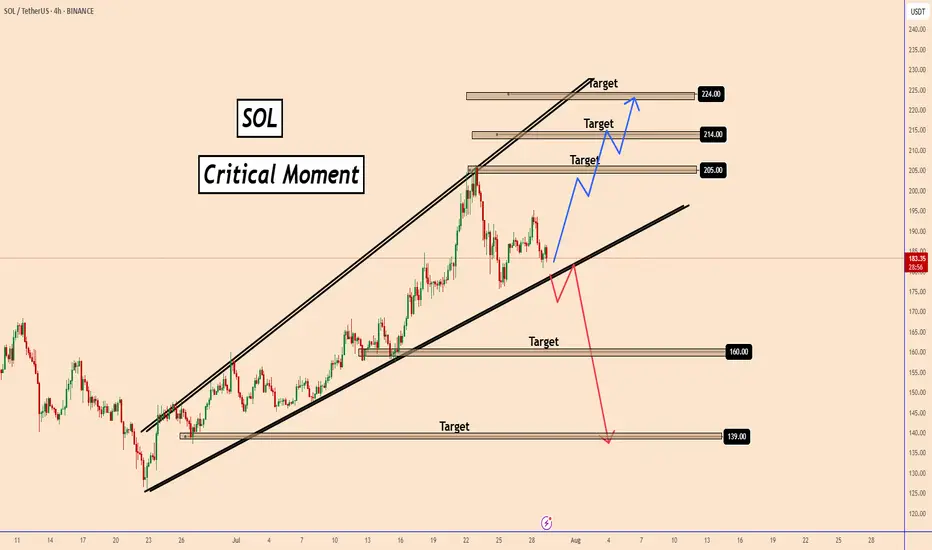
SOL is in a critical zone. The price is still inside a large bullish pattern and as long as it stays inside the pattern, the trend remains bullish and SOL should follow the bullish scenario.
The bullish targets are at 205, 214 and 224
It may happ
Related pairs
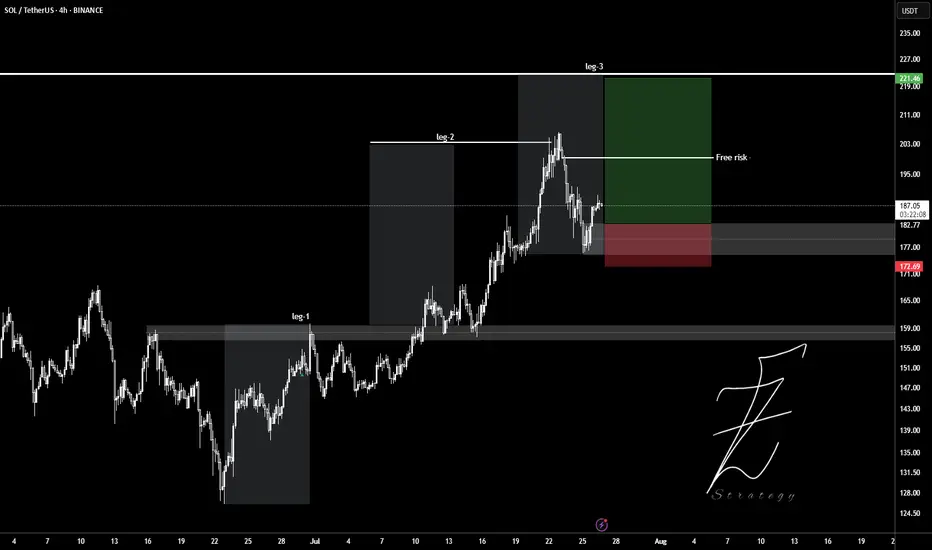
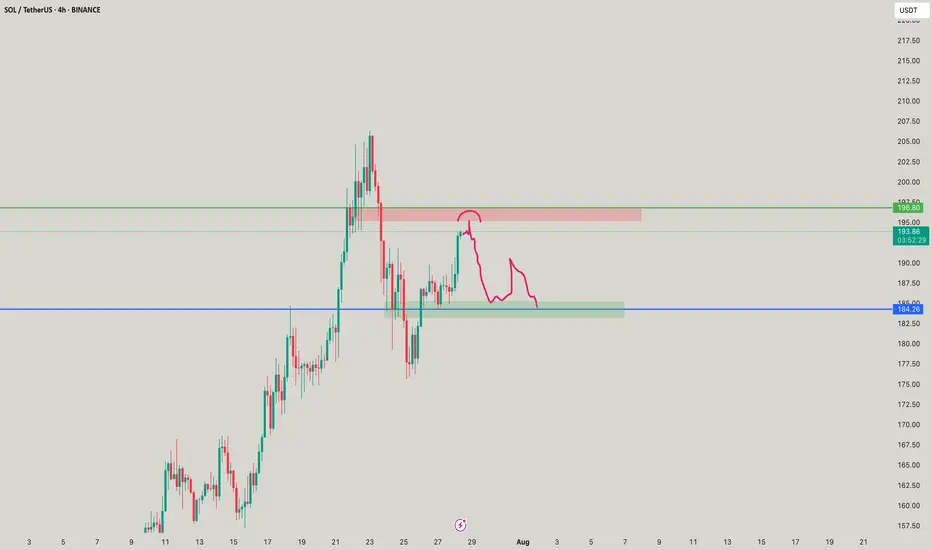
SOLUSDTWait for pollback to 180$ level and ready to get buy position.
Target set in leg2 and leg3.
Entry: 182
Stop: 177
Tp: 190 - 200 - 210 - 220
Please control Risk management.
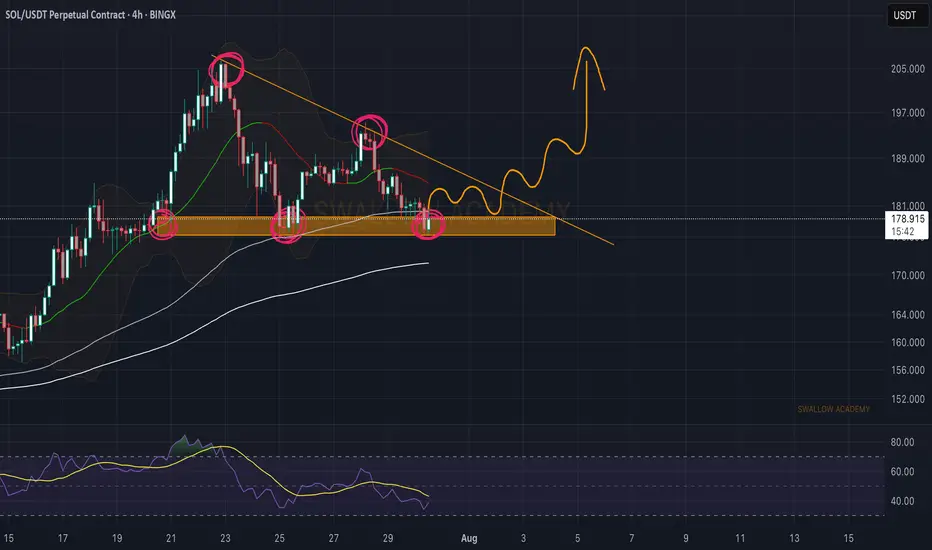
Solana (SOL): Triangle Pattern | Waiting For Bullish BreakoutSolana failed to break down from the local neckline zone (or support zone, for those who want to call it that). What we got instead is buyside dominance, where buyers took back the area and are now pushing the price back toward the upper side of that triangle pattern, so that's where our current tar
SOL/USDT - 15MINrice swept previous lows, formed a double bottom with bullish RSI divergence, and is now consolidating above the sweep zone. If support holds, we may see a rally into the internal liquidity zone around $191. Keep an eye on structure and volume confirmation for the next leg up.

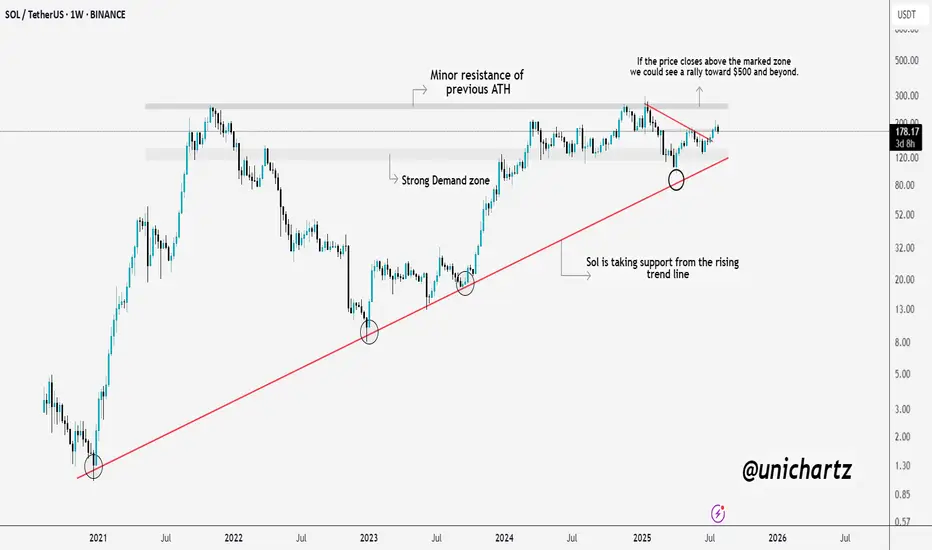
Massive Move Loading? $SOL Prepping for a BreakoutSolana is showing real strength here.
CRYPTOCAP:SOL consistently taking support from the long-term rising trendline, a sign that buyers are defending key levels. We're also approaching a critical resistance zone, which was the previous ATH area.
If SOL manages to close above this zone, we could
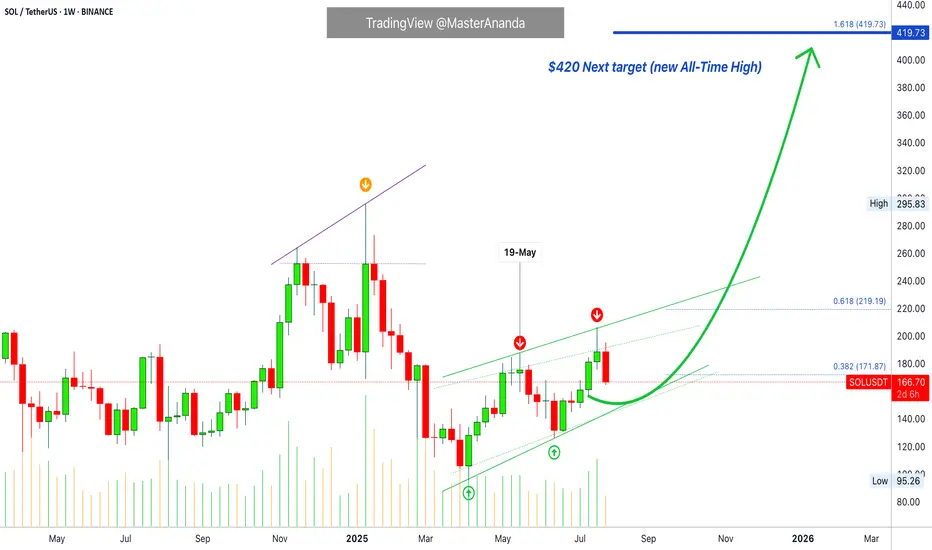
Solana Update · Retrace, Bears & The Bullish BiasSolana had a retrace in May. Notice the 19-May date on the chart. This retrace produced four weeks red. The bullish move that led to this retrace lasted 6 weeks. The last rise lasted five weeks and the current retrace might last only two weeks, can be less.
We are seeing Solana rising but this rise
FUTURES SIGNALFUTURES SIGNAL
Coin: SOL
Direction: LONG
🟢Input range: 179,5-179,7
✔️ТР: 182,47
❌SL: 178,11
Hedge scalp long after liquidity withdrawal. Target order block at 182.4. Stop behind PDL

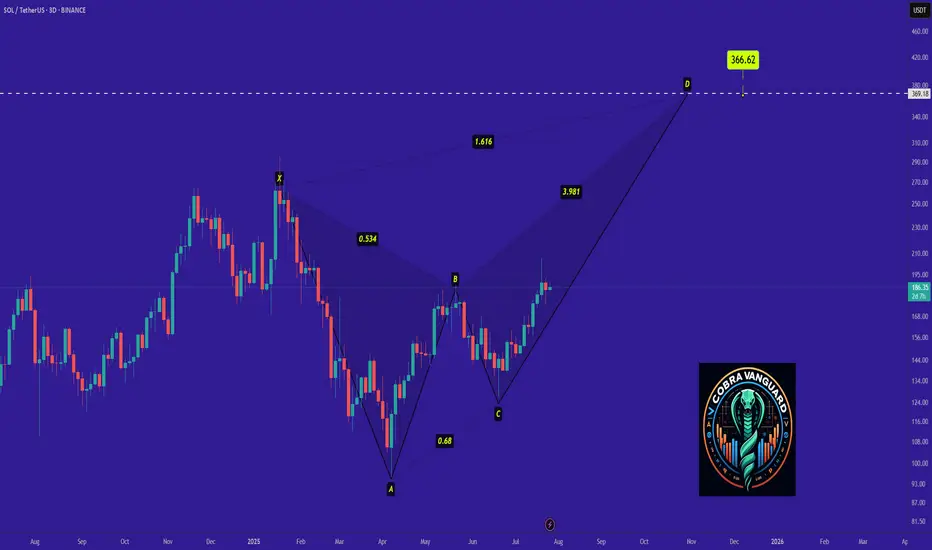
SOL - Time to buy again! (Update)Be careful with SOL !!!
we can hope that the price will act like a Crab pattern and the price will grow well.
I expect that the price will grow very quickly...
DeGRAM | SOLUSD is holding the $177 level📊 Technical Analysis
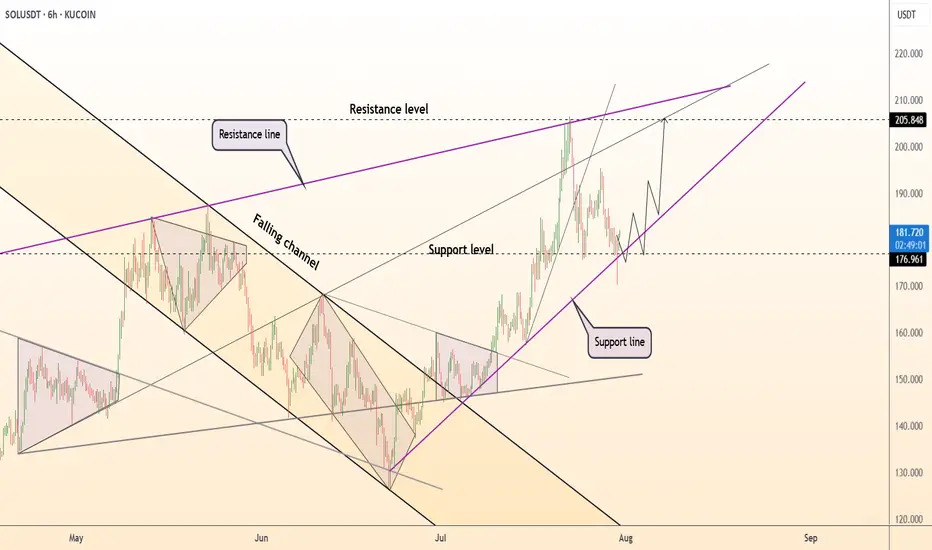
● SOLUSD is bouncing from the rising trendline support at 177 after a retracement, maintaining structure within a bullish ascending wedge.
● Price holds above the prior resistance-turned-support near 176.9, with a clear path to retest the 205.8 and 219–222 confluence zone.
💡
SOL - YOUR Choice of SOUL! LOLSOL as usual, pretty straight forward, short on the red, buy on the green, lines abbreviated for you to understand where
See all ideas
Summarizing what the indicators are suggesting.
Oscillators
Neutral
SellBuy
Strong sellStrong buy
Strong sellSellNeutralBuyStrong buy
Oscillators
Neutral
SellBuy
Strong sellStrong buy
Strong sellSellNeutralBuyStrong buy
Summary
Neutral
SellBuy
Strong sellStrong buy
Strong sellSellNeutralBuyStrong buy
Summary
Neutral
SellBuy
Strong sellStrong buy
Strong sellSellNeutralBuyStrong buy
Summary
Neutral
SellBuy
Strong sellStrong buy
Strong sellSellNeutralBuyStrong buy
Moving Averages
Neutral
SellBuy
Strong sellStrong buy
Strong sellSellNeutralBuyStrong buy
Moving Averages
Neutral
SellBuy
Strong sellStrong buy
Strong sellSellNeutralBuyStrong buy
Displays a symbol's price movements over previous years to identify recurring trends.
Frequently Asked Questions
The current price of SOL / TetherUS (SOL) is 164.55 USDT — it has fallen −3.28% in the past 24 hours. Try placing this info into the context by checking out what coins are also gaining and losing at the moment and seeing SOL price chart.
SOL / TetherUS price has fallen by −8.90% over the last week, its month performance shows a 13.43% increase, and as for the last year, SOL / TetherUS has decreased by −1.68%. See more dynamics on SOL price chart.
Keep track of coins' changes with our Crypto Coins Heatmap.
Keep track of coins' changes with our Crypto Coins Heatmap.
SOL / TetherUS (SOL) reached its highest price on Jan 19, 2025 — it amounted to 295.83 USDT. Find more insights on the SOL price chart.
See the list of crypto gainers and choose what best fits your strategy.
See the list of crypto gainers and choose what best fits your strategy.
SOL / TetherUS (SOL) reached the lowest price of 1.03 USDT on Dec 23, 2020. View more SOL / TetherUS dynamics on the price chart.
See the list of crypto losers to find unexpected opportunities.
See the list of crypto losers to find unexpected opportunities.
The safest choice when buying SOL is to go to a well-known crypto exchange. Some of the popular names are Binance, Coinbase, Kraken. But you'll have to find a reliable broker and create an account first. You can trade SOL right from TradingView charts — just choose a broker and connect to your account.
Crypto markets are famous for their volatility, so one should study all the available stats before adding crypto assets to their portfolio. Very often it's technical analysis that comes in handy. We prepared technical ratings for SOL / TetherUS (SOL): today its technical analysis shows the neutral signal, and according to the 1 week rating SOL shows the buy signal. And you'd better dig deeper and study 1 month rating too — it's buy. Find inspiration in SOL / TetherUS trading ideas and keep track of what's moving crypto markets with our crypto news feed.
SOL / TetherUS (SOL) is just as reliable as any other crypto asset — this corner of the world market is highly volatile. Today, for instance, SOL / TetherUS is estimated as 2.15% volatile. The only thing it means is that you must prepare and examine all available information before making a decision. And if you're not sure about SOL / TetherUS, you can find more inspiration in our curated watchlists.
You can discuss SOL / TetherUS (SOL) with other users in our public chats, Minds or in the comments to Ideas.