SOLANA Loves THIS Pattern | BULLISHSolana usually increases alongside ETH. Possible because its a big competitor.
We can see SOL follows ETH very closely, with the exception of dipping earlier than ETH by a week:
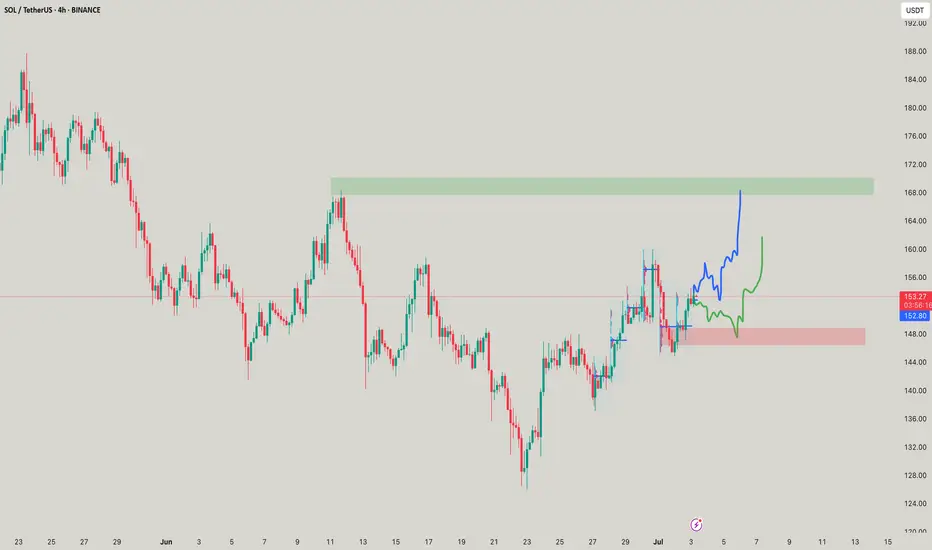
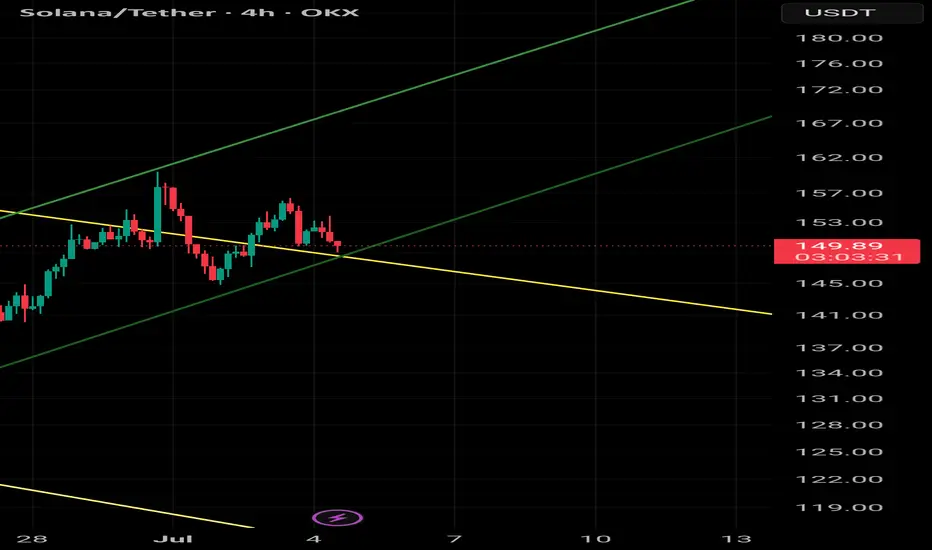
In the 4h, we see a push to breakout above the neckline resistance:
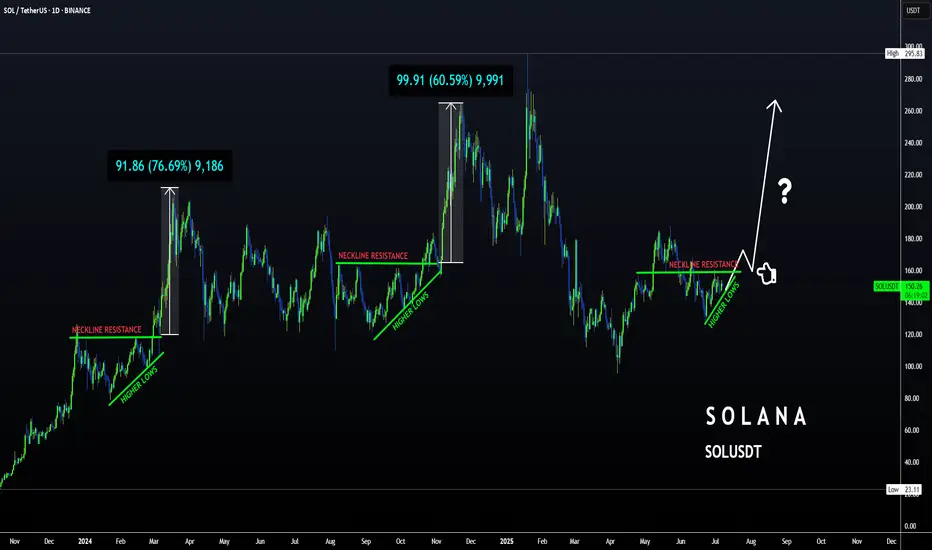
In the daily timeframe, SOL is just about to break out above the moving averages - which would be the final confirmation of a bullish impulse to come:
Could this pattern be the confirmation of the start of another big pump for SOL?
_______________________
BINANCE:SOLUSDT
SOLUSDT trade ideas
80% drop into the abyss for Solana? - July 2025** The months ahead **
Examination of the 3-week chart for SOLANA reveals several compelling technical signals that suggest a potential bearish trend reversal. This analysis highlights crucial patterns traders and investors of Solana should consider.
1. Formation of a 3-Week Death Cross:
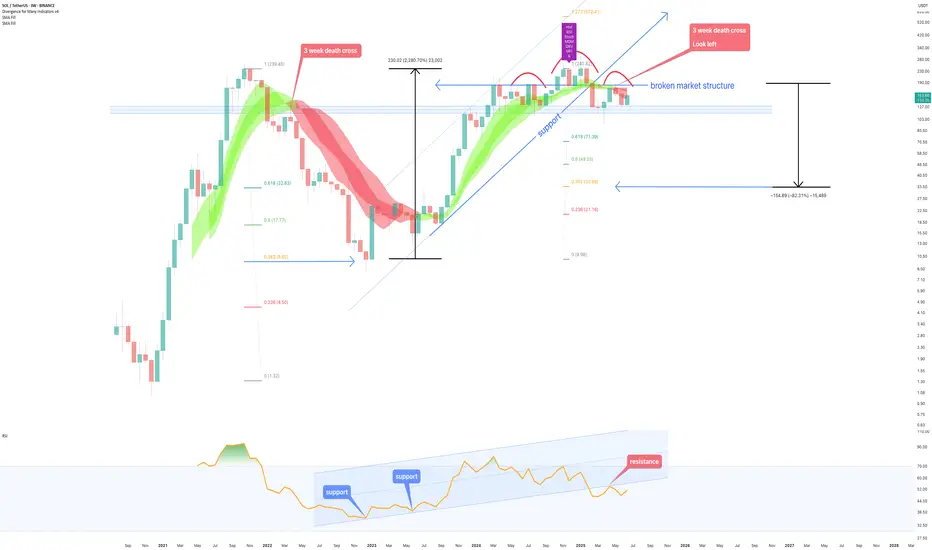
A notable bearish signal prints on the chart: a ‘3-week death cross’. This follows a ‘2-week death cross’ that preceded a significant downward movement, just as in early 2022. The death cross, where a shorter-term moving average crosses below a longer-term one, is a strong indicator of a shift towards a bearish trend, especially on higher timeframes like this 3-week chart.
2. Broken Market Structure:
The chart clearly indicates a “broken market structure.” This typically occurs when the price fails to create higher highs and higher lows during an uptrend, or in this case, breaks below a significant support level that had previously held. It is absolutely possible price action backtests past support for a resistance confirmation, however on looking left, such a test never occurred on the last death cross.
3. Resistance from Previous Peaks (Head and Shoulders Pattern):
Price action leading up to the recent highs resembles a potential ‘Head and Shoulders’ pattern. The three distinct peaks, with the middle peak being the highest, suggest a classic reversal pattern. A subsequent break below the ‘neckline’ (implied support level below the peaks) would confirm the bearish outlook.
4. RSI Oscillator (bottom of chart) resistance
The lower panel of the chart displays an RSI oscillator indicator, which shows a clear pattern of "resistance." following a period of support since 2023. The RSI has clearly confirmed resistance from almost 3 years of support.
5. Solana vs Bitcoin
All the bearish observations made on the SOL-USD trading pair can be observed on the same 3 week time frame for the SOLANA - BITCOIN trading pair:
6. Potential for Significant Downside Target:
Based on the measured move from the previous death cross and breakdown and Fibonacci extension, the chart illustrates a potential downside target of approximately -70% from current levels toward the $30-40 area. While this is a projected target and not guaranteed, the historical precedent following similar bearish signals provides a context for the potential severity of the downturn if the bearish momentum continues.
Conclusion:
Considering the confluence of a 3-week death cross, broken market structure, resistance from previous peaks (suggesting a potential Head and Shoulders pattern), and the confirmation of RSI resistance, the outlook for SOLANA on the 3-week timeframe appears distinctly bearish.
Is it possible price action continues upwards after a 3200% rally? Sure.
Is it probable? No
Ww
SOLANA → Pre-breakdown consolidation may lead to distributionBINANCE:SOLUSDT is declining and testing the support of the trading range as Bitcoin pauses after strong growth and enters a correction phase...
SOL looks a bit weaker than Bitcoin technically, but SOLANA has some positive fundamentals, though that might not be enough.
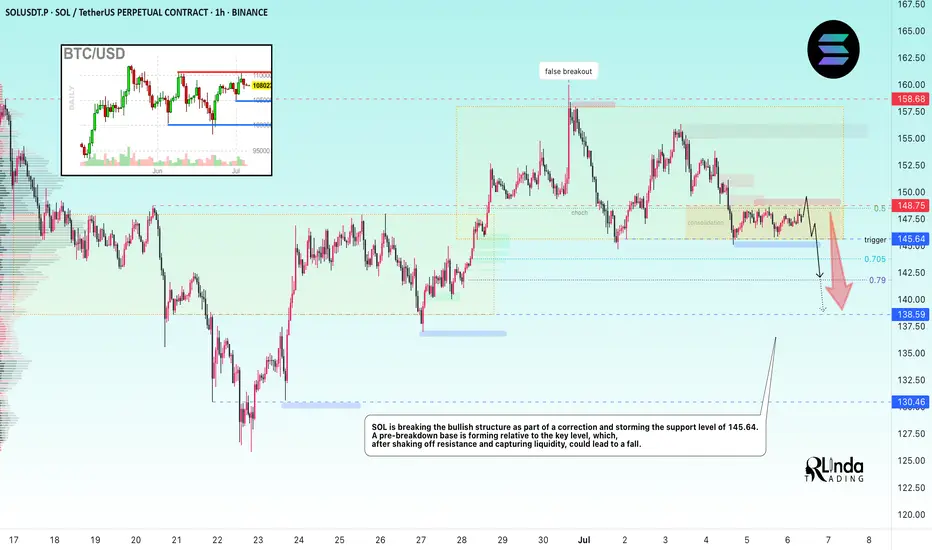
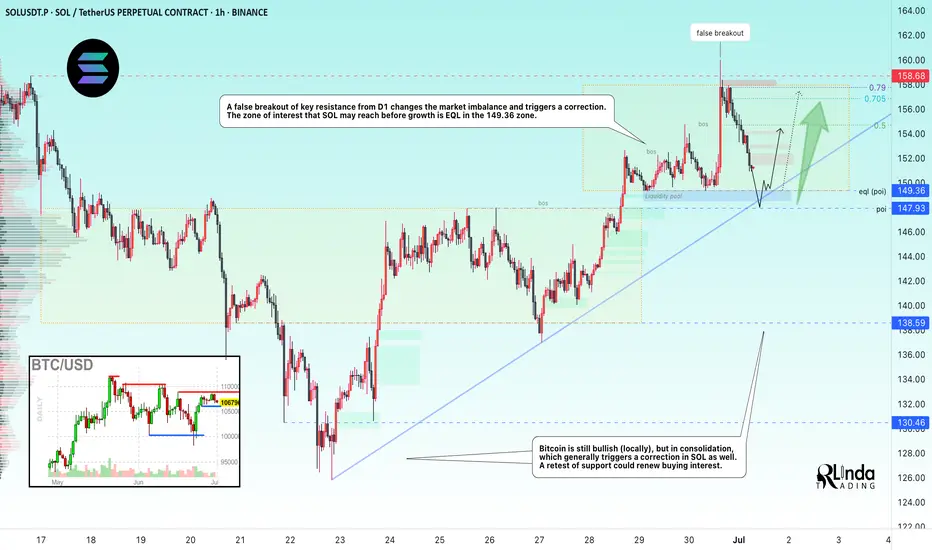
After forming a false breakout of key daily resistance, Bitcoin is moving into a correction phase. An update of local lows on the chart could trigger a drop across the entire cryptocurrency market.
In SOL, the focus is on the two nearest levels of 148.75 and 145.64. A breakdown of support could trigger the distribution of accumulated energy within the specified range as part of a downward momentum.
Resistance levels: 148.75, 151.2, 153.88
Support levels: 145.64, 138.59
The ideal scenario would be a false breakout of 148.75 (liquidity capture) and a retest of 145.64, followed by a break of support. Consolidation below 145.65 could trigger a drop to the zone of interest at 138.59.
Best regards, R. Linda!
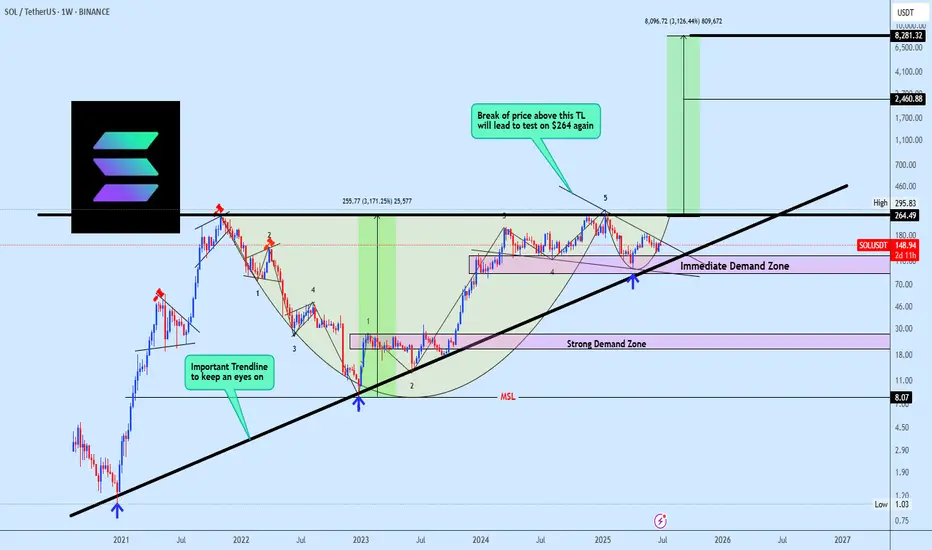
SOLUSDT Holding Long Term Trendline SupportSOLUSDT continues to show strong bullish structure, with price consistently holding above a multi-year ascending trendline a key structural element that has defined its uptrend. This dynamic support has anchored price action within a broader ascending formation, reflecting steady long-term accumulation.
Additionally, the chart reveals a well defined Cup and Handle formation, further reinforcing the bullish outlook. As long as price respects the immediate demand zone, this area remains a prime region for re-accumulation, with expectations for it to hold as a firm support level.
The projected target for this setup is clearly illustrated on the chart, aligning with the broader bullish continuation narrative.
Share your view, do you see SOLUSDT pushing higher from here, or is a deeper retest likely before the breakout?
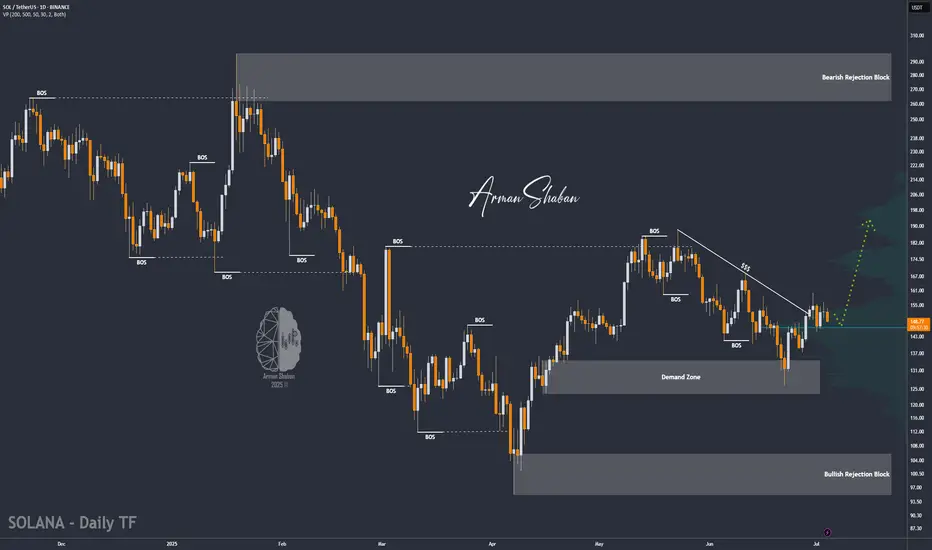
SOL/USDT : Strong Bullish Move Ahead?By analyzing the #Solana chart on the daily timeframe, we can see that the price is currently trading around $149.62. If the price holds above the key level of $146.28, we could expect the beginning of a strong bullish wave, potentially delivering over 25% short-term returns.
If this scenario plays out, the next bullish targets are $168.50, $187, $220, and $263.
(Personal research is strongly recommended for long-term investment decisions.)
Please support me with your likes and comments to motivate me to share more analysis with you and share your opinion about the possible trend of this chart with me !
Best Regards , Arman Shaban
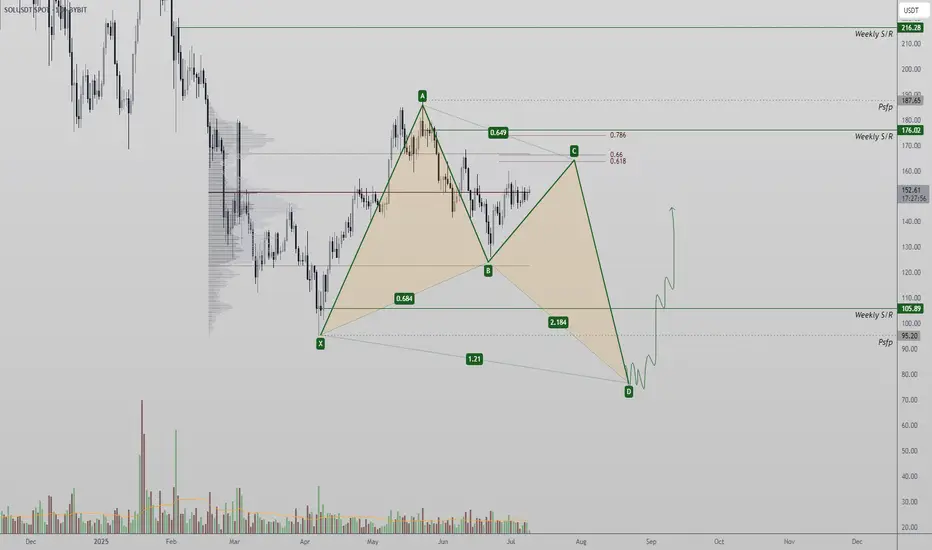
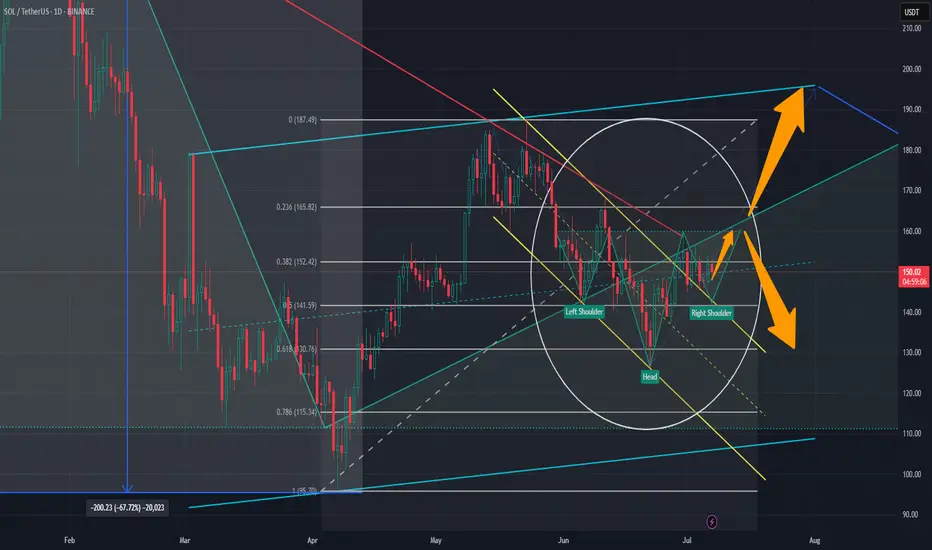
SOL Harmonic Setup — $95 Sweep May Precede Rally Toward $200 +Solana may be forming a rare bullish harmonic pattern, suggesting a possible sweep of the $95 low before a reversal targets the $200 region. Critical resistance levels remain key in the short term.
Solana is showing early signs of a high-probability harmonic setup that could lead to a powerful bullish reversal — but not before a potential sweep of the recent $95 low. From a technical perspective, price is currently trading near the point of control, battling resistance layers that may trigger the next corrective leg in the pattern. If confirmed, this harmonic could produce a textbook C-to-D leg completion before launching a move toward the $200+ zone.
Key Technical Points:
- Point of Control Battle: Price is currently testing the POC with weak momentum
- Resistance at Value Area High + 0.618 Fib: Confluence zone could trigger rejection
- C-Leg Completion Around $95: Potential low before bullish harmonic activates toward $200+
Solana’s price action has entered a critical zone of decision. Price is hovering near the point of control — the highest volume-traded level in the current range — and is now contending with a strong confluence of resistance just above. This includes the value area high and the 0.618 Fibonacci retracement, both of which have historically produced strong rejections.
If Solana fails to break through this resistance cluster with conviction, it increases the probability of a C-leg rejection within the emerging bullish harmonic pattern. This corrective move could send SOL back down toward the $95 region, sweeping the previous low and completing a technical bottom.
Such a move — while bearish in the immediate short term — would not invalidate the bullish thesis. In fact, a sweep of $95 could act as the final leg (D) completion of what may evolve into a textbook “godly harmonic” pattern. These structures are rare and powerful, typically resulting in sharp reversals when key conditions align. The eventual upside target for this move lies in the $200+ region, in line with the prior macro swing highs and high time frame resistance levels.
Until this scenario is confirmed or invalidated, Solana remains range-bound between major high time frame levels. Traders should stay alert for signs of rejection at current resistance — or, conversely, a volume-backed breakout above the value area high that would negate the harmonic setup.
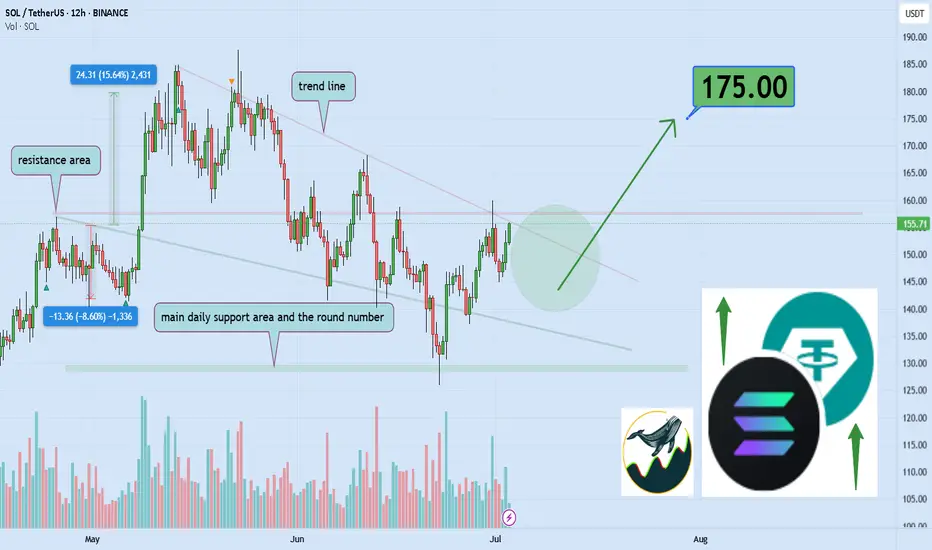
Can Solana reach $175 target after breaking $160 level?Hello,✌
let’s dive into a full analysis of the upcoming price potential for Solana 🔍📈.
BINANCE:SOLUSDT is approaching a crucial daily resistance level between $150 and $160. A clear break above this zone could lead to a 15% upside, with a target near $175 🚀. Keep an eye on volume for confirmation before entering the trade 📈.
✨ Need a little love !
We pour love into every post—your support keeps us inspired! 💛
Don’t be shy, drop a comment—we’d love to hear from you.
Big thanks , Mad Whale 🐋
Inverted head and shoulder suspected ..keep an eye on necklineHi dear friends and followers, I suspect this inverted head and shoulders pattern with a neckline around 160 usd. If it breaks in, it can go down toward the inferior support level around 130 usd and the 0.618 Fibo. If it breaks out it can go up until the next resistance and psychological level of 200 usd. As you can see, this 200usd resistance level does match with a large ascending channel.
You all need to DYOR and keep an eye on RSI and volume to confirm the movement and take a trade.
Wishing you the best and success on your decision.
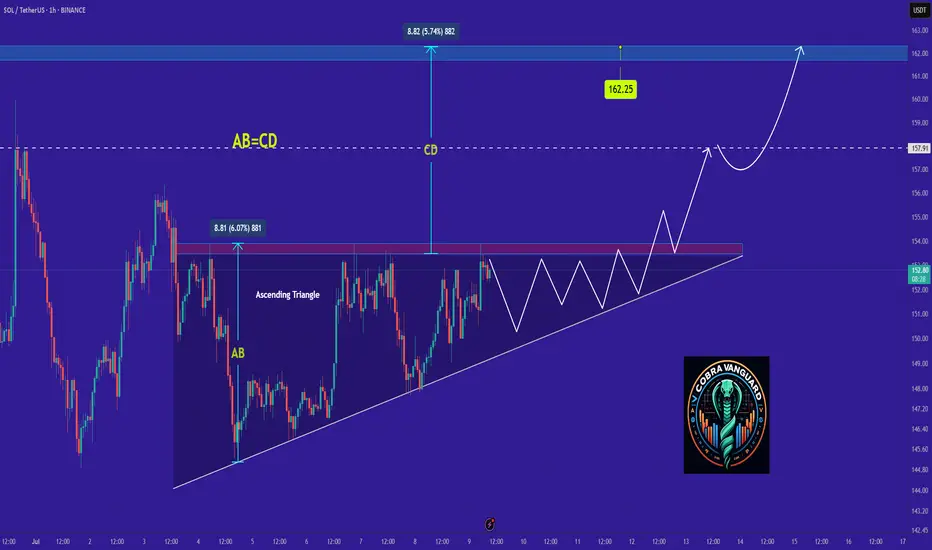
SOLANA's Situation, A Comprehensive Analysis (1h) !!!The price on the 1-hour timeframe is within an ascending triangle, which can be promising. If the price breaks this pattern with bullish candles, it could easily rise by the distance of AB=CD .
Best regards CobraVanguard.💚
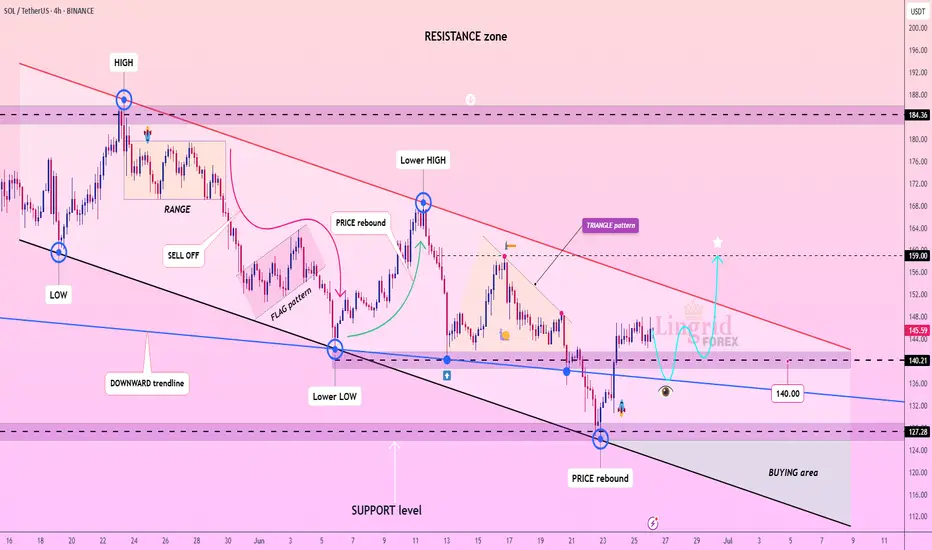
Lingrid | SOLUSDT possible Channel BreakoutBINANCE:SOLUSDT is showing early signs of recovery after rebounding from the 127 support zone and reclaiming structure near the 140 level. Price is now consolidating below the red descending trendline, which acts as dynamic resistance. A breakout above 145 could confirm bullish reversal and target the 159 resistance zone as indicated by the star projection. The key lies in whether buyers can sustain pressure above the 140 zone.
📈 Key Levels
Buy zone: 138–142
Sell trigger: break below 127
Target: 159
Buy trigger: breakout and close above 145 trendline
💡 Risks
Failure to hold above 140 may lead to fresh lows
Downtrend may resume if price gets rejected at 145
Low volume breakout may signal a bull trap
If this idea resonates with you or you have your own opinion, traders, hit the comments. I’m excited to read your thoughts!
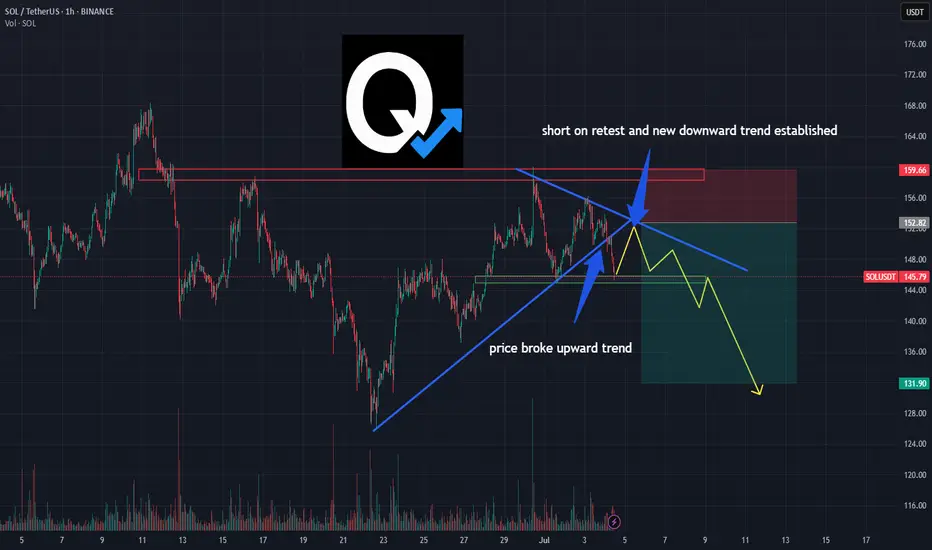
SOL/USDT Breakdown: Bearish Retest Sets Up ShortPrice action on SOL just confirmed a key structural shift 📉
The ascending trendline has been broken, and we’re now seeing a textbook bearish retest below prior support — which is flipping to resistance.
This setup suggests momentum is turning.
A lower high beneath the new downtrend line points to possible continuation toward the 132 zone.
• Trendline broken
• Retest in progress
• Short thesis active unless price reclaims 159+
This is not financial advice — just a breakdown of a technical idea based on structure and market behavior.
#SOL #CryptoTrading #TrendBreak #BearishSetup #TechnicalAnalysis #TradingView #QuantTradingPro
Exactly as I expected Lower low Love to see it as I plane 💯😬
The chart followed my plan so perfectly, I’m starting to worry it’s stalking me...
Like, chill Solana, I was just kidding when I said “do exactly this!” 😂📉📏
Solana (SOL/USDT) 4H Reverse H&S PatternSolana (SOL/USDT) – 4H Market Outlook | July 1, 2025
Introduction
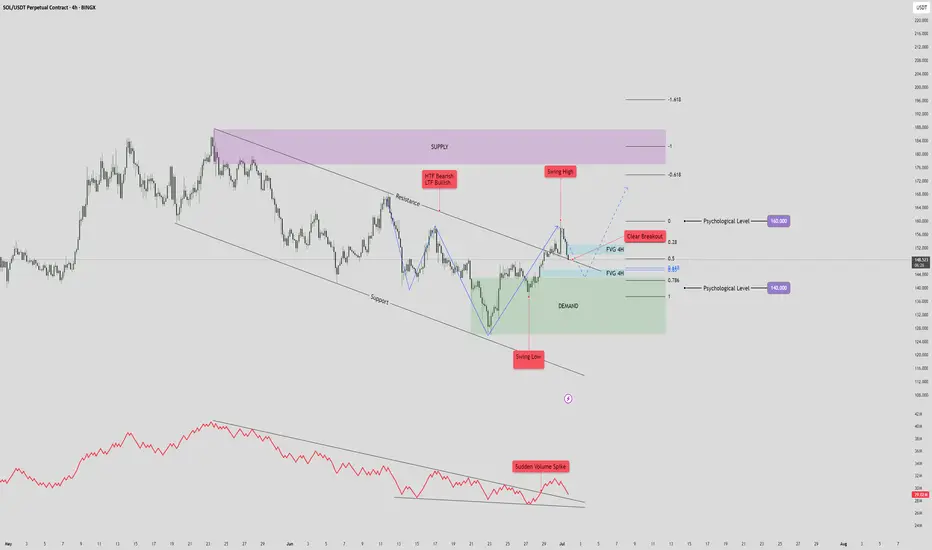
SOL has formed a reverse head and shoulders pattern, followed by a clean breakout above resistance. While the lower time frame is bullish, the higher time frame remains bearish, creating a short-term opportunity within a broader downtrend.
Context 1: Key Zones
Supply Zone: 176 – 187
Demand Zone: 126 – 143
Psychological Levels: 140 and 160
Context 2: Technical Structure
Pattern: Reverse Head & Shoulders
Breakout: Confirmed above neckline/resistance
FVGs:
One below price (within demand)
One above price (potential target)
Golden Pocket: Sits just above lower FVG and inside demand — strong confluence support
Context 3: Volume Insight
OBV Indicator: Shows a sudden volume spike, adding strength to the breakout and the bullish pattern confirmation.
Bullish Scenario
Price pulls back into the golden pocket + FVG + demand zone
Finds support → bounces to form higher low
Second leg of the move breaks swing high → targets upper FVG and 160 psychological level
Bearish Scenario
Price breaks back below demand zone and invalidates the golden pocket
Fails to hold structure → reverts to macro bearish trend
Potential retest of previous swing low below 126
Summary
SOL is showing bullish momentum on the 4H after completing a reversal pattern and spiking in volume. A pullback into the demand zone confluence may offer a strong long setup — but failure to hold could revalidate the higher timeframe downtrend.
SOL REJECTED AT RESISTANCE SOL with evening star candlestick pattern on 1D, two zones are my areas to watch for next coming days
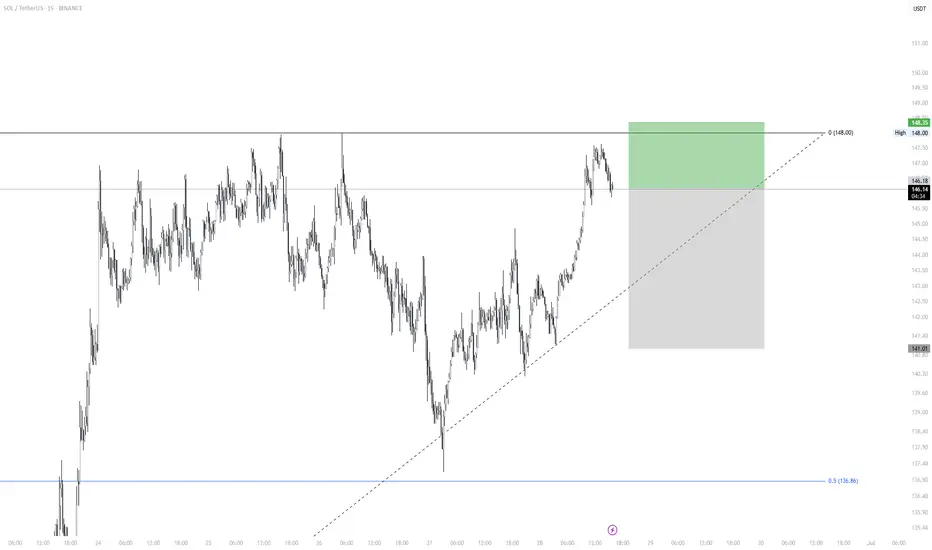
SOL/USDT Scalping Setup – 1H Reversal from Demand with FibonacciMarket Context:
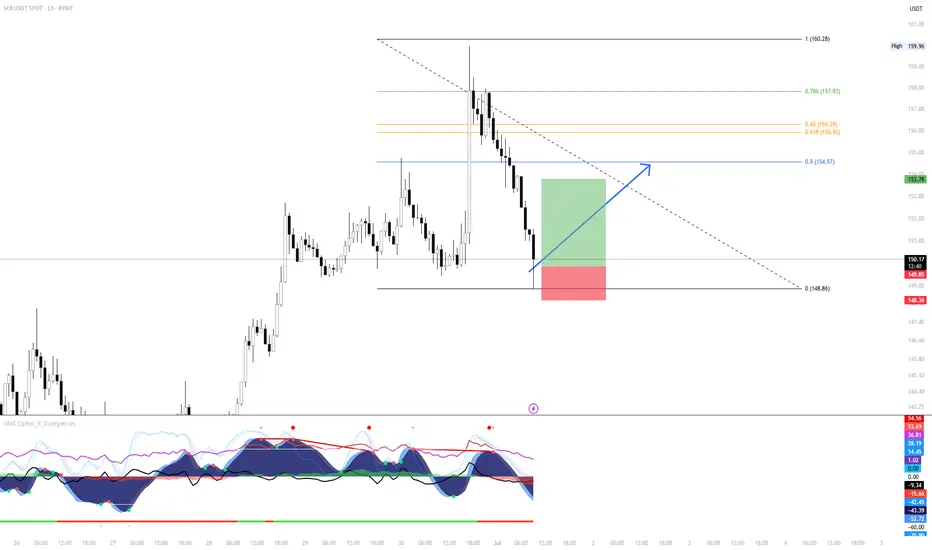
Solana has pulled back into a key short-term demand zone after a sharp rejection from recent highs. Price action is now showing signs of local exhaustion, with confluence from lower timeframe support and bullish structure attempting to form. The setup anticipates a bounce targeting the mid-Fibonacci zone.
Setup Idea:
Price tapped into a local support shelf around 148.80, where previous demand initiated the last impulsive leg up. With momentum indicators stretched and RSI divergence building, this offers a high-probability scalp opportunity.
Targeting the 0.5–0.618 Fibonacci retracement zone as first resistance, with confirmation needed for further continuation.
Trade Plan:
Entry: Around 148.80–149.00
Stop Loss: Below 148.30 (beneath local swing low and structure break)
Target: 154.50–155.90 (Fibonacci 0.5 to 0.618 zone)
Risk/Reward: Approx. 2.5R
Notes:
This is a reactive setup — price must hold the current level or print a higher low. If sellers regain control below 148.30, the trade is invalidated. Watch closely for volume shift and 1H candle confirmation before adding size.
Mid-Fibonacci level (154.57) is a logical area to de-risk or take partial profits.
SOLUSDT → Countertrend correction and hunt for liquidityBINANCE:SOLUSDT looks quite promising on the bullish side. The price is testing one of the key resistance levels within the local trend rally. A correction is forming. Is it beneficial for us?
On the higher timeframe, we see a change in character, a breakout of the trend resistance, and the formation of an upward trend support line. Bitcoin is still bullish (locally) at this time, but it is consolidating, which generally provokes a correction in SOL as well. Focus on the 150-149 area. If the bulls are able to keep the price above this zone after the retest, followed by the formation of momentum, this can be considered a positive medium-term sign.
Locally, the price within the trading range of 149.36 - 158 is heading towards the area of interest and liquidity (eql) at 149.36. The current sell-off is most likely triggered by a large player seeking a more favorable entry into the market.
Resistance levels: 154.75, 156.8
Support levels: 149.36, 147.93
In the current situation, it makes the most sense to consider an intraday trading strategy. A countertrend correction and a retest of support could attract buyers...
Best regards, R. Linda!
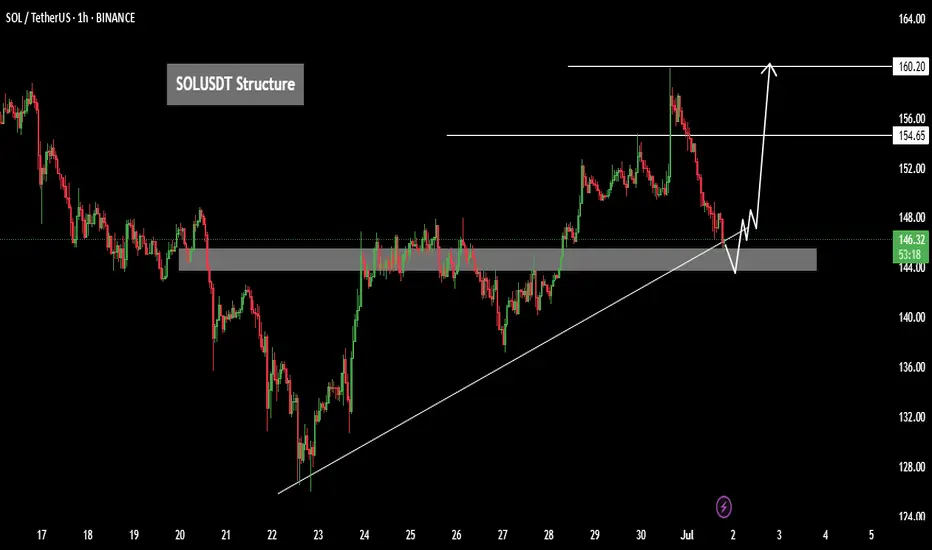
SOLUSDT – Bullish Intraday AnalysisSOLUSDT – Bullish Intraday Analysis
]SOLUSDT is showing bullish momentum and currently testing a key resistance zone. Price action on lower time frames indicates a change of character (ChoCh), hinting at a possible trend reversal or continuation to the upside.
Key Technical Highlights:
✅ Resistance Breakout in Progress: If price holds above the local resistance zone (likely near a prior high or supply zone), we may see further upside.
✅ Structure Shift: A clear break and retest on lower time frames suggests
You may find more details in the chart Ps Support with like and comments for more analysis.
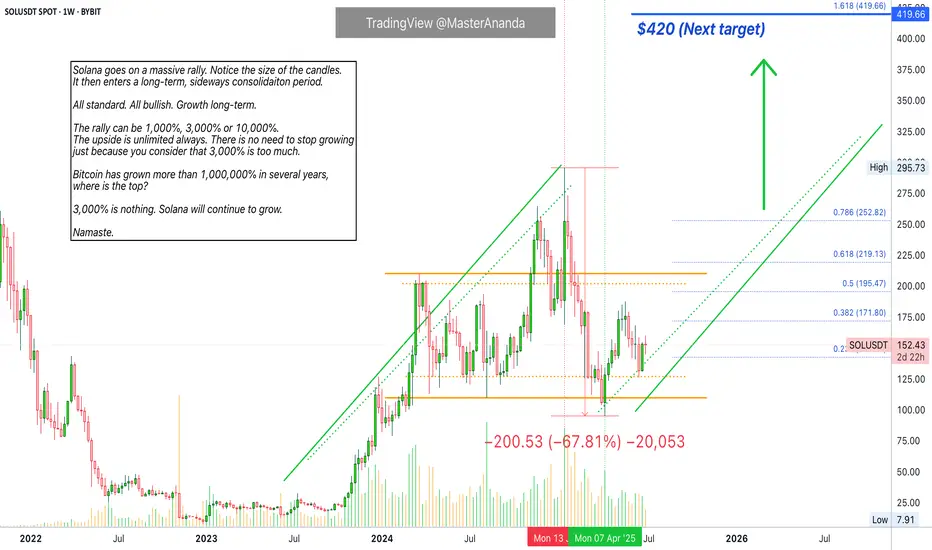
Solana Will Grow Despite "3,200% Rally"Oh my god! Folks, this friend of ours is saying Solana is going down because of a "3,200% rally." Crazy stuff. Can it continue growing after a 3,200% rally? But he is ignoring a massive correction between January and April. How big is the correction you ask? 67%. Meaning, there is no need to mention the previous rally because it has been corrected already.
Ok, hold on... Let's breatheeeeee deeply first.
Solana ETFs. Growing Cryptocurrency market. Global adoption. Old finance finally waking up to the new financial system. Even banks are starting to buy Crypto and opening up a ramp for their customers to buy Crypto, Solana, using their savings and other funds. This is why it will grow.
Think of this. Think of Apple, Inc. when it was young. Think of Tesla and Google and Microsoft. Would you quit after a 3,000% rally? Well, these companies are still growing today. Crypto is no different, it will grow for decades to come. Solana is going up. 100% certainty, you can see it on the chart; the fundamentals as well.
Get on board the bullish train, it is not too late.
Everything money goes into Crypto. You will be happy with the results.
If you stay out, your loss.
Namaste.
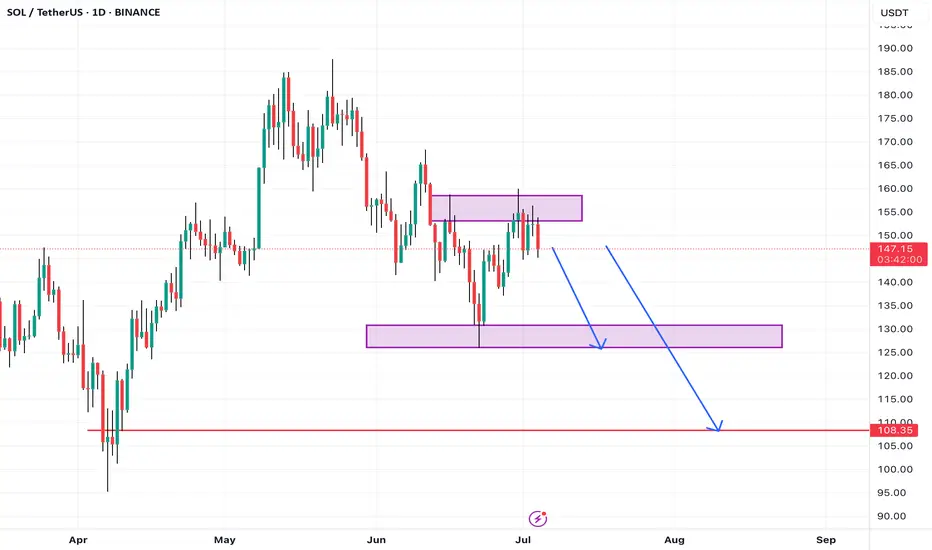
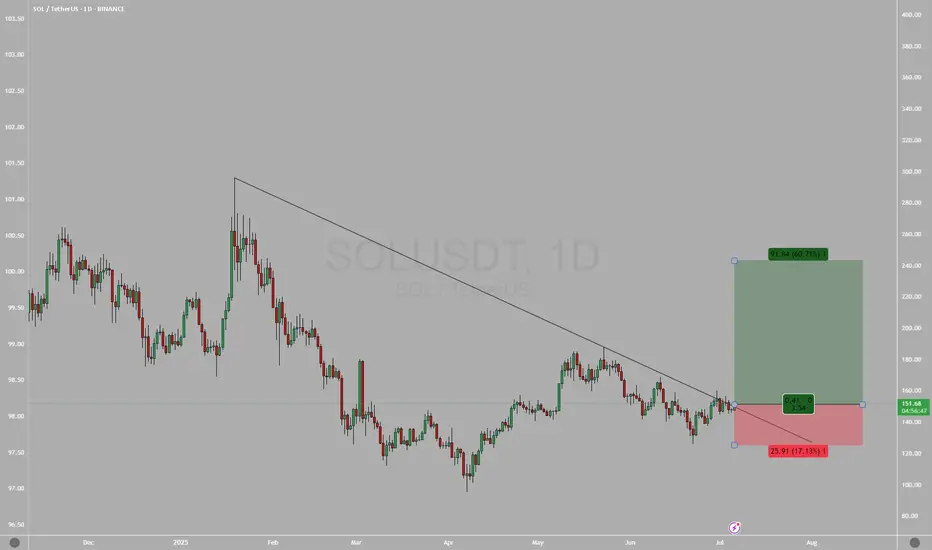
SOL/USDT Short Setup – Targeting Range LowContext:
Price just rejected off local range high near $148 — a key resistance that has held several times historically. We’re seeing initial signs of weakness after a strong rally, with price failing to hold above resistance and beginning to break minor structure.
Setup Details:
Entry: ~$146.20
Stop Loss: ~$148.35 (above recent high)
Target: ~$141.00 (range low + demand pocket)
Risk/Reward: ~2.38R
Trade Idea:
This is a classic range play — short from top of the range, targeting the base. Momentum is fading near resistance and we have a clean invalidation just above. Price structure suggests lower highs are forming, and any further weakness should push us back into the mid-to-lower part of the range.
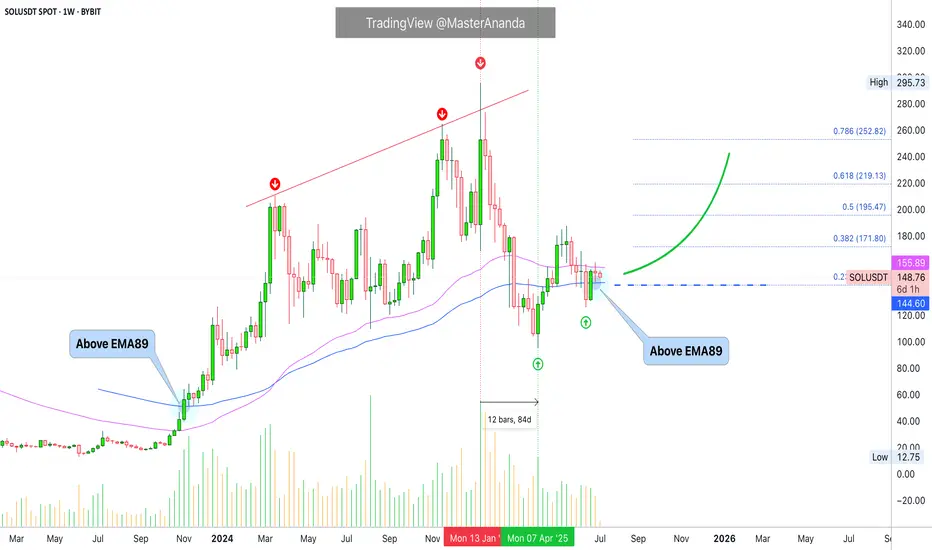
Solana Moving Averages: Patience is KeySolana is trading above EMA89 while at the same time trading below EMA55, we have a mixed situation. When in doubt, stay out. Anything is possible on this chart.
There was a major correction already that lasted 84 days. Solana lost more than 65% in this correction. A -67% drop. This correction removed all gains from 2024 sending prices back below $100. This is to say that Solana already went through a full and major flush.
The market could very easily continue lower and produce a lower low compared to 7-April, a major crash leading to August and I can easily see this scenario developing. Will it develop? Is it really necessary?
I can also see a slow but sure change of course. A few days red at the start of the week, as it is usual and then Boom!, the market turns green. And it grows day after day after day. It is already happening, patience is key. Better focus on the numbers.
» If Solana trades weekly above $142, we are bullish, strongly bullish and can expect additional growth.
» If Solana moves and closes weekly below $142, market conditions still remain bullish but we can approach this pair with caution.
» On a broader perspective, any trading above $95, the 7-April low, is bullish long-term. As long as this level holds, we can expect higher prices. The last low sits at $126...
It doesn't matter how you slice it, the price is good and is more likely than not to continue to increase. Patience is key.
Namaste.
solana crazy ideaWell, I made this silly little chart for myself. I kind of expect it to follow the pattern of some bots running on Solana, at least within the range I’ve marked. But hey, it’s a bull market, and sometimes even random drawings by amateurs like me end up working out!
That said, I'm keeping my target modest — not expecting anything crazy. Stop loss depends on how Bitcoin behaves, and honestly, I wouldn’t recommend anyone follow what I’m doing. This is not investment advice, just a ridiculous idea I had.

$SOL breakoutbeen waiting for quite sometime for this to break.
taking a good size low lev long on todays close.
invalidation if we get a daily close below the tl, really good r/r to ignore
gl
SOL - He sees everything!Ironically - It took my local SL and went up, but now it have two moves - two moves means either on the down bottom to top or moves directly on the top as said!