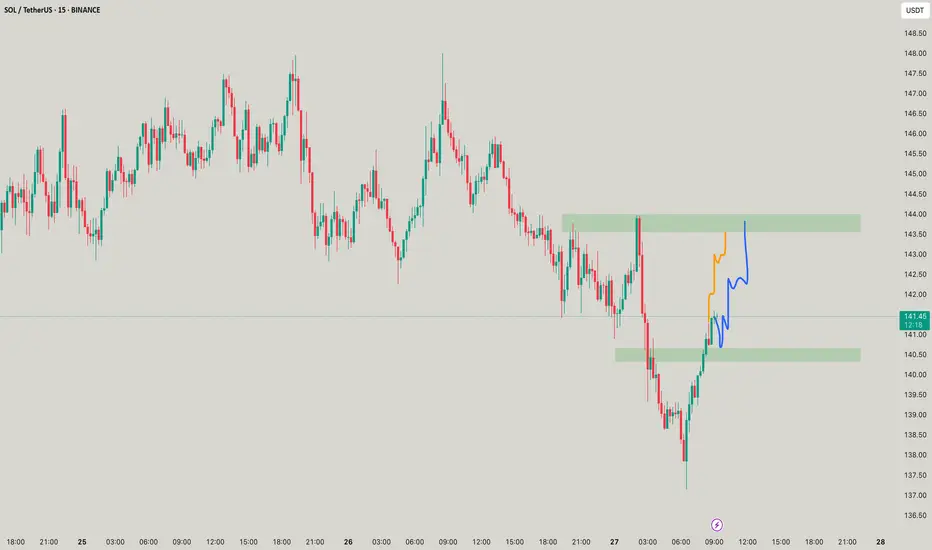
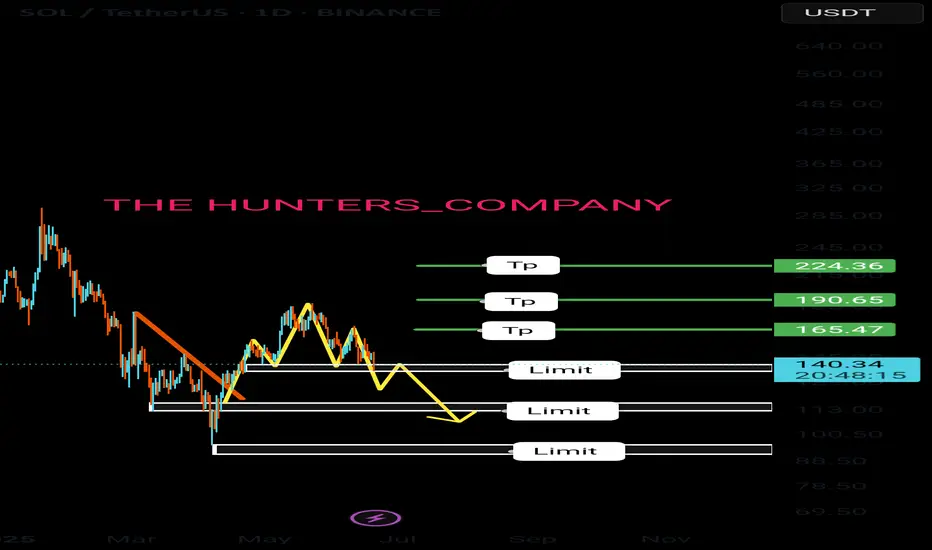
SOLANA I Daily CLS I KL - BRK I Model 1I Target TRCHey, Market Warriors, here is another outlook on this instrument
If you’ve been following me, you already know every setup you see is built around a CLS Footprint, a Key Level, Liquidity and a specific execution model.
If you haven't followed me yet, start now.
My trading system is completely mechanical — designed to remove emotions, opinions, and impulsive decisions. No messy diagonal lines. No random drawings. Just clarity, structure, and execution.
🧩 What is CLS?
CLS is real smart money — the combined power of major investment banks and central banks moving over 6.5 trillion dollars a day. Understanding their operations is key to markets.
✅ Understanding the behavior of CLS allows you to position yourself with the giants during the market manipulations — leading to buying lows and selling highs - cleaner entries, clearer exits, and consistent profits.
📍 Model 1
is right after the manipulation of the CLS candle when CIOD occurs, and we are targeting 50% of the CLS range. H4 CLS ranges supported by HTF go straight to the opposing range.
"Adapt what is useful, reject what is useless, and add what is specifically your own."
— David Perk aka Dave FX Hunter ⚔️
👍 Hit like if you find this analysis helpful, and don't hesitate to comment with your opinions, charts or any questions.
SOLUSDT trade ideas
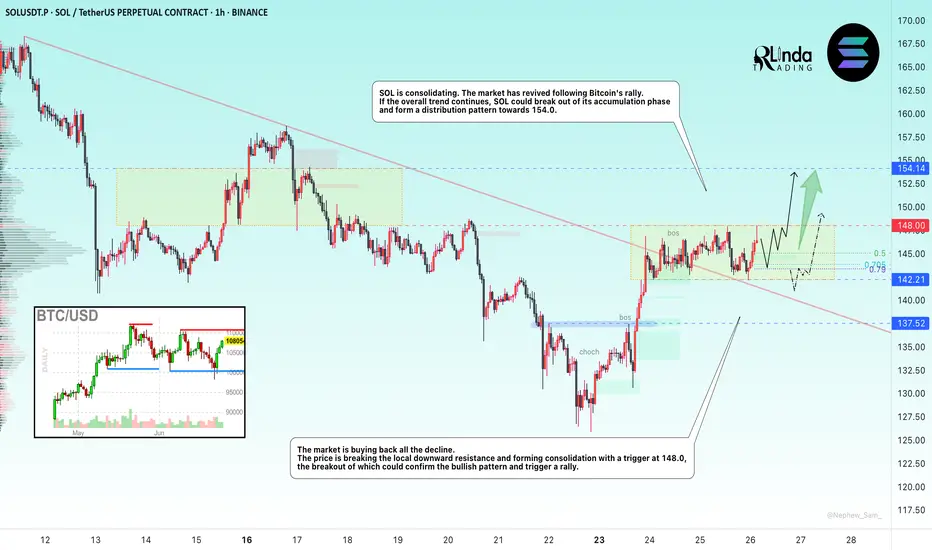
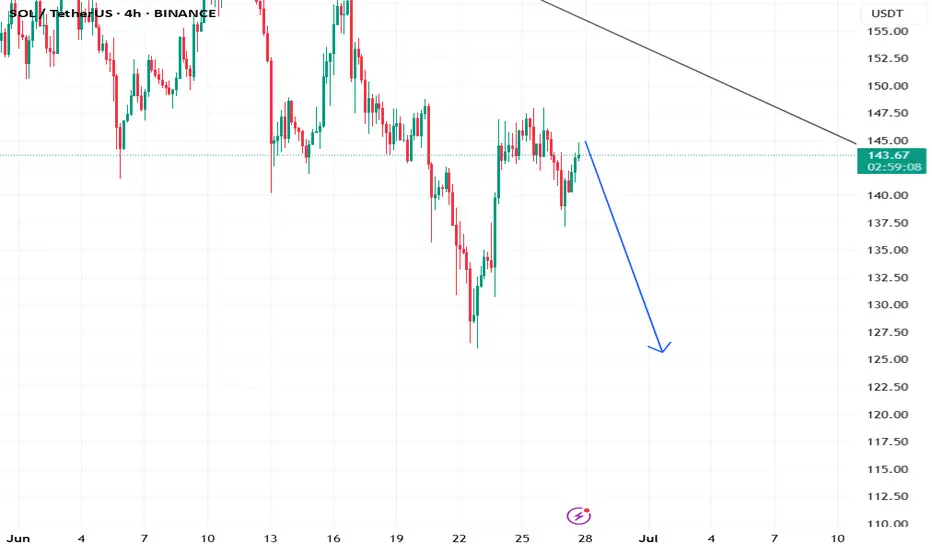
SOLANA → BINANCE:SOLUSDT.P is consolidating after breaking through trend resistance. The market trigger is 148.0, and Bitcoin is provoking the market to recover...
The market is buying back all the losses. SOL breaks the local downward resistance and forms consolidation with a trigger of 148.0. The market has come to life following the rallying Bitcoin. If the general trend continues, SOL may break out of the accumulation zone and form a distribution towards 154.0
The latest retest of resistance is provoking a correction. Before rising, the price may test the zone of interest at 144 or the lower boundary of consolidation at 142.2. The ideal scenario would be a false breakdown of support at 142.2 before rising.
Resistance levels: 148.0, 154.2
Support levels: 142.2, 137.5
Fundamentally, the situation for the crypto market is improving. Technically, the market is also showing positive dynamics. SOL is consolidating after growth, which is generally a positive sign. Now we need to wait for the price to break out of consolidation and continue its growth. One of the signs of this is a rebound from the 0.5 range and a quick retest of resistance with a gradual squeeze towards the trigger.
Best regards, R. Linda!
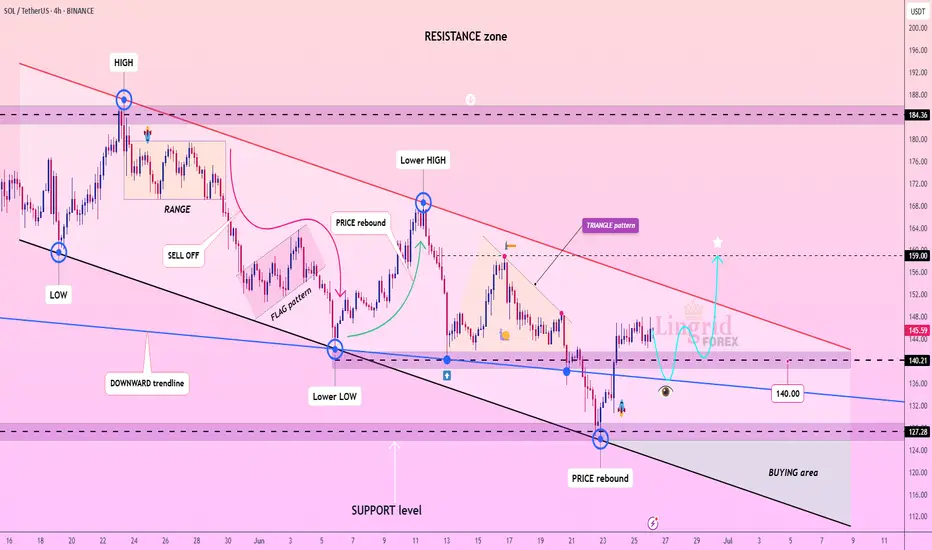
Lingrid | SOLUSDT possible Channel BreakoutBINANCE:SOLUSDT is showing early signs of recovery after rebounding from the 127 support zone and reclaiming structure near the 140 level. Price is now consolidating below the red descending trendline, which acts as dynamic resistance. A breakout above 145 could confirm bullish reversal and target the 159 resistance zone as indicated by the star projection. The key lies in whether buyers can sustain pressure above the 140 zone.
📈 Key Levels
Buy zone: 138–142
Sell trigger: break below 127
Target: 159
Buy trigger: breakout and close above 145 trendline
💡 Risks
Failure to hold above 140 may lead to fresh lows
Downtrend may resume if price gets rejected at 145
Low volume breakout may signal a bull trap
If this idea resonates with you or you have your own opinion, traders, hit the comments. I’m excited to read your thoughts!
solana crazy ideaWell, I made this silly little chart for myself. I kind of expect it to follow the pattern of some bots running on Solana, at least within the range I’ve marked. But hey, it’s a bull market, and sometimes even random drawings by amateurs like me end up working out!
That said, I'm keeping my target modest — not expecting anything crazy. Stop loss depends on how Bitcoin behaves, and honestly, I wouldn’t recommend anyone follow what I’m doing. This is not investment advice, just a ridiculous idea I had.

SOLANA SOL to 3800$ nextSolana is in mid range, 61.8% retracement bottom, similar to TSLA at 19 Aug 19,
since Sol is the most used cypto (90% of blockchain usage) i expect a massive bullrun.
Sol will outperform bitcoin

SOLANA ABOUT TO EXPLODE?CRYPTOCAP:SOL just broke out and is surging within a long-term bullish channel
Price action is clean, momentum is strong, and if this channel holds — we might be eyeing $700+ in the next run.
This is not the time to ignore Solana.
Chart says it all.
DYOR. Stay sharp.

SOLUSDTSOL has been trending below the trend line for more than 162 days. It is reaching local low and my plan is to trade the breakout. If 127$ local low gets taken then we might see 110$. Lets see how it plays out.
Note: It is not a financial advise. Please DYOR

sol usdt pattern identified inverse head and shoulders with chan🧠 Technical Analysis (SOL/USDT – 4H Timeframe)
🔍 Pattern Identified: Inverse Head & Shoulders
Left Shoulder: Around $137
Head: Dipped to ~$126
Right Shoulder: Formed around $135
Neckline Breakout: Successfully broken near $148–$150 zone
This classic bullish reversal pattern indicates a potential trend shift from bearish to bullish.
📈 Trend & Channel
The price was previously trading inside a descending parallel channel (marked in yellow).
The breakout from the upper channel boundary confirms strength and momentum shift.
🚀 Price Targets (Resistance Levels Ahead):
$158.36 – First resistance level (short-term target)
$168.52 – Mid-level resistance (medium-term)
$187.56 – Key resistance (long-term target area)
✅ Bullish Confirmation:
Breakout with volume from both descending channel and head & shoulders neckline
Price holding above neckline now acting as support
⚠️ Risk Note:
A retest of the breakout zone ($148–$150) can occur before moving higher
Invalid if SOL drops back below neckline and fails to hold above $145 support zone

SOL can retest the bottom again, trade carefullySOL retest the bottom is likely before starting the run, lets see
SolusdtIn daily chart S_WAVE DONE NOW CAN move TO N_WAVE and in the weekly price so far from kumo so price can Checking kumo in weekly chart

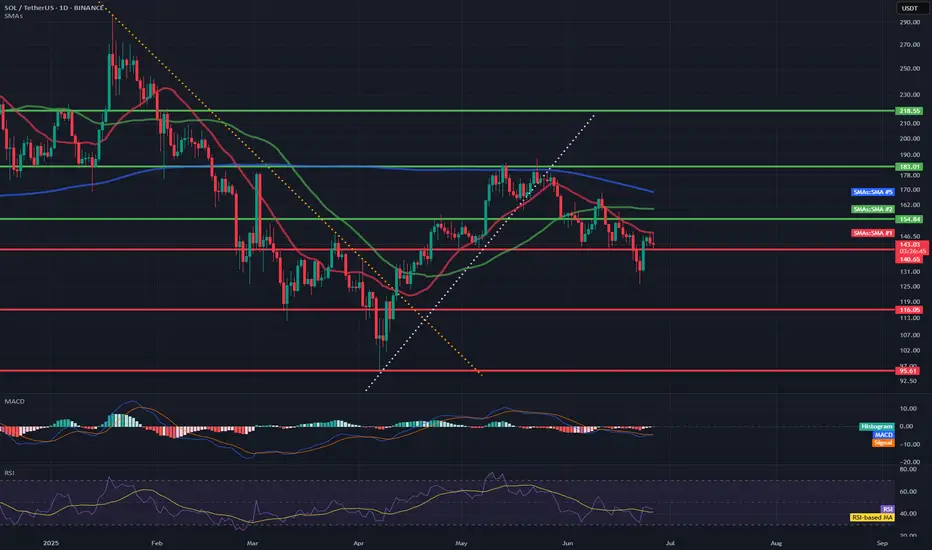
SOL/USD🔹 Trend direction
Current short-term trend: down
Price below key moving averages:
SMA50 (green) ≈ 154.84
SMA200 (blue) ≈ 168.79
Price ≈ 142.49 – below both, confirming weakness.
🔹 Supports and resistances (key levels)
✅ Supports:
142.00–143.50 – current level where price is struggling (multiple price reactions).
131.00 – strong support, last low (June 18).
119.00 / 116.00 / 113.00 – next supports from previous consolidations.
95.61 – deep support if market breaks down.
❌ Resistances:
148.00–150.00 – local resistance, coinciding with the red SMA (short-term resistance).
154.84 – resistance (SMA50).
162.00 – resistance (SMA200).
183.00 – main resistance from the May peak.
218.55 – very strong resistance from March.
🔹 Technical indicators
📉 MACD:
MACD line < signal, negative histogram → bearish signal.
No signs of bullish strength.
📉 RSI:
RSI ≈ 41.31 – close to the oversold zone, but not there yet (below 30).
RSI trend also downward.
🔹 Formations and trend lines
Broken support line after the April-May bullish structure (white trend line).
The previous bearish trend line (yellow) was broken in April, but the momentum did not hold.
A lower high and lower low may be forming now – a classic bearish structure.
🔹 Potential scenarios
🔻 Bearish:
Breakout of 142 → test of 131 → possible drop to 119/116.
Staying below SMA50 and MACD still negative = high chance of continuing declines.
🔼 Bullish:
Recovery of 148–150 needed → only then a chance to test 154 and SMA50.
RSI close to oversold = possible local technical bounce, but not reversing the trend.
📌 Conclusions / Summary
General trend: Bearish (down).
Sentiment: Negative, no confirmed signals of strength.
If level 142 breaks - next test will be at 131.
A strong breakout above 150-154 is needed to talk about a change in structure.
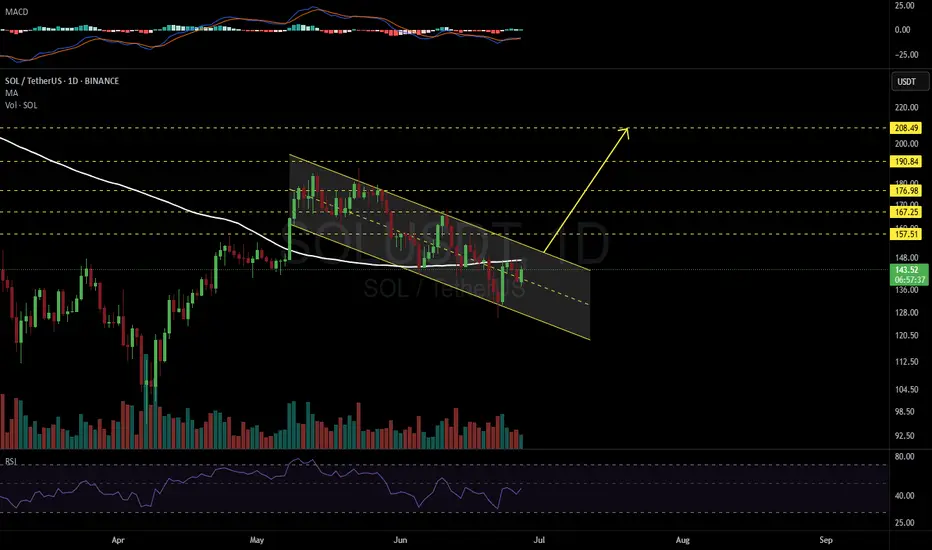
SOLUSDT 1D📈 #SOL – Bullish Flag Setup on Daily
Solana has formed a bullish flag on the daily chart — a continuation pattern that often leads to strong breakouts.
Currently, the price is trading above the midline of the flag and testing the daily MA100 as dynamic resistance.
🚀 If #SOL breaks above the MA100 and the upper boundary of the flag, the next targets are:
🎯 $157.51
🎯 $167.25
🎯 $176.98
🎯 $190.84
🎯 $208.49
📌 Watch for:
Breakout confirmation with strong volume
Retest of breakout zone for safer entries
⚠️ Risk Reminder:
Always use a tight stop-loss and apply solid risk management to protect your capital.
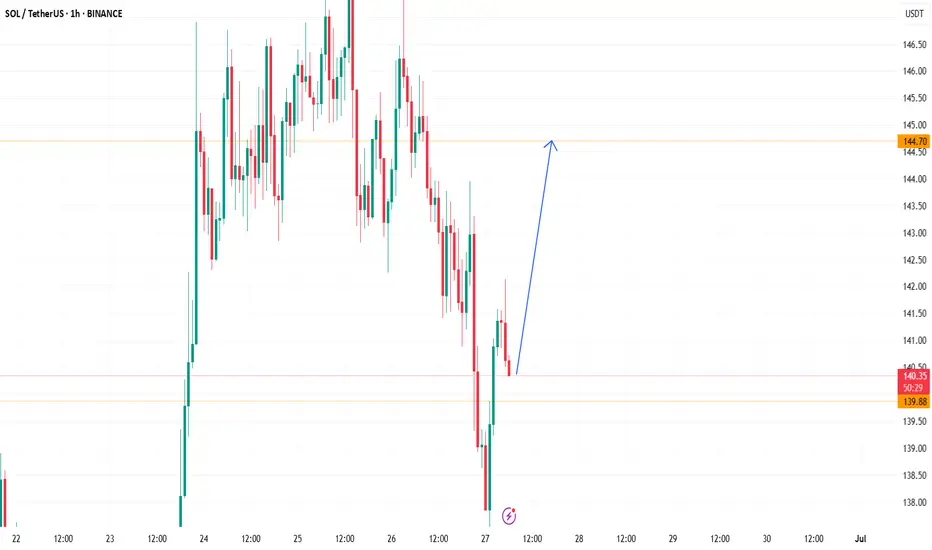
Buy limit 146.60 TiqGPT buy signalAnalyzing the SOL/USDT across multiple timeframes, we observe a consistent upward momentum, particularly evident in the shorter timeframes (1H, 15M, 5M, and 1M). The 1D and 4H charts show a recent recovery from a downward trend, indicating a potential shift in market sentiment or a retracement phase.
1D Chart: The daily chart shows a series of bearish and bullish candles with recent bullish activity suggesting a potential reversal or pullback from previous lows.
4H Chart: This timeframe shows more granularity in the recovery, highlighting a resistance-turned-support level around $142, which has been retested and held as support.
1H Chart: A strong bullish impulse is visible, breaking past previous minor highs, suggesting an increase in buying pressure.
15M Chart: This chart shows a continuation of the bullish momentum with higher highs and higher lows, a classic sign of an uptrend.
5M and 1M Charts: Both these timeframes show detailed price action within the bullish trend, with the 5M chart beginning to form a pullback.

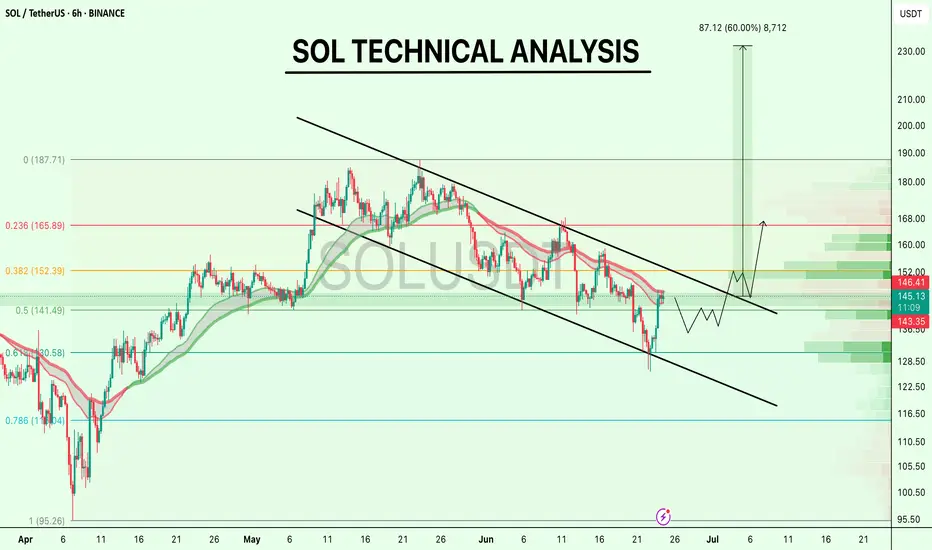
SOL TECHNICAL ANALYSIS !!CRYPTOCAP:SOL is testing the upper boundary of its falling channel.
No breakout yet, just a clean retest of trendline resistance + 0.5 Fib zone around $144–$146.
A breakout above $152 (Fib 0.382) with volume could shift the structure bullish. Until then, it’s still inside the downtrend.
This is where patience pays, wait for confirmation, not hope.
What’s your play here?
If you find my updates helpful, don’t forget to like and follow for more!
DYOR, NFA
#Solana #SOL
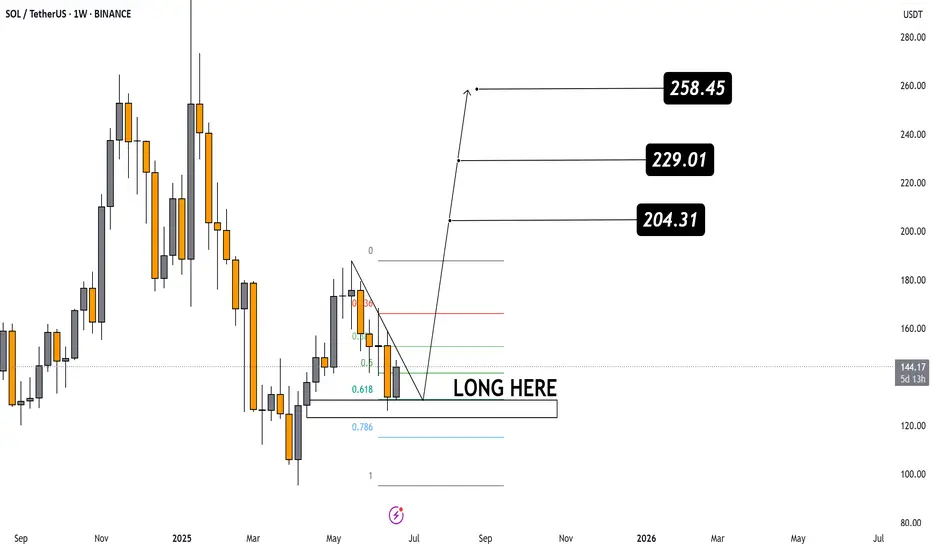
Technical Analysis of SOL/USDT (Weekly Chart)
The chart shows a Falling Wedge pattern – a typically bullish reversal formation.
A breakout to the upside from the wedge has occurred, signaling the potential start of an upward trend.
📉 Entry Zone (LONG HERE):
Clearly marked around the Fibonacci support levels:
0.618 (~130 USDT)
0.786 (~115 USDT)
This support zone is strong and ideal for long positions.
📊 Fibonacci Retracement Levels:
0.382 – First resistance
0.5 – Mid-level resistance
0.618 – Strong retracement support that price bounced from
🎯 Target Projections:
204.31 USDT – First target; a strong historical resistance.
229.01 USDT – Second target; a breakout above this would confirm bullish strength.
258.45 USDT – Final target if the bullish momentum continues.
NothingThe SOL will increase $150 and reach to the top of the wedge in the coming weeks .
Best regards CobraVanguard.💚

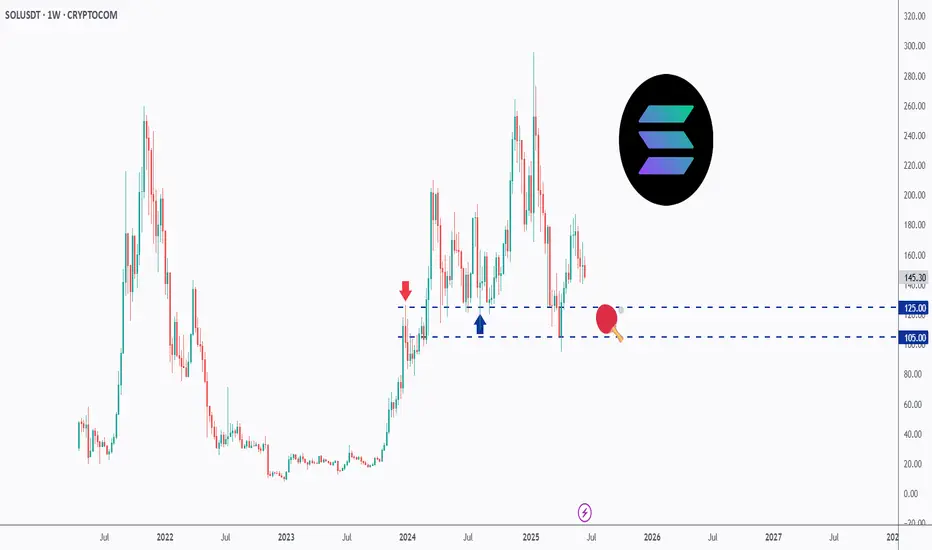
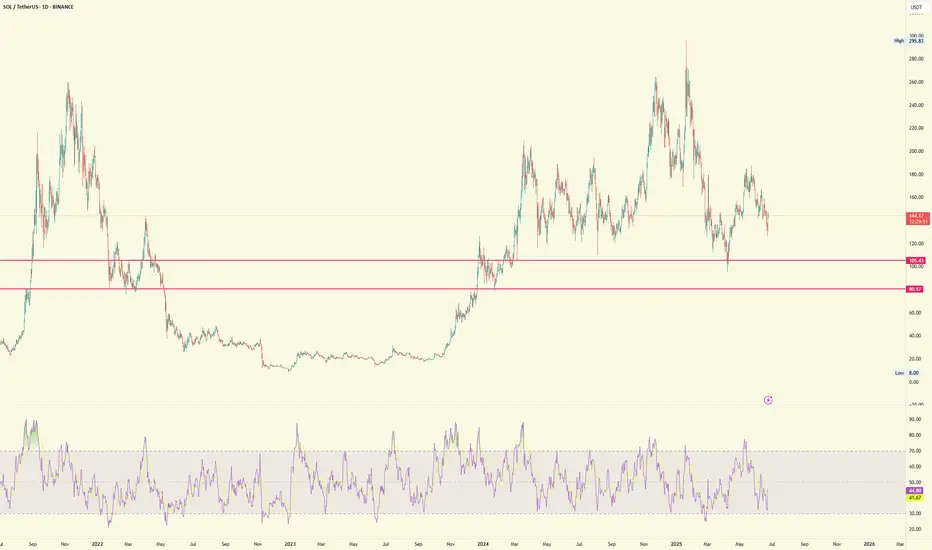
SOL - Playing Ping Pong!Hello TradingView Family / Fellow Traders. This is Richard, also known as theSignalyst.
📈SOL has been trading within a range between $100 and $200 round number.
And it is currently retesting the lower bound of the range which has been acting as a magnet lately.
As SOL approaches the $105 - $125 support zone, and as long as the $105 support holds, we will be looking for longs targeting the $200 round number.
📚 Always follow your trading plan regarding entry, risk management, and trade management.
Good luck!
All Strategies Are Good; If Managed Properly!
~Rich
$420 Solana Within 2 Months —TargetsSolana is on a path to a hit a price target of $420 mid-term, within 1-3 months. This is the continuation of the uptrend that started in early April with the end of the previous correction and a more than a year long strong low.
This is not for the faint of heart. Solana is preparing for something massive, even scary but positive. $600+ is also possible but we are going step by step and $420 is the first step.
Immediately when prices start to rise Solana is likely to find resistance around $220 and $253.
The last high, January 2025, would be the minimum on this bullish wave. This would be price tag of $296.
The end of the retrace happened 22-June. This means that the market is already bullish for an entire week. Bitcoin is about to produce the best possible weekly close. As Bitcoin is ultra-bullish above $106,000/$107,000, the altcoins can continue to recover and will aim higher trying to catch up. Of course, no altcoin can catch up to Bitcoin but invariably the entire market will grow.
The wait is over, we are bullish now. Timing is great.
Bullish momentum will grow for weeks and then a major force will permeate the market, something not seen in many years. I hope you are prepared.
Namaste.

Solana:Daily free signalhello friends👋
As you can see, after the drop that we had, insider buyers showed and were able to support the price well.
But it was not enough, and as you can see, a noisy pattern has formed, which can indicate a further decrease in the price.
Now we can take advantage of this opportunity and make step-by-step purchases with risk and capital management in the support areas that we have obtained for you and move to the specified goals.
🔥Follow us for more signals🔥
*Trade safely with us*
SOL/USDT 15-minute high win scalping signals are as follows:- Signal: LONG
- Entry: 147.800 ~ 148.400
- Take Profit: 149.800, 151.300

#Sol ShortBias: Leaning bullish short-term (1–3 days), backed by momentum and price structure.
Caution: Funding remains slightly negative—and RSI is near overbought, so a minor consolidation is possible before another leg up.
Trade ideas:
Aggressive: Long near $142–144 with stop below $140, target $150+.
Conservative: Wait for confirmed breakout above $146 before entering long.
SOL - It won't take your soul!SOLOLOL - SOL basically can go direct or if not a halt and a move! But all is interlinked and intertwined to btc!