When Profit Comes, Leave Before It Vanishes Again. how??!!Have you ever stayed in a winning trade just to get more?
That voice whispering “keep it longer, this might be the big one”?
It’s the same voice that’s emptied thousands of portfolios...
Hello✌️
Spend 2 minutes ⏰ reading this educational material.
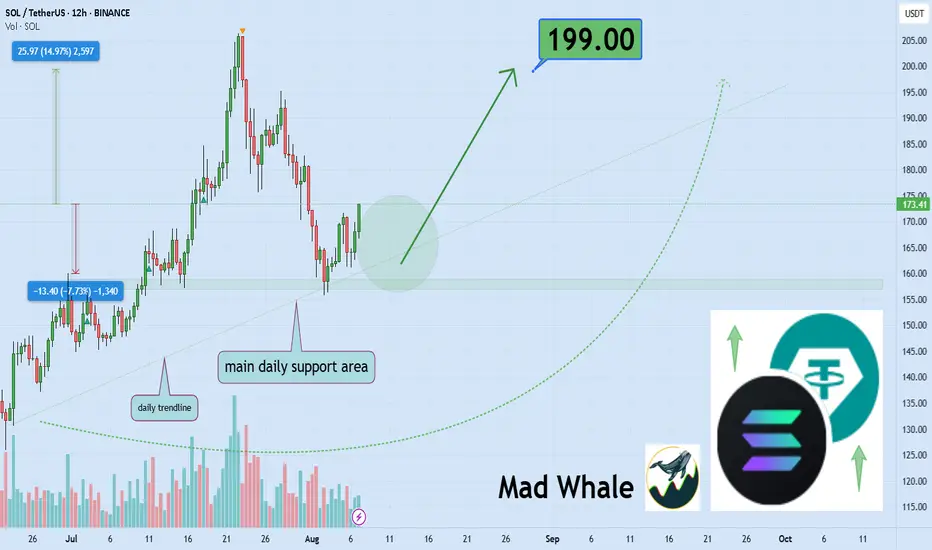
🎯 Analytical Insight on Solana:
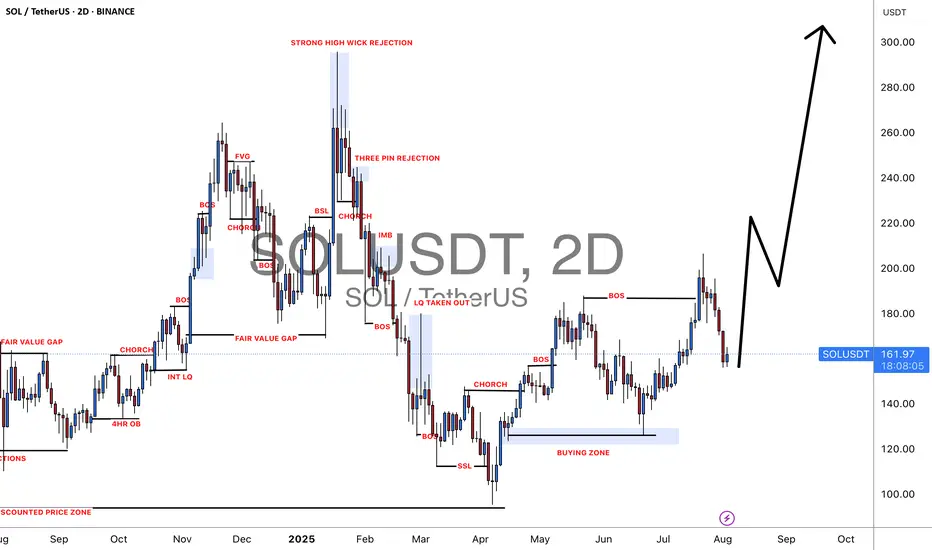
BINANCE:SOLUSDT has seen healthy volume recently and is testing key daily support along with an important trendline. Holding these zones could fuel a 15%+ rally toward the $199 mark 📊🚀
Now, let's dive into the educational section,
🧠 The Psychology of Greed: Profit’s Evil Twin 😈
When you enter a trade and it starts moving in your favor, your subconscious kicks in. Suddenly, your brain whispers: “Just a little more... hold it!”
That’s when the greed game begins.
No matter how well you planned before the trade, once you're in profit, your brain creates a fantasy. A future where profits double, triple... a dream world. And this dream is exactly what makes traders give back everything including their original capital.
Our minds are wired to crave the rush of winning again. It’s like a hit of dopamine. So you hold the position even when the chart is flashing reversal signs. That’s the setup for disaster...
📉 Take-Profit Levels: Why Getting Out Is the Real Win 📌
Here’s the cold truth
If you don’t exit when you planned to, that profit was never really yours
A take-profit isn’t just a number. It’s a psychological boundary that separates a disciplined trader from an emotional one. Many beginners think setting a TP means giving up potential gains but in reality, it means respecting your plan and your capital.
You’ll always have another chance to trade. Always
But if greed wipes out your funds, there’s nothing left for the next opportunity
Each trade is just a chapter, not your whole story.
🧪 The Social Media Trap: When Your Brain Stops Thinking 📱
Online hype is poison. From “X coin just did 100x” to “I made $50K in a weekend” your brain gets hijacked.
You start chasing fantasies, not trades
That illusion of overnight success makes you ignore your own strategy. You stop following your plan and start trying to copy people who probably aren’t even real.
This is how social media slowly pushes traders into ruin
You feel left behind and that fear pushes you into greedy irrational decisions.
🔧 TradingView Tools That Help You Beat Greed 🛠
Luckily, TradingView offers several tools that can help keep your greed in check and your head clear
Alerts
Set an alert at your take-profit zone so you don’t keep staring at the chart. Let the system notify you when it’s time.
Long/Short Position Tool
Use this to visually define your entry, TP, and SL. Seeing it on the chart makes it easier to stick to your plan.
Bar Replay
This is gold for practice. Rewind price action and practice exits. See how often greed would’ve destroyed your trades.
Notes
Add reminders to your charts. Write things like “Exit at 2500 don’t overstay.” When future-you sees that message, it helps stay on track.
These tools don’t just improve your trades. They show discipline. And that’s exactly the kind of analysis editors look for when picking Editor’s Choice posts.
🚪 Final Words: In and Out, That’s the Game 🎯
Taking profit is a skill but exiting on time is an art
If you learn to respect your plan and silence greed, you’ll protect your capital and your sanity
There’s always a next trade if you survive this one
✨ Need a little love!
We pour love into every post your support keeps us inspired! 💛 Don’t be shy, we’d love to hear from you on comments. Big thanks , Mad Whale 🐋
📜Please make sure to do your own research before investing, and review the disclaimer provided at the end of each post.
SOLUSDT trade ideas
Lingrid | SOLUSDT Corrective Move Completed ? Long OpportunityBINANCE:SOLUSDT is forming a bullish higher low just above the 158.47 support after a corrective pullback from the recent higher high. Price structure remains within the upward channel, and the rebound from key horizontal support signals a continuation setup. As long as the 158.47–160.00 zone holds, price is likely to target the 192.00 resistance near the channel's top. The ascending structure supports a bullish continuation toward the upper resistance band.
📉 Key Levels
Buy trigger: Break above 172.00
Buy zone: 158.47 – 160.00
Target: 192.00
Invalidation: Drop below 150.00
💡 Risks
Breakdown of the ascending structure below 150.00
Rejection near 172.00 without momentum confirmation
Broader market weakness could suppress breakout potential
If this idea resonates with you or you have your own opinion, traders, hit the comments. I’m excited to read your thoughts!

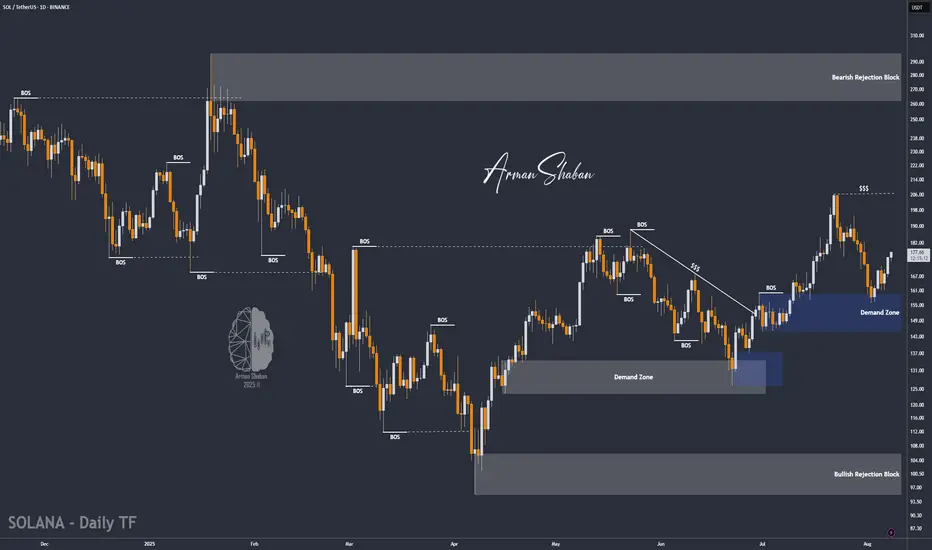
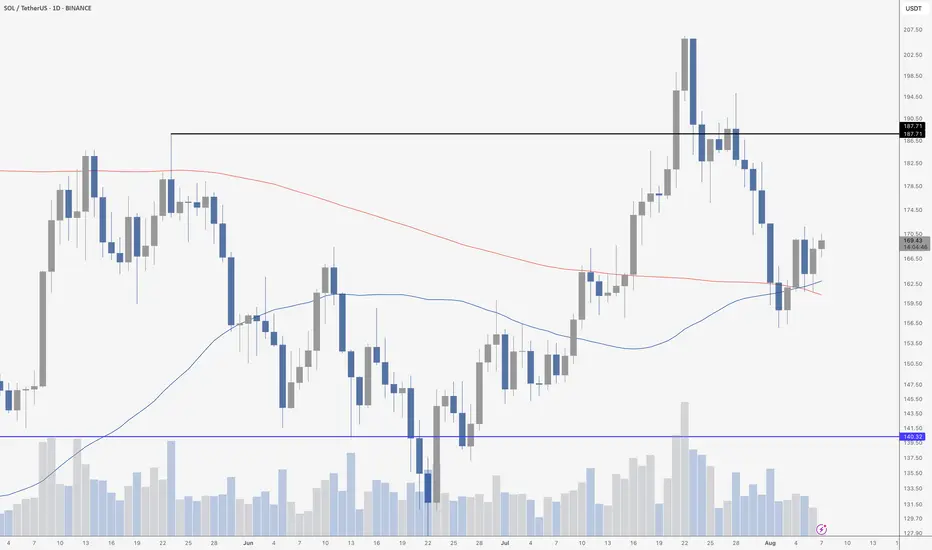
SOL/USDT | Solana Jumps 14% – Eyes on $182, $195 & $206 Next!By analyzing the Solana chart on the daily timeframe, we can see that after correcting to $155, the price regained bullish momentum and is now trading around $178, up more than 14%. I expect this upward move to continue, with the next targets at $182, $195, and $206. This analysis will be updated soon!
Please support me with your likes and comments to motivate me to share more analysis with you and share your opinion about the possible trend of this chart with me !
Best Regards , Arman Shaban
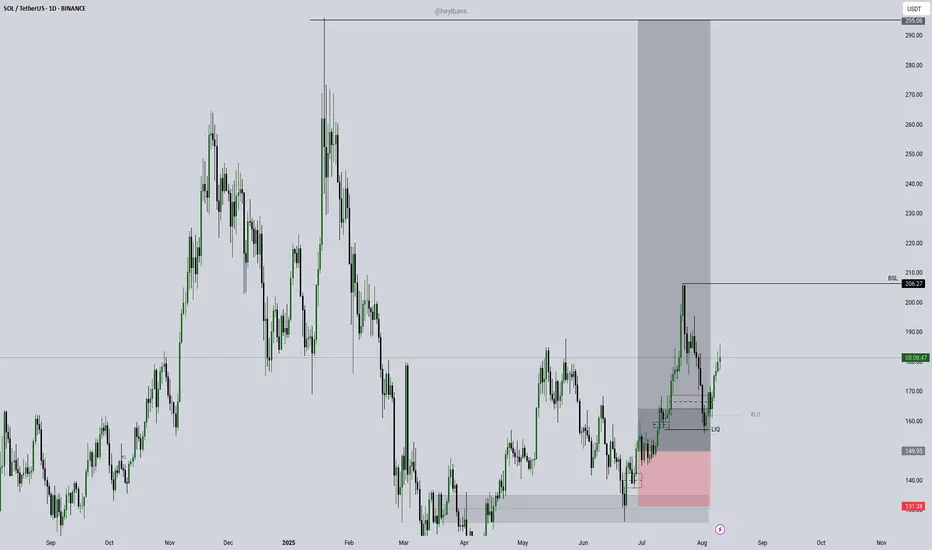
#SOLUSDT: A Big Move In Making Crypto Market Is BullishCrypto market remain bullish and as for the SOLANA we remain quite optimistic; currently price is trading at critical level and waiting for liquidity to emerge. We need strong volume for big price movement. Follow a strict risk management while trading crypto market.
Good luck and trade safe.
Team Setupsfx
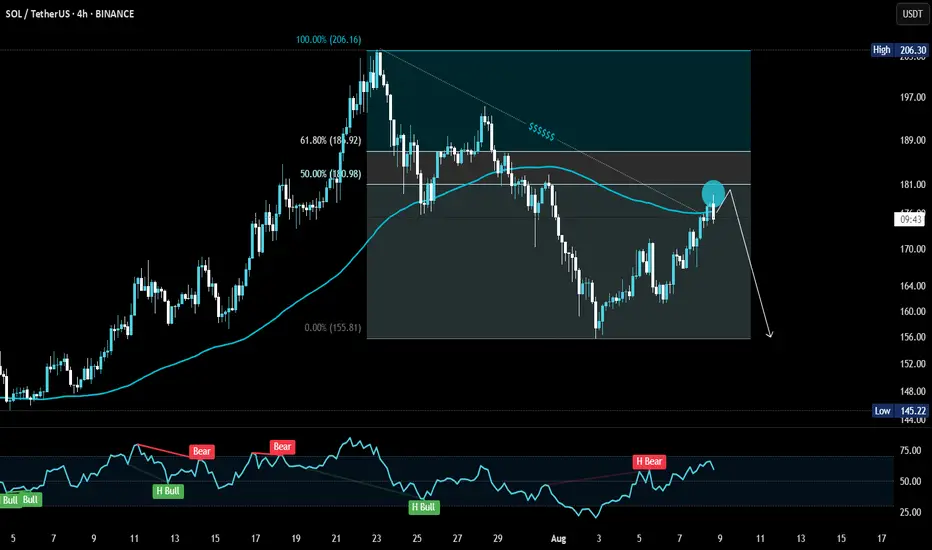
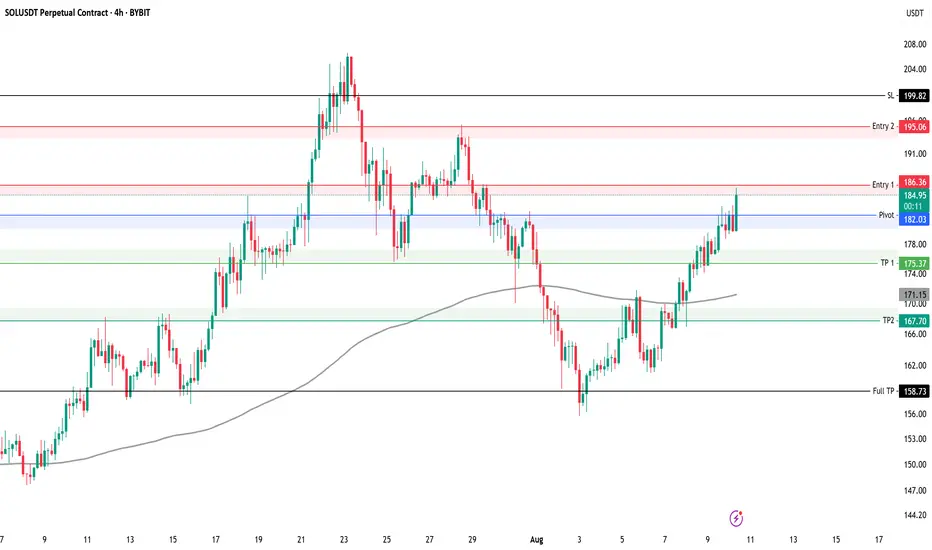
SOLUSDT Short Key levels to watch for SOLUSDT 4H
We have taken first entry on this setup using 0.5% risk
Risk per entry 0.5%
Entry 1: 186
Entry 2: 195
TP 1: 175
TP 2: 167
Full TP: 158
SL: 199
Always manage your own risk. None of the above is financial advice.

SOL may test 170 before fallingThe SOL structure is quite weak. The price previously broke the upward trend and entered the range of 170-157 as part of a downward movement.
The market is reacting to Bitcoin's rebound, and in this case, SOL may test resistance at 169-170 before falling.
The upward trend has been broken by a H&S reversal pattern. The potential is temporarily changing, and before the long-term bullish trend continues, the market may test deep areas of interest from the support side.

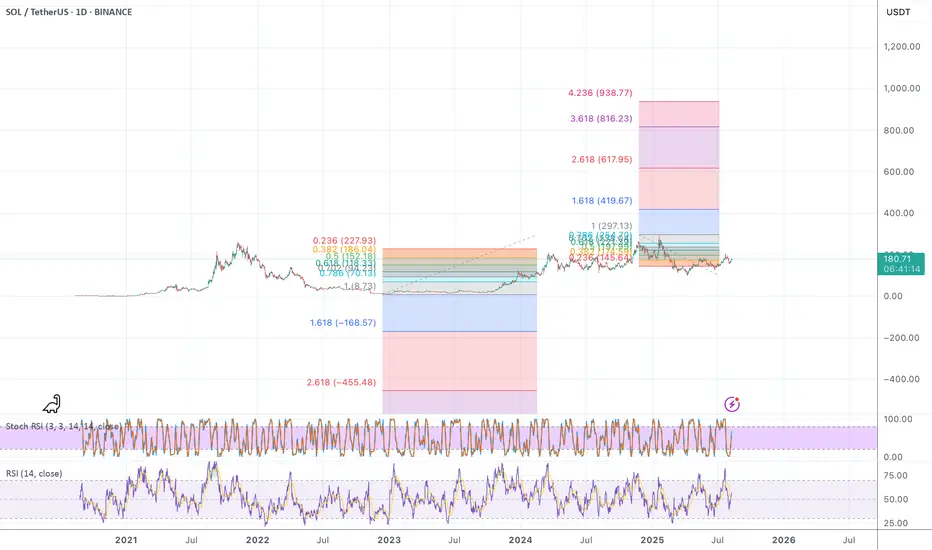
Solana · $420, $620 or $1,000? · 2025 or 2026 New All-Time High?Based on what is happening now we know September 2025 to be the month of Crypto. A local top. Next month is going to be something for the record books. The altcoins market will be wild and there will be millions and millions of people buying and selling cryptocurrencies. It will not be the end of the bull market, this is only a part.
Solana has been doing great. The chart looks good and we have five days green.
The last retrace lasted only 11 days. Compare this to the previous retrace that lasted 30 days. One long, one short. One flat, one rounded. One big, one small. Etc. The law of alternation.
What more can we extract from this law of alternation? A blow off top in 2025.
A blow off top not only means little time to sell, but it also means a crazy wick on wave 5. The next all-time high can go beyond $420 and hit $620 or even $1,000 or more. That is because once the top is in it will not be visited again for 2-3 years, and so the market will give it its all.
Solana is looking good, the chart has more to say. The action is happening above all moving averages—MA200, EMA277, EMA144, etc.—and since April we have a rising trend.
What you are seeing is a sort of bullish consolidation. Like sideways but with an upward bent.
The best is yet to come. Once the consolidation period is over, Solana will shoot straight up. $420 will be the main target for this move but is likely that the bull market will give us more. $620 or $1,000. Soon we will know.
Namaste.

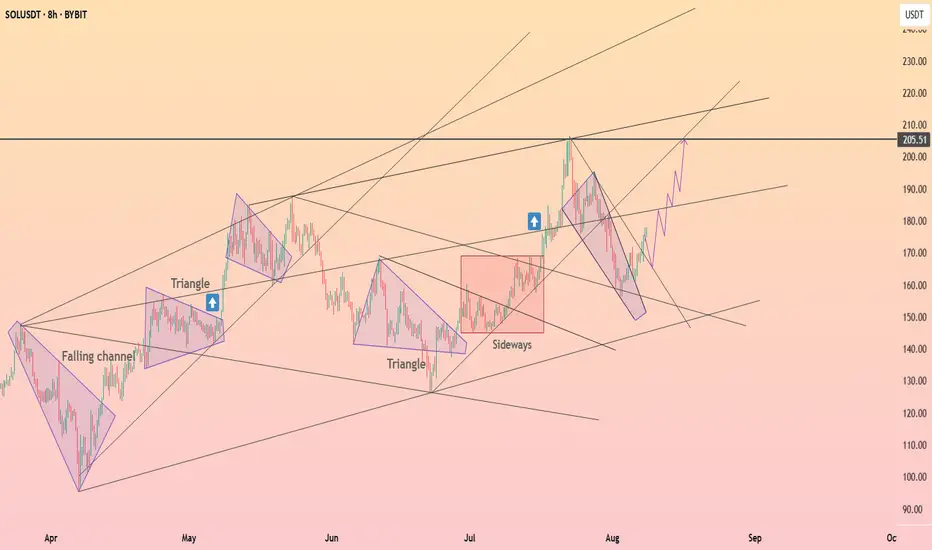
Solana consolidated above the descending wedge ┆ HolderStatBYBIT:SOLUSDT rotated higher after a swift corrective channel, reclaiming the mid‑range and pushing back toward the 195–205 supply. The chart highlights repetitive triangle resolutions and a strong sideway accumulation before the last impulse, suggesting ongoing demand. Immediate support sits at 176–180 and 168–170; holding above keeps attention on 195, then 205. A breakout through 205 unlocks 210–215 near the upper trend band. Only a daily close beneath 168 would compromise the structure and re‑open 155–160. Until then, dips remain buyable with targets at 195/205.
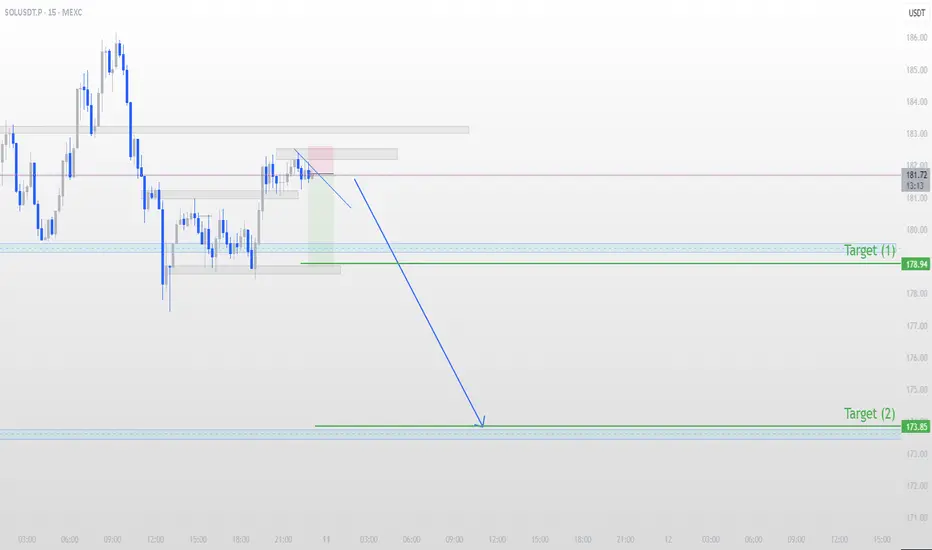
SOLUSDT Short Setup – Targeting Key Demand ZonesContent:
Price has retested the supply zone and shown rejection, forming a descending structure on the 15m chart.
My plan:
Entry: After confirming break of minor support.
Target 1: 178.94 (near-term demand / liquidity zone)
Target 2: 173.85 (major demand zone from previous structure)
Invalidation: Above the recent supply zone.
This setup is based on structure break + supply zone rejection.
Not financial advice — trade safe and manage risk.
SOL 1H – Demand Zone Bounce Brewing, Can Bulls Reach $205 Again?Solana is once again testing its high-volume demand zone near $155–$160 — a level that previously launched it toward local highs near $210. With price dipping back into this area and Stoch RSI bottoming out, the stage is set for a potential bounce play.
🔹 Structure & Key Zones
The blue box marks a clear price memory zone — tested multiple times throughout late July and early August.
Each bounce from this zone has led to significant rallies — suggesting strong underlying demand.
Two major resistance levels remain overhead: ~$195 (lower high supply) and ~$210 (range high).
🔹 Momentum Context
Stoch RSI is once again in the oversold zone, hinting at possible short-term reversal momentum.
A clean reaction from this demand area could lead to a strong leg higher — especially if the $170–$175 zone is reclaimed.
🔹 Trade Scenario
Potential setup: price tags demand → forms a local higher low → pushes through short-term resistance toward the upper range.
If this bounce plays out, bulls may target the $195–$205 zone — creating a potential 30%+ move.
Is SOL ready to bounce — or will this demand zone finally give way?
Comment below and share your setup 👇

SOL - How high can this thing fly? 1000USD?? Checking the fibbs here I see what is possible.. is it really?
It looks to me like this thing hasn't even started yet.
Can it go to 1000USD? Tell me your thoughts
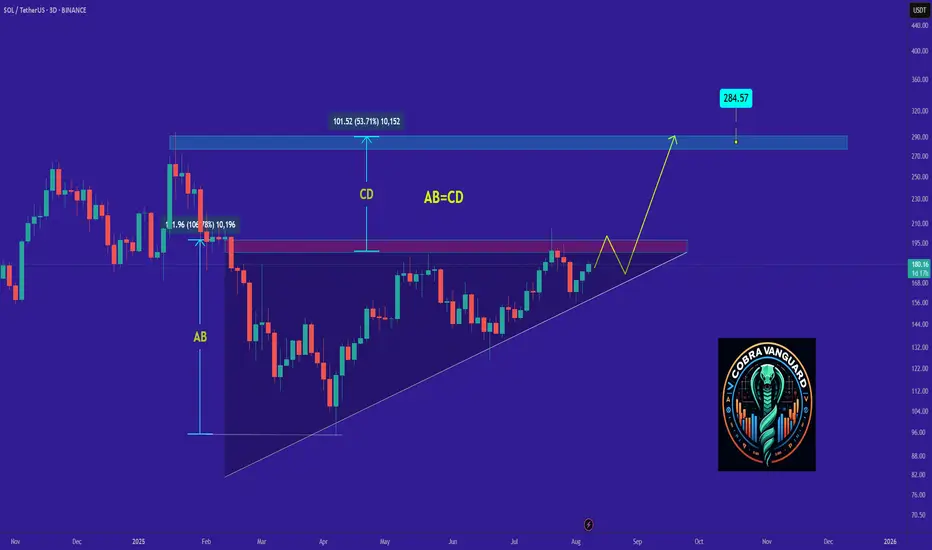
SOL's Situation, A Comprehensive Analysis !!!The price on the 3d timeframe is within an ascending triangle, which can be promising. If the price breaks this pattern with bullish candles, it could easily rise by the distance of AB=CD .
Best regards CobraVanguard.💚
SOL's Golden Pocket: Is This the Bottom?SOL just tapped into the golden pocket zone and swept sell-side liquidity. Creating a high-probability long opportunity.
🟢 Long Setup:
Entry Zone: $156.67 – $151.50
Stop Loss: Below $150 (clear invalidation)
Target: $172
Risk:Reward: solid R:R setup
Why This Zone? Confluence Breakdown:
Golden Pocket retracement (0.618–0.666)
1.272 Trend-Based Fib Extension
Monthly Order Block
0.5 Fib Speed Fan support
Key Level at $154.81
Anchored VWAP support layer
Pitchfork 0.618/0.666 alignment
SSL (Sell-Side Liquidity) swept
nPOC at ~$152 offers a prime entry if we see another leg down
💡 Tip: Ladder in entries within the zone and size up near nPOC if price dips further. Manage risk carefully and watch how price reacts at the zone.
🧠 Educational Insight
Golden pockets (the 0.618–0.666 Fibonacci zone) are some of the most respected levels in trading often acting as key reversal zones, especially when stacked with other tools. In this case, we’ve got a rare confluence: anchored VWAP, nPOC, monthly OB, SSL sweep etc. all lining up with the golden pocket.
When multiple technical factors align, they don’t just increase probability, they give you a tighter invalidation and a better risk-to-reward setup. That’s how professional traders spot sniper entries.
_________________________________
💬 If you found this helpful, drop a like and comment!

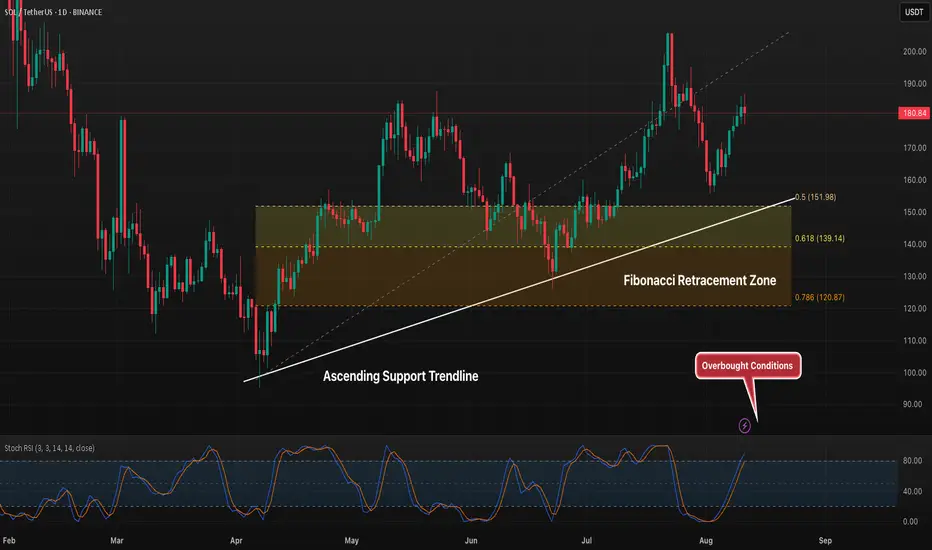
SOL 1D Holding Above Fib Zone, But Resistance Still in Play?Solana has bounced strongly from the 0.618–0.5 Fibonacci retracement zone, reclaiming ground toward the $180 level. Price remains above the ascending trendline, showing ongoing bullish structure, but it is now testing resistance while the Stoch RSI is overbought. Holding above $152 (0.5 level) would keep bulls in control, while a break below could open the door to a deeper retracement toward $139 or $121. A decisive push above $190 would confirm the next leg higher.
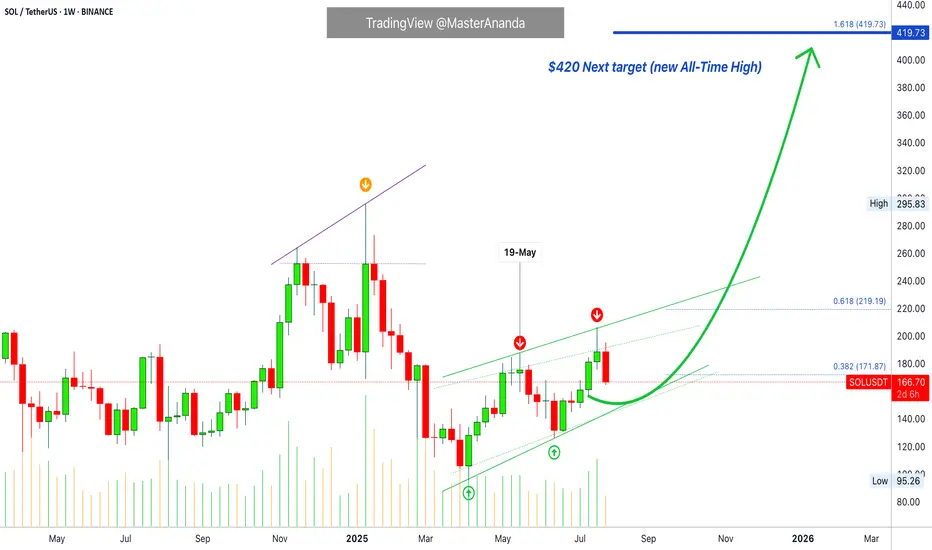
Solana Update · Retrace, Bears & The Bullish BiasSolana had a retrace in May. Notice the 19-May date on the chart. This retrace produced four weeks red. The bullish move that led to this retrace lasted 6 weeks. The last rise lasted five weeks and the current retrace might last only two weeks, can be less.
We are seeing Solana rising but this rise is not a one-time off event, this is a trend that is developing. An uptrend as a long-term phenomena is different to a short-term bullish moves. A short-term move tends to be really fast, one strong burst and that's it. A long-term move is different. Instead of seeing 2-3 candles and Solana trading at $1,000, we see dozens and dozens of candles with prices slowly rising. There are strong fluctuations but the end result is always up. And that's how you see the fluctuations on the chart.
Solana moved up and then immediately started to retrace. Then another rise and another retrace again. This retrace will end and prices will continue to grow long-term. The bulls are in. The bull market is on. Solana, Bitcoin, Crypto and the rest of the Altcoins market is going up.
Namaste.
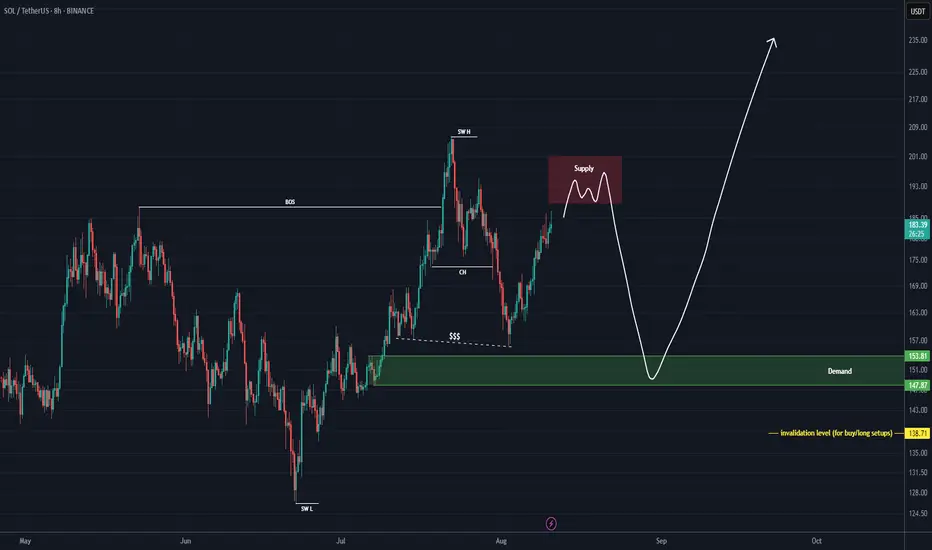
SOL Buy/Long Setup (8H)It seems that before the main bullish move, the price intends to sweep the lower liquidity pool because the momentum of the upward wave is weak.
At the bottom, we have a fresh and strong order block marked in green, which is our entry zone for the position.
If the price drops and reaches this area, a buy/long position can be taken.
The target can be above the previous swing.
A daily candle closing below the invalidation level will invalidate this analysis.
For risk management, please don't forget stop loss and capital management
Comment if you have any questions
Thank You
SOLUSDT 1D - Bulls back in control with Golden Cross and channelOn the daily chart, SOLUSDT is forming a bullish continuation structure. After the Golden Cross (MA50 crossing MA200), the price is now pulling back toward the midline of the ascending channel and the 0.5 Fibonacci level at 166.38. This confluence with the broken trendline and 200 EMA makes this zone a prime technical area of interest.
Support: 166.38 (0.5 Fibo), EMA200 (161.77), broken trendline
Resistance: 182.84–189.67 (Fibo 0.705–0.79), 206.54, target - 255.93 (Fibo 1.618)
This retracement looks healthy, supported by higher volume during the prior bullish leg. As long as the 166.38–161.77 zone holds, continuation toward 206.54 and potentially 255.93 is on the table.
Fundamentally, Solana remains a key L1 narrative with strong traction in DePIN and AI-linked dApps. The rising TVL and investor sentiment support the trend.
Watch price action around 166 for confirmation - this is the battleground.

SOLANA Breaking Out?Solana look ready to rip. As you can see, we had a golden cross between the 50 MA and 200 MA (which I shared at the time), which is now acting as clear support on the last few daily candles. Price appears to be leaving the station.
It may not be full blown alt season, but it looks good for major with a narrative.
[SeoVereign] SOLANA BULLISH Outlook – August 11, 2025Recently, Solana’s price movement has been showing a very classic Elliott Wave pattern.
Based on this, I would like to present a bearish outlook this time.
The basis for this idea is as follows:
Wave 5 = 50% of the length of Waves 0–3
Wave 5 = equal length to Wave 1 (1:1 ratio)
In addition, the fact that Wave 5 is forming an ending diagonal pattern strongly suggests the possibility of a decline.
Please refer to the chart for more details.
Accordingly, the first target price has been set at 175 USDT.
I plan to continue updating this idea as the movement unfolds.
Thank you.

SOLANA I 3M CLS I 3STD Deviations Extension = $538 TargetHey what up traders welcome to the COT data and Liquidity report. It's always good to go with those who move the market here is what I see in their cards. I share my COT - order flow views every weekend.
🎯 Non Commercials added significant longs and closed shorts at the same time. So for that reason I see the highs as a liquidity for their longs profits taking.
📍Please be aware that institutions report data to the SEC on Tuesdays and data are reported on Fridays - so again we as retail traders have disadvantage, but there is possibility to read between the lines. Remember in the report is what they want you to see, that's why mostly price reverse on Wednesday after the report so their cards are hidden as long as possible. However if the trend is running you can read it and use for your advantage.
💊 Tip
if the level has confluence with the high volume on COT it can be strong support / Resistance.
👍 Hit like if you find this analysis helpful, and don't hesitate to comment with your opinions, charts or any questions.
"Adapt what is useful, reject what is useless, and add what is specifically your own."
— David Perk aka Dave FX Hunter ⚔️

SOLUSDTSOL reclaiming the 200 EMA with the 50–61.8% Fib zone as confluence — watching $181 for the breakout or rejection. 🚀📊