When Profit Comes, Leave Before It Vanishes Again. how??!!Have you ever stayed in a winning trade just to get more?
That voice whispering “keep it longer, this might be the big one”?
It’s the same voice that’s emptied thousands of portfolios...
Hello✌️
Spend 2 minutes ⏰ reading this educational material.
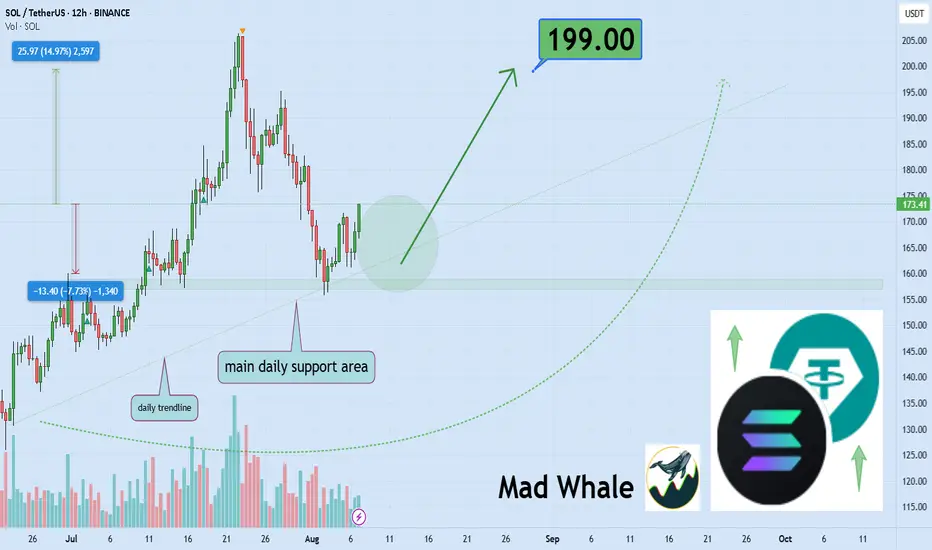
🎯 Analytical Insight on Solana:
BINANCE:SOLUSDT has seen healthy volume recently and is testing key daily support along with an important trendline. Holding these zones could fuel a 15%+ rally toward the $199 mark 📊🚀
Now, let's dive into the educational section,
🧠 The Psychology of Greed: Profit’s Evil Twin 😈
When you enter a trade and it starts moving in your favor, your subconscious kicks in. Suddenly, your brain whispers: “Just a little more... hold it!”
That’s when the greed game begins.
No matter how well you planned before the trade, once you're in profit, your brain creates a fantasy. A future where profits double, triple... a dream world. And this dream is exactly what makes traders give back everything including their original capital.
Our minds are wired to crave the rush of winning again. It’s like a hit of dopamine. So you hold the position even when the chart is flashing reversal signs. That’s the setup for disaster...
📉 Take-Profit Levels: Why Getting Out Is the Real Win 📌
Here’s the cold truth
If you don’t exit when you planned to, that profit was never really yours
A take-profit isn’t just a number. It’s a psychological boundary that separates a disciplined trader from an emotional one. Many beginners think setting a TP means giving up potential gains but in reality, it means respecting your plan and your capital.
You’ll always have another chance to trade. Always
But if greed wipes out your funds, there’s nothing left for the next opportunity
Each trade is just a chapter, not your whole story.
🧪 The Social Media Trap: When Your Brain Stops Thinking 📱
Online hype is poison. From “X coin just did 100x” to “I made $50K in a weekend” your brain gets hijacked.
You start chasing fantasies, not trades
That illusion of overnight success makes you ignore your own strategy. You stop following your plan and start trying to copy people who probably aren’t even real.
This is how social media slowly pushes traders into ruin
You feel left behind and that fear pushes you into greedy irrational decisions.
🔧 TradingView Tools That Help You Beat Greed 🛠
Luckily, TradingView offers several tools that can help keep your greed in check and your head clear
Alerts
Set an alert at your take-profit zone so you don’t keep staring at the chart. Let the system notify you when it’s time.
Long/Short Position Tool
Use this to visually define your entry, TP, and SL. Seeing it on the chart makes it easier to stick to your plan.
Bar Replay
This is gold for practice. Rewind price action and practice exits. See how often greed would’ve destroyed your trades.
Notes
Add reminders to your charts. Write things like “Exit at 2500 don’t overstay.” When future-you sees that message, it helps stay on track.
These tools don’t just improve your trades. They show discipline. And that’s exactly the kind of analysis editors look for when picking Editor’s Choice posts.
🚪 Final Words: In and Out, That’s the Game 🎯
Taking profit is a skill but exiting on time is an art
If you learn to respect your plan and silence greed, you’ll protect your capital and your sanity
There’s always a next trade if you survive this one
✨ Need a little love!
We pour love into every post your support keeps us inspired! 💛 Don’t be shy, we’d love to hear from you on comments. Big thanks , Mad Whale 🐋
📜Please make sure to do your own research before investing, and review the disclaimer provided at the end of each post.
SOLUSDT trade ideas
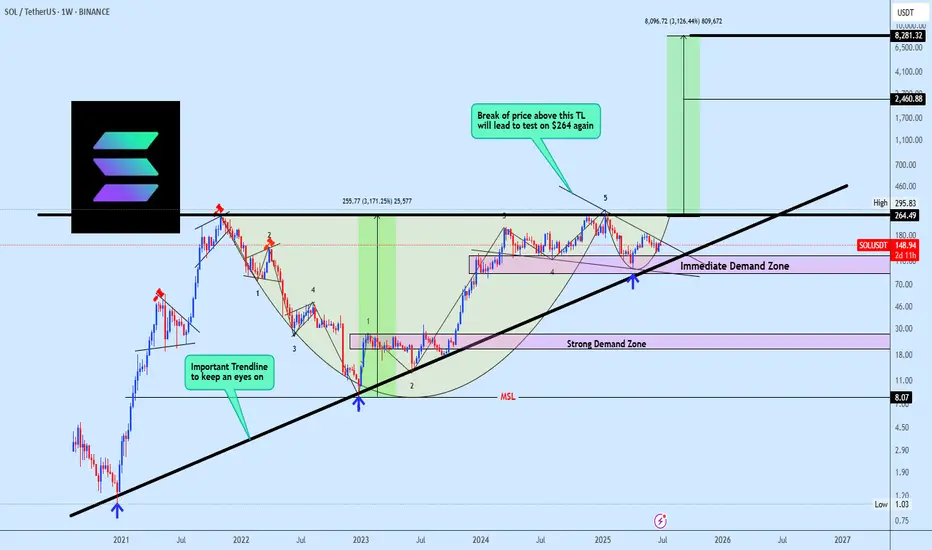
SOLUSDT Holding Long Term Trendline SupportSOLUSDT continues to show strong bullish structure, with price consistently holding above a multi-year ascending trendline a key structural element that has defined its uptrend. This dynamic support has anchored price action within a broader ascending formation, reflecting steady long-term accumulation.
Additionally, the chart reveals a well defined Cup and Handle formation, further reinforcing the bullish outlook. As long as price respects the immediate demand zone, this area remains a prime region for re-accumulation, with expectations for it to hold as a firm support level.
The projected target for this setup is clearly illustrated on the chart, aligning with the broader bullish continuation narrative.
Share your view, do you see SOLUSDT pushing higher from here, or is a deeper retest likely before the breakout?
SOL/USDT | Solana Jumps 14% – Eyes on $182, $195 & $206 Next!By analyzing the Solana chart on the daily timeframe, we can see that after correcting to $155, the price regained bullish momentum and is now trading around $178, up more than 14%. I expect this upward move to continue, with the next targets at $182, $195, and $206. This analysis will be updated soon!
Please support me with your likes and comments to motivate me to share more analysis with you and share your opinion about the possible trend of this chart with me !
Best Regards , Arman Shaban
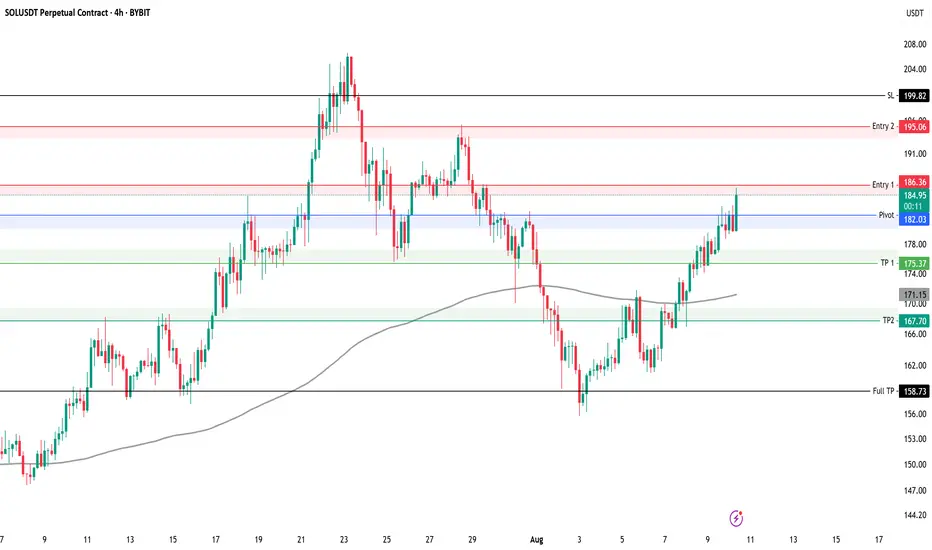
SOLUSDT Short Key levels to watch for SOLUSDT 4H
We have taken first entry on this setup using 0.5% risk
Risk per entry 0.5%
Entry 1: 186
Entry 2: 195
TP 1: 175
TP 2: 167
Full TP: 158
SL: 199
Always manage your own risk. None of the above is financial advice.
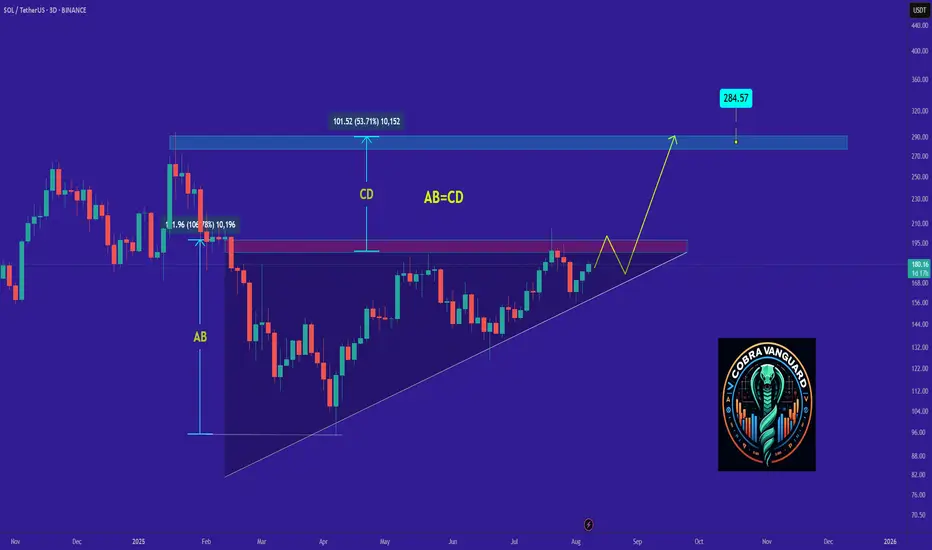
SOL's Situation, A Comprehensive Analysis !!!The price on the 3d timeframe is within an ascending triangle, which can be promising. If the price breaks this pattern with bullish candles, it could easily rise by the distance of AB=CD .
Best regards CobraVanguard.💚
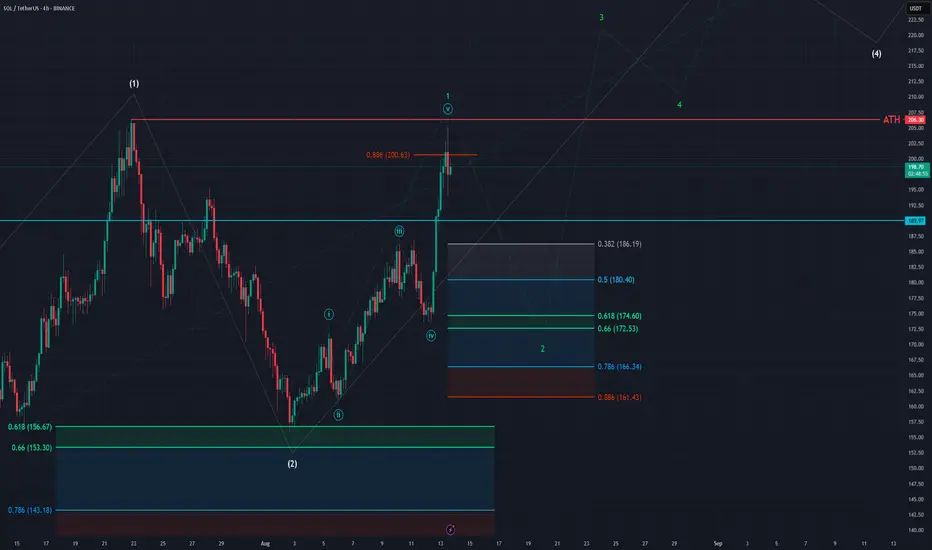
[SeoVereign] SOLANA BULLISH Outlook – August 11, 2025Recently, Solana’s price movement has been showing a very classic Elliott Wave pattern.
Based on this, I would like to present a bearish outlook this time.
The basis for this idea is as follows:
Wave 5 = 50% of the length of Waves 0–3
Wave 5 = equal length to Wave 1 (1:1 ratio)
In addition, the fact that Wave 5 is forming an ending diagonal pattern strongly suggests the possibility of a decline.
Please refer to the chart for more details.
Accordingly, the first target price has been set at 175 USDT.
I plan to continue updating this idea as the movement unfolds.
Thank you.

Solana · $420, $620 or $1,000? · 2025 or 2026 New All-Time High?Based on what is happening now we know September 2025 to be the month of Crypto. A local top. Next month is going to be something for the record books. The altcoins market will be wild and there will be millions and millions of people buying and selling cryptocurrencies. It will not be the end of the bull market, this is only a part.
Solana has been doing great. The chart looks good and we have five days green.
The last retrace lasted only 11 days. Compare this to the previous retrace that lasted 30 days. One long, one short. One flat, one rounded. One big, one small. Etc. The law of alternation.
What more can we extract from this law of alternation? A blow off top in 2025.
A blow off top not only means little time to sell, but it also means a crazy wick on wave 5. The next all-time high can go beyond $420 and hit $620 or even $1,000 or more. That is because once the top is in it will not be visited again for 2-3 years, and so the market will give it its all.
Solana is looking good, the chart has more to say. The action is happening above all moving averages—MA200, EMA277, EMA144, etc.—and since April we have a rising trend.
What you are seeing is a sort of bullish consolidation. Like sideways but with an upward bent.
The best is yet to come. Once the consolidation period is over, Solana will shoot straight up. $420 will be the main target for this move but is likely that the bull market will give us more. $620 or $1,000. Soon we will know.
Namaste.

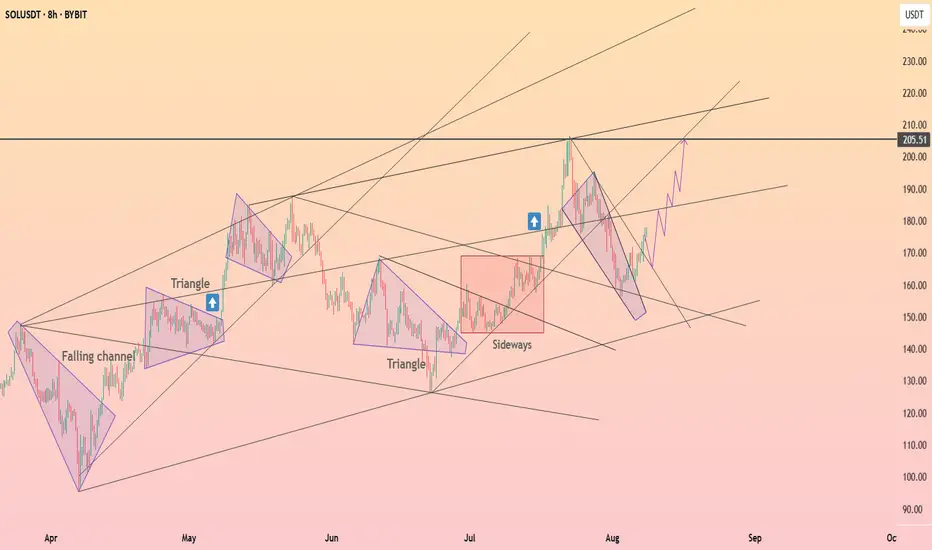
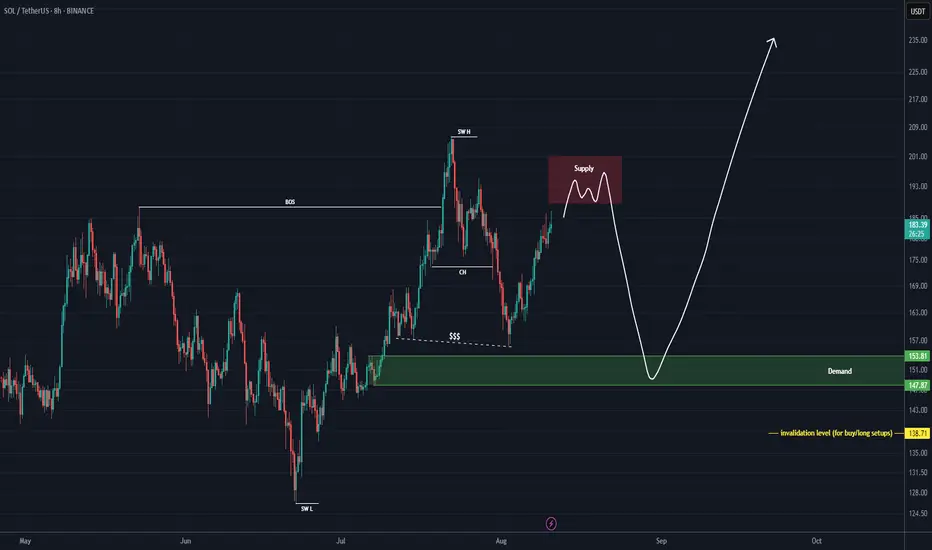
Solana consolidated above the descending wedge ┆ HolderStatBYBIT:SOLUSDT rotated higher after a swift corrective channel, reclaiming the mid‑range and pushing back toward the 195–205 supply. The chart highlights repetitive triangle resolutions and a strong sideway accumulation before the last impulse, suggesting ongoing demand. Immediate support sits at 176–180 and 168–170; holding above keeps attention on 195, then 205. A breakout through 205 unlocks 210–215 near the upper trend band. Only a daily close beneath 168 would compromise the structure and re‑open 155–160. Until then, dips remain buyable with targets at 195/205.
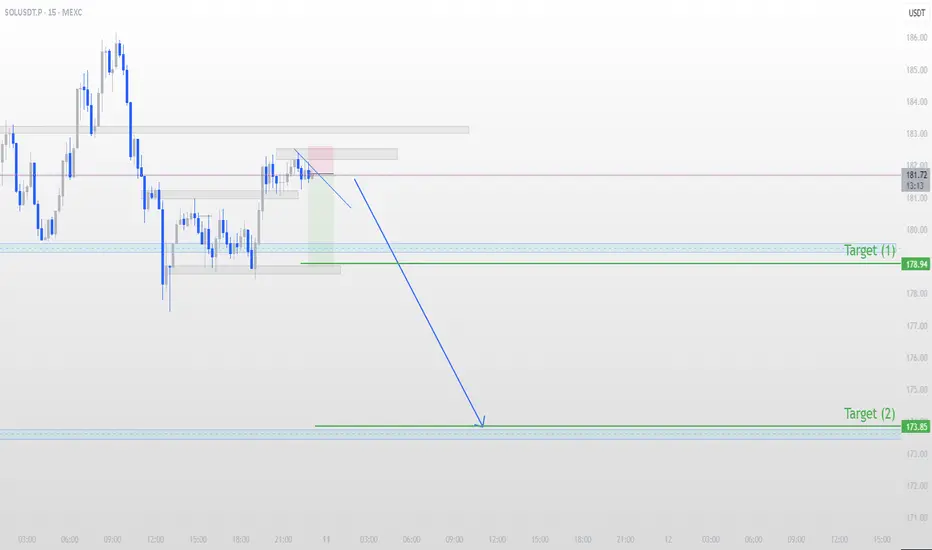
SOLUSDT Short Setup – Targeting Key Demand ZonesContent:
Price has retested the supply zone and shown rejection, forming a descending structure on the 15m chart.
My plan:
Entry: After confirming break of minor support.
Target 1: 178.94 (near-term demand / liquidity zone)
Target 2: 173.85 (major demand zone from previous structure)
Invalidation: Above the recent supply zone.
This setup is based on structure break + supply zone rejection.
Not financial advice — trade safe and manage risk.
SOL - How high can this thing fly? 1000USD?? Checking the fibbs here I see what is possible.. is it really?
It looks to me like this thing hasn't even started yet.
Can it go to 1000USD? Tell me your thoughts
SOL - 1H Elliott Wave Analysis - 11.08.25Welcome to our updated Elliott Wave Count for Solana.
We hit the in our last analysis projected target for the white Wave 3 and it seems that we started the white Wave 4 correction in the red ABC. It seems that we are still in the red Wave C but we're looking for it to finish soon.
The white Wave 4 support area which we already entered lies between the 0.236 FIB at 180.27 USD and the 0.5 FIB at 173.66 USD. We have just tested the 0.382 FIB at 176.61 USD which is the most common target for a 4th wave. The next downside targets for the red Wave C would be the 1.382 FIB at 175.03 USD and the 1.618 FIB at 173.01 USD which is in confluence with the 0.5 FIB of the white Wave 4 support area. In this impulse count we do not want to break below the 0.618 FIB at 170'70 USD.
Thanks for reading.
NO FINANCIAL ADVICE.

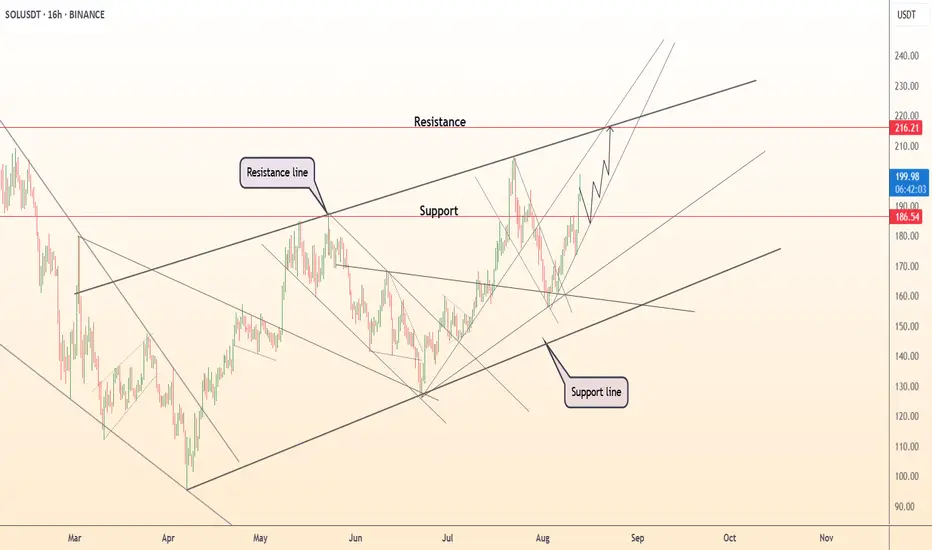
DeGRAM | SOLUSD updated the rising low📊 Technical Analysis
● SOLUSD is advancing within a steepening channel, holding above 186.5 after reclaiming mid-channel support and setting sights on the 216.2 resistance zone.
● The structure shows higher lows and accelerated momentum, with potential to challenge the upper boundary near 225 if current trendlines hold.
💡 Fundamental Analysis
● Solana’s recent integration with Fireblocks’ institutional staking service is driving positive sentiment, while on-chain activity in DeFi TVL has surged over 15% this month.
✨ Summary
Bullish above 186.5; targets 216.2 → 225. Invalidation on a close below 186.5.
-------------------
Share your opinion in the comments and support the idea with a like. Thanks for your support!
#SOLUSDT: A Big Move In Making Crypto Market Is BullishCrypto market remain bullish and as for the SOLANA we remain quite optimistic; currently price is trading at critical level and waiting for liquidity to emerge. We need strong volume for big price movement. Follow a strict risk management while trading crypto market.
Good luck and trade safe.
Team Setupsfx
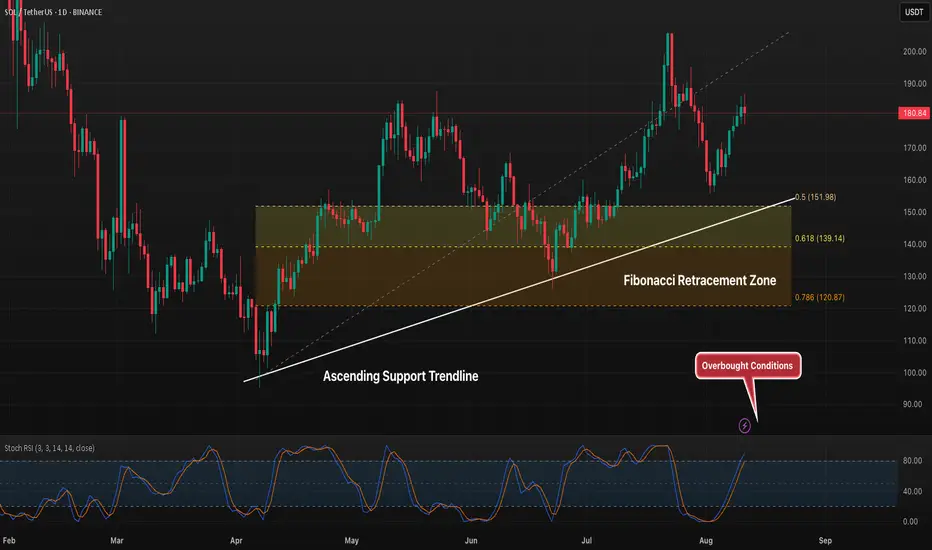
SOL 1D Holding Above Fib Zone, But Resistance Still in Play?Solana has bounced strongly from the 0.618–0.5 Fibonacci retracement zone, reclaiming ground toward the $180 level. Price remains above the ascending trendline, showing ongoing bullish structure, but it is now testing resistance while the Stoch RSI is overbought. Holding above $152 (0.5 level) would keep bulls in control, while a break below could open the door to a deeper retracement toward $139 or $121. A decisive push above $190 would confirm the next leg higher.
Lingrid | SOLUSDT Corrective Move Completed ? Long OpportunityBINANCE:SOLUSDT is forming a bullish higher low just above the 158.47 support after a corrective pullback from the recent higher high. Price structure remains within the upward channel, and the rebound from key horizontal support signals a continuation setup. As long as the 158.47–160.00 zone holds, price is likely to target the 192.00 resistance near the channel's top. The ascending structure supports a bullish continuation toward the upper resistance band.
📉 Key Levels
Buy trigger: Break above 172.00
Buy zone: 158.47 – 160.00
Target: 192.00
Invalidation: Drop below 150.00
💡 Risks
Breakdown of the ascending structure below 150.00
Rejection near 172.00 without momentum confirmation
Broader market weakness could suppress breakout potential
If this idea resonates with you or you have your own opinion, traders, hit the comments. I’m excited to read your thoughts!

SOL - 4H Elliott Wave Analysis - 13.08.25Greetings, today we are going to update our Elliott Wave Count for Solana!
Firstly, I wanted to thank you for all the boosts on our last Solana Analysis, appreciate it!
Solana did pull off an amazing rally in our blue Wave 5 which presumably is finished with that we have our green Wave 1 in. We are looking for a pullback to happen in our green Wave 2 soon.
The Wave 2 support area lies between the 0.382 FIB at 186.19 USD and the 0.786 FIB at 166.34 USD. If the price moves a few dollars higher the Wave 2 support are would just shift slightly up with it.
A break below this support area would indicate a reset of the white Wave 2 in a bigger correction which we deem unlike at this stage. Additionally the move up touched the 0.886 FIB which increases probabilities to take the previous high over the last low.
Thanks for reading.
NO FINANCIAL ADVICE.
SOL Silently Grinding Toward New Highs⚡️ Time to update one of my SOL ideas and see how things are looking.
The closer ETH gets to its ATH, the harder it becomes to push it higher — and attention starts shifting to its L2s and, of course, SOL. Over the past few days, SOL has been growing steadily. On top of that, the first-ever staking ETF in crypto history was launched for SOL — something that definitely won’t go unnoticed once the ETH madness cools down.
➡️ The first thing that stands out is the current price action. SOL has come right up to a large gap at $238–205.6. It’s already been rejected from this zone once and is now testing it for the second time. If it manages to break inside, price could move smoothly to around $216.72, since it’s a gap zone with no other resistances.
➡️ Next, Volume — we can see a divergence in buying volume, indicating a decline in buyer interest. True, ETH and BTC also moved higher on declining volumes until they approached levels near their peaks, where huge volumes kicked in. So, we could see the same pattern here. Plus, it’s no secret ETH is still at the center of attention, taking all the liquidity for itself.
➡️ Money Flow — here we see strong harmony with price, meaning liquidity is still flowing steadily into the asset, which is definitely encouraging.
📌 Conclusion:
For now, SOL is still outside the spotlight, and its trading volume barely keeps it in the daily top 10. But it’s quietly grinding toward its highs — and once the ETH hype fades, everyone will suddenly remember: “Guys! We have the first-ever staking token! And it’s also a blockchain that’s been number one in profits for months!”
By then, however, it might be too late. Because we’ve already been in the game for a while.

SOL's Golden Pocket: Is This the Bottom?SOL just tapped into the golden pocket zone and swept sell-side liquidity. Creating a high-probability long opportunity.
🟢 Long Setup:
Entry Zone: $156.67 – $151.50
Stop Loss: Below $150 (clear invalidation)
Target: $172
Risk:Reward: solid R:R setup
Why This Zone? Confluence Breakdown:
Golden Pocket retracement (0.618–0.666)
1.272 Trend-Based Fib Extension
Monthly Order Block
0.5 Fib Speed Fan support
Key Level at $154.81
Anchored VWAP support layer
Pitchfork 0.618/0.666 alignment
SSL (Sell-Side Liquidity) swept
nPOC at ~$152 offers a prime entry if we see another leg down
💡 Tip: Ladder in entries within the zone and size up near nPOC if price dips further. Manage risk carefully and watch how price reacts at the zone.
🧠 Educational Insight
Golden pockets (the 0.618–0.666 Fibonacci zone) are some of the most respected levels in trading often acting as key reversal zones, especially when stacked with other tools. In this case, we’ve got a rare confluence: anchored VWAP, nPOC, monthly OB, SSL sweep etc. all lining up with the golden pocket.
When multiple technical factors align, they don’t just increase probability, they give you a tighter invalidation and a better risk-to-reward setup. That’s how professional traders spot sniper entries.
_________________________________
💬 If you found this helpful, drop a like and comment!

SOLANA SEASON - PUMP TO 600$This analysis shows that Solana is pumping to it's ALL-TIME HIGH in this ALTCOIN SEASON!
SUBSCRIBE, BOOST AND COMMENT IN ORDER TO GET HIGH QUALITY TECHNICAL ANALYSIS.
Firstly, our Algo-based indicators are used to create this analysis.

SOL Buy/Long Setup (8H)It seems that before the main bullish move, the price intends to sweep the lower liquidity pool because the momentum of the upward wave is weak.
At the bottom, we have a fresh and strong order block marked in green, which is our entry zone for the position.
If the price drops and reaches this area, a buy/long position can be taken.
The target can be above the previous swing.
A daily candle closing below the invalidation level will invalidate this analysis.
For risk management, please don't forget stop loss and capital management
Comment if you have any questions
Thank You
$SOLUSDT about to make a new ATH!!BINANCE:SOLUSDT has broken out of a bullish flag on the Daily time frame and this second bullish leg will see CRYPTOCAP:SOL pump to about $320 in the coming weeks.
Kindly support this post to help reach other people and do comment your thoughts about the setup.
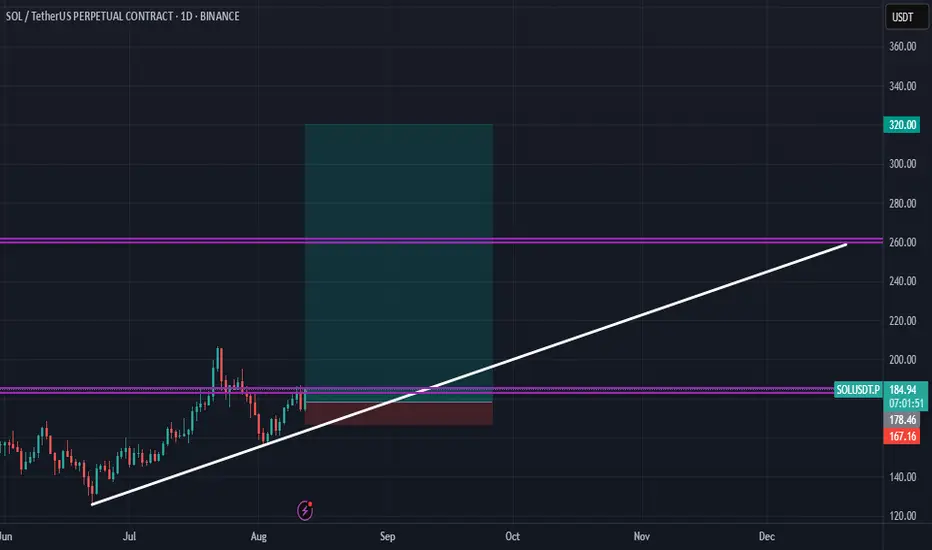
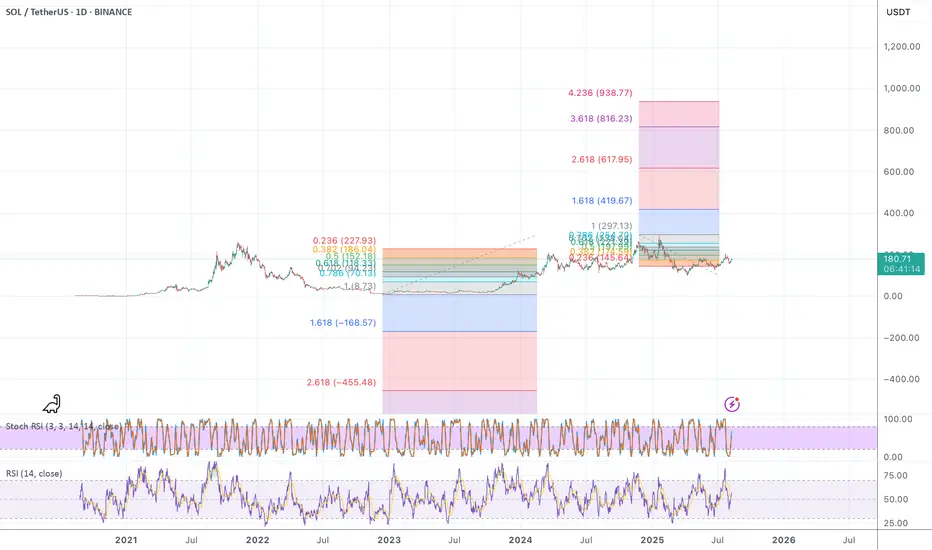
Solana Trades Above $200: New ATH Revealed, Next Target & MoreSolana has been consolidating within a very wide range since February 2024. Solana ended its bear market December 2022. The market bottom was followed by a quick bounce and accumulation phase at low prices.
A 280 days long consolidation (Dec 2022 - Oct 2023) produced a rise from $20 to $210 ending March 2024. From this point forward we have a new long consolidation period but this time instead of 280 days SOLUSDT has been ranging for 525 days. Imagine how strong the next advance will be.
280 days of consolidation was enough to produce 10X growth.
Solana produced a low recently in April and has been recovering since. Prices from late February 2024 through present day form part of a sideways consolidation channel. This period is reaching its end.
The last low marked the end of this period and the start of the next bullish wave. This bullish wave is ongoing now and soon Solana will break local resistance and hit a new all-time high.
Right after the all-time high the first resistance zone of importance is $415 ($420 in some cases). Next we have $667 ($620 in some cases) and these are the levels to watch.
Current market conditions support a rise on SOLUSDT reaching $900 - $1,100.
Soon we will know if the market can continue even higher. For now these are the targets for this 2025 bull market. We are only weeks away from a major frenzy.
Namaste.

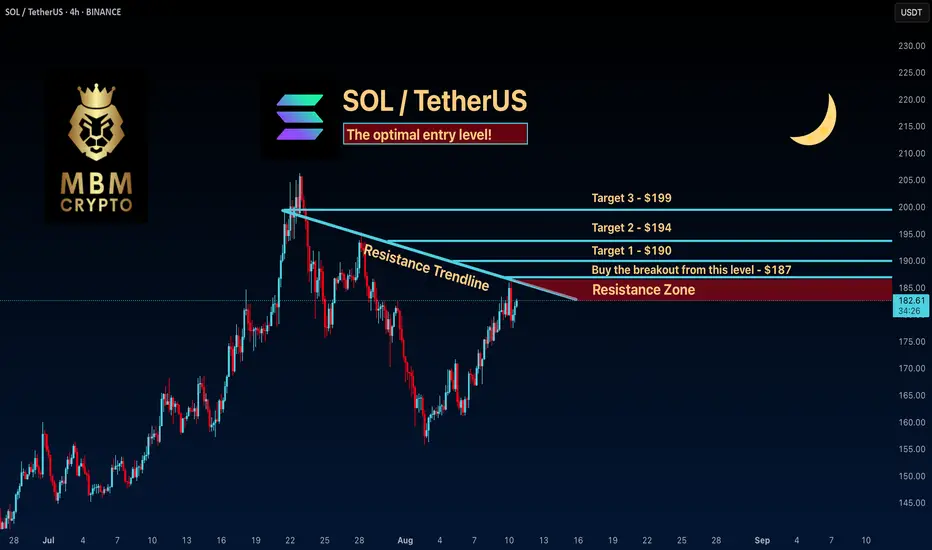
SOL: The optimal entry level!Trading Setup
If you’re considering trading SOL, here’s a quick setup that may help you.
The idea is: Buy when the price breaks above $187 and take profits at the levels shown in the chart.
Targets:
1. $190
2. $194
3. $199
-------------------------------------------
About our trades:
Our success rate is notably high, with 10 out of 11 posted trade setups achieving at least their first target upon a breakout price breach (The most on TW!). Our TradingView page serves as a testament to this claim, and we invite you to verify it!