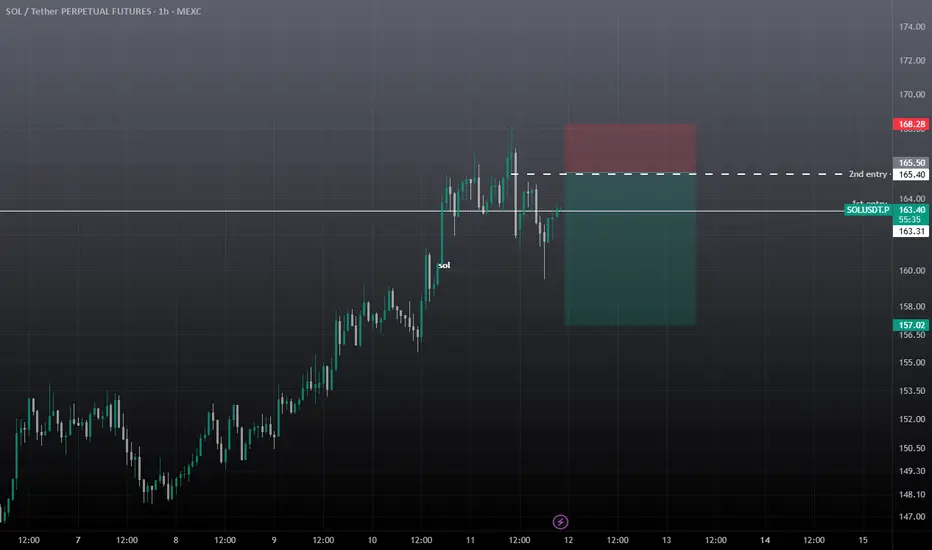
SOL USDT SCALP Long / Buy Setupwait for the entry and then take, as liquidation still lies upside, chances are high that sol will re-visit 164, before any major move to the downside. SL is important on any side. We took good profit on previous SOL short setup.
SOLUSDT trade ideas

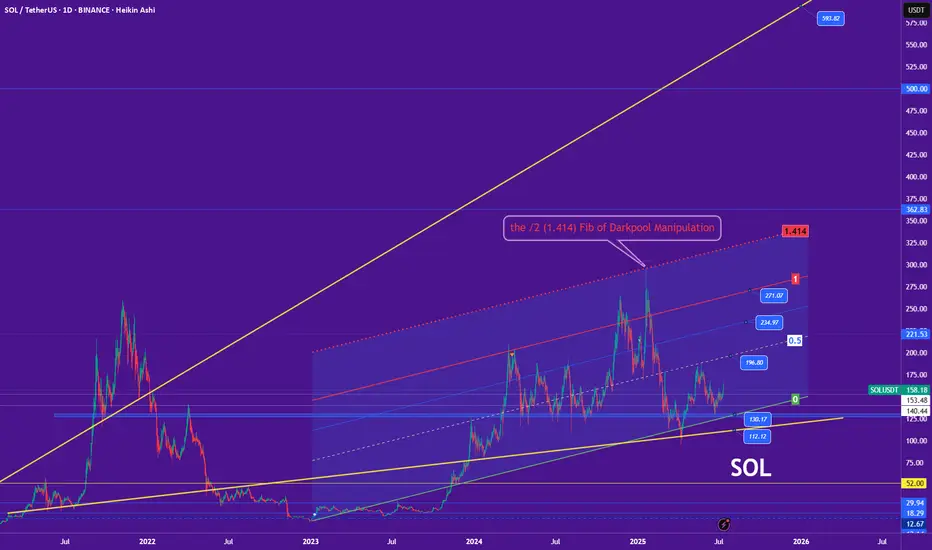
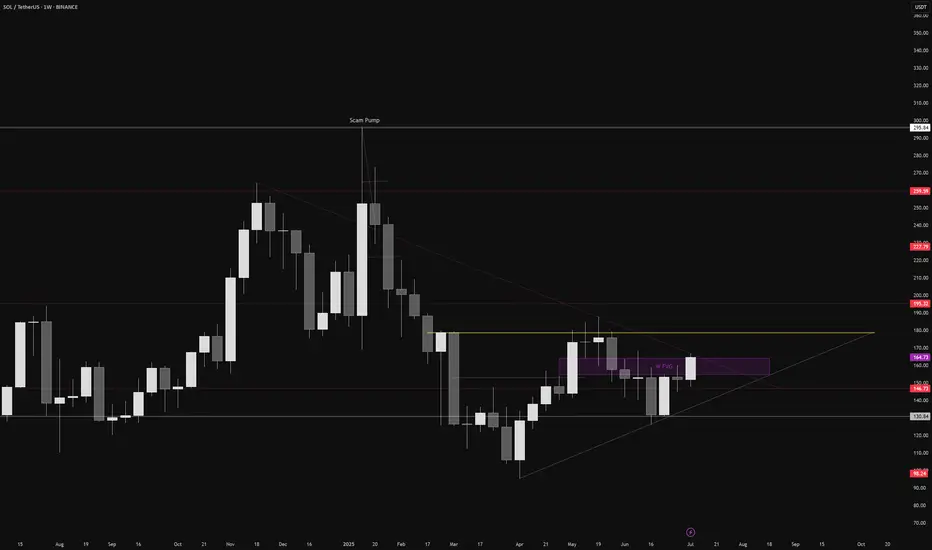
The 1.414 Fib – Smart Money’s Darkpool Fib📐💸 The 1.414 Fib – Smart Money’s Darkpool Fib 🔍🧠
Let’s talk about the 1.414 Fibonacci extension — also known as √2 — a subtle but deadly precise level that smart money uses to trap retail.
We saw this play out perfectly on Solana.
That ~$295 zone (close to 300$ but 'no cigar') ?
That was the 1.414 Fib , and it nailed the top before a brutal reversal — a textbook darkpool distribution move.
But Solana wasn’t alone.
🔁 This Isn't Just About SOL
The 1.414 (√2) level has repeated across the crypto market , quietly acting as a marker for institutional exit zones:
📉 It showed up on multiple altcoins in December 2024, just before the entire altcoin rejection
🟠 It’s even been visible recently on Bitcoin itself — yes, even the king of crypto respects this level
So no — this isn’t random. This level has a story to tell.
🤖 Why 1.414 Matters
Most retail traders fixate on the golden ratio: 1.618.
But the 1.414 (√2) is just as important — and arguably more manipulative.
It allows institutions to:
- Front-run major Fibs
- Exit quietly
- Trap late bulls
It’s less obvious, less crowded, and often more effective.
That’s why I call it the "Darkpool Fib."
💔 Why I’m Divorcing Altcoins — But Not Yet
Solana’s chart — and its story — are symbolic of a deeper shift in me as a trader.
I’ve made the decision: at the end of this cycle , I’ll be divorcing altcoins.
Not out of hate — but out of clarity. I won’t “believe” in them anymore. I’ll just trade them.
But let’s be clear:
That moment isn’t now.
Right now, I’m still bullish. I still see opportunity. I’m here to ride the structure — while it’s still giving, or at least going to give something back.
📍Take Solana...
🔹 It was built on Rust, a language praised for speed and performance — perfect for high-throughput, data-heavy blockchain architecture
🔹 It could have been the chain that led us into the future
🔹 Instead, it’s become a memecoin playground , with repeated outages and centralized concerns
I don’t hate it. I just don’t believe in it the way I used to.
Narratives die. Structure doesn’t.
So yes — I’m trading SOL. I respect its levels. But I’ve let go of the idea that it will “change the game.”
I’ll trade the rally. I won’t marry the story.
📊 The Technical Setup
[📍 Support Zone: $153.48 $140.44
Below that, deeper support at $130.17 and $112.12
📍 Current Price: ~$158
📍 Upside Targets:
Minor: $196.80
Mid-channel: $221.53
Structural resistance: $234.97
Upper red trendline: $271.07
Final Extension: ~$325–$362
Potential: 271$, 362$, 490$(close but no cigar of the 500$ mark), 593$ technically is the ultimate resistance.
If Solana reclaims its momentum, this setup gives plenty of upside. But let’s be surgical. We are traders first.
⚠️ Final Thought
We’re in the phase of the cycle where hope is expensive.
Structure is free — if you choose to follow it.
Buy over support
Exit near resistance
Trade the level — not the label
One Love,
The FXPROFESSOR 💙
Disclosure: I am happy to be part of the Trade Nation's Influencer program and receive a monthly fee for using their TradingView charts in my analysis. Awesome broker, where the trader really comes first! 🌟🤝📈
SOL Breakout Confirmed – Golden Pocket Pullback Next?Solana just posted a clean Break of Structure (BOS) from a long-term descending wedge and is now hovering above a major breakout zone. A deeper pullback into the Fib Golden Pocket (130–141) could present a high-conviction buy opportunity.
The confluence of:
0.5–0.618 Fib retracements
Rising wedge support
Previous breakout structure
…makes this area a prime “Buy Zone” to watch. A higher low here could fuel the next macro leg toward $190+.
📍 Key Levels:
Buy Zone: $130–$141
Resistance: $193.80
Support Trendline: Still intact
👀 Monitoring RSI oversold + reclaim signals for optimal entry.
#Solana #SOLUSD #GoldenPocket #Breakout #CryptoSetup #Fibonacci #QuantTradingPro #TradingView

SOL Sell / Short SetupSell at cmp 163.49, 2nd entry mentioned and tp also mentioned, Must keep SL, best of luck.
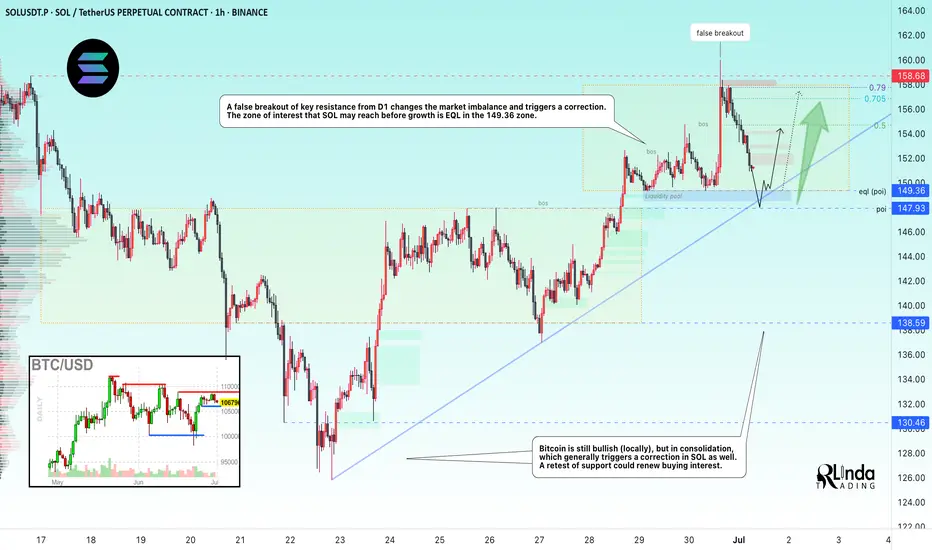
SOLUSDT → Countertrend correction and hunt for liquidityBINANCE:SOLUSDT looks quite promising on the bullish side. The price is testing one of the key resistance levels within the local trend rally. A correction is forming. Is it beneficial for us?
On the higher timeframe, we see a change in character, a breakout of the trend resistance, and the formation of an upward trend support line. Bitcoin is still bullish (locally) at this time, but it is consolidating, which generally provokes a correction in SOL as well. Focus on the 150-149 area. If the bulls are able to keep the price above this zone after the retest, followed by the formation of momentum, this can be considered a positive medium-term sign.
Locally, the price within the trading range of 149.36 - 158 is heading towards the area of interest and liquidity (eql) at 149.36. The current sell-off is most likely triggered by a large player seeking a more favorable entry into the market.
Resistance levels: 154.75, 156.8
Support levels: 149.36, 147.93
In the current situation, it makes the most sense to consider an intraday trading strategy. A countertrend correction and a retest of support could attract buyers...
Best regards, R. Linda!
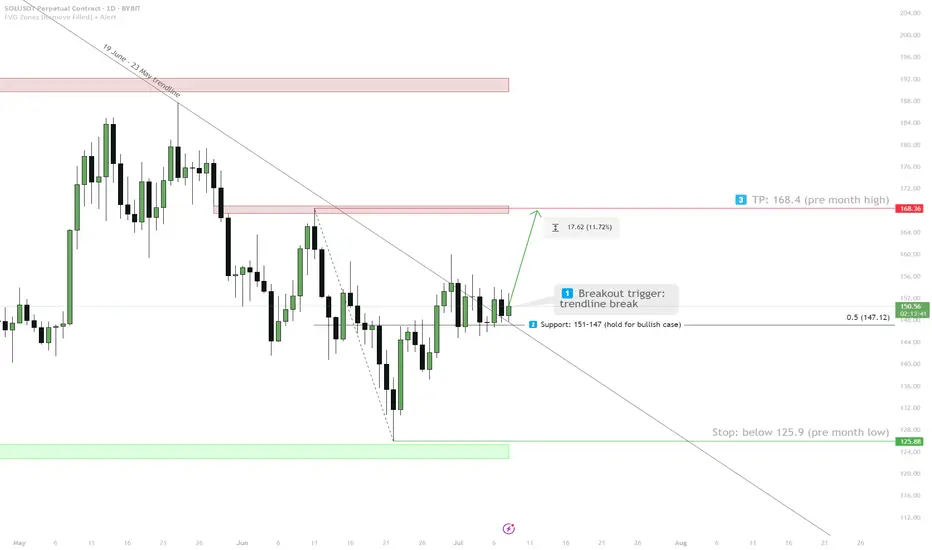
SOL — Breakout Watch & Range Play1. Watch for breakout above trendline
2. Hold support 151–147 for bullish scenario
3. Target: 168.4 (pre month high)
4. Stop: below 125.9 (pre month low)
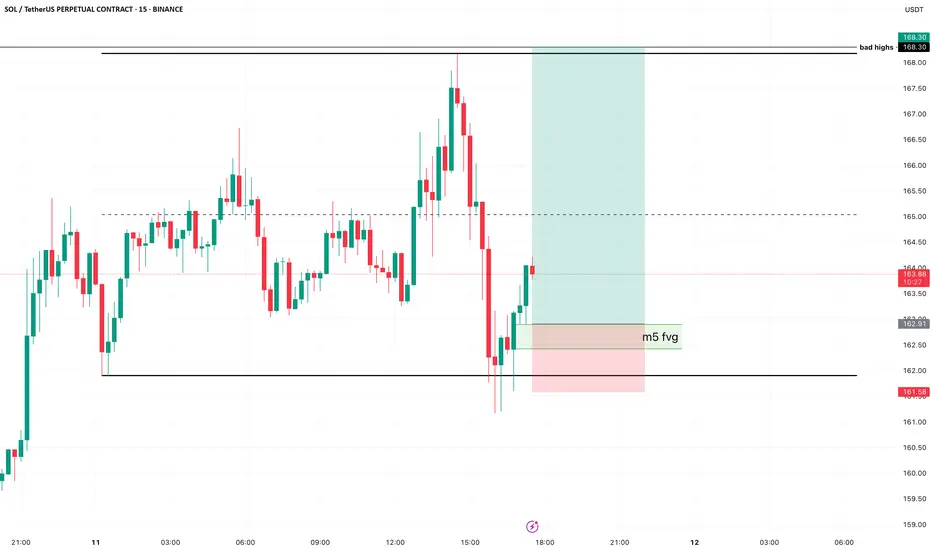
SOL - Grab the bad highs??If you zoom out on H4, you see that SOL just didn't take the highs there, creating bad highs with our current high.
I'm looking at this little range, hoping we get another small pullback into the fvg on m5, where we can have a clean long into those highs.
I kept the stop rather tight, because the lows are bad lows as well, so it's possible we get stopped, but then get a sweep to try again.
The market saw a lot of upside in little time, be careful with managing risk with these kind of toplongs.
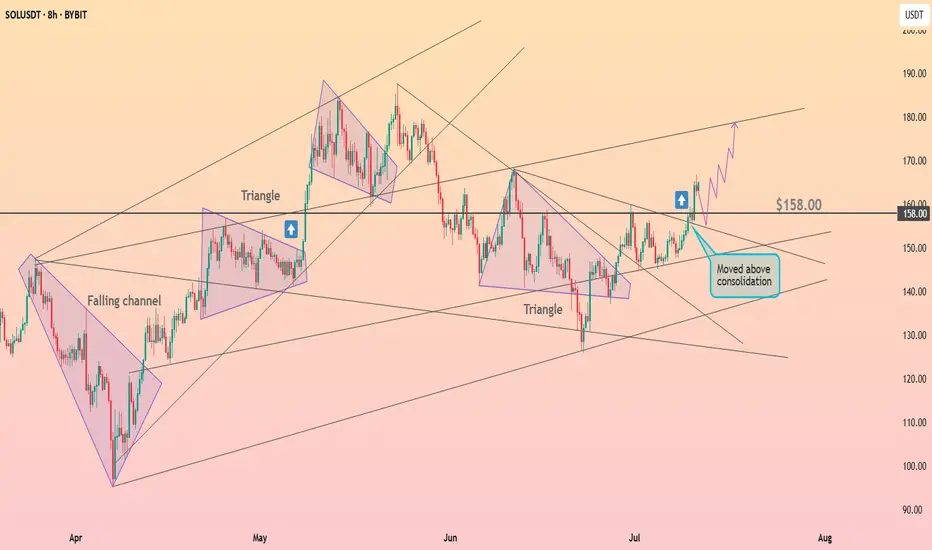
HolderStat┆SOLUSD above the $158 levelBYBIT:SOLUSDT broke through the $158 consolidation resistance following a strong triangle breakout. This confirmation shift puts the $180 resistance level within reach. The market structure continues to print higher lows, suggesting an ongoing bullish trend.
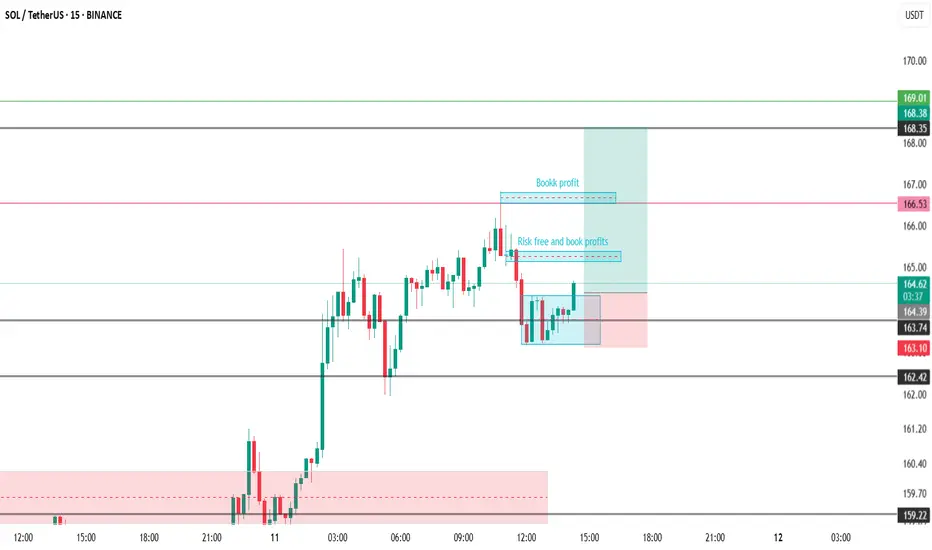
SOLUSDSell SOLUSD Candle Stick Pattern
SL TP EP All In Charts Prolong your targets but risk free and book partially your trade
Lets see how it goes

SOL Breakdown: Short Opportunity Before the Next Bull RunSOL is approaching resistance and has broken the rising wedge on the 15-minute timeframe. A significant dip is likely before the actual bull run begins.
Short entry: Around $164.50
Stop-loss: $166 – $166.50
Take-profit targets: $160 and $156
This setup offers a good scalping opportunity in the short term.

SOL Weekly Breakout ImminentOnce we close above this weekly fvg , next week will be big for SOL considering it holds 160
Solana #sol.usdt future Solana is at resistance level , I expect a drop from this level, you can short with me

SOL USDT SHORT TRADE SETUPSOL/USDT is currently holding at a strong resistance zone, with a high probability of an downward price move. Also RSI is overbought.

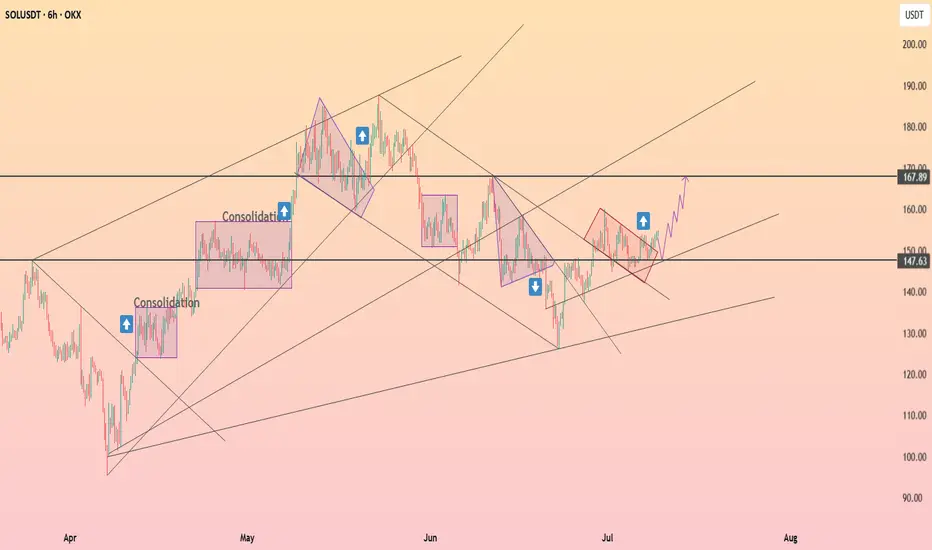
HolderStat┆SOLUSD held the support lineOKX:SOLUSDT is consolidating above 147.63 inside a rising channel. Bullish continuation is likely, with 167.89 acting as the next key resistance. Historical patterns suggest a breakout is forming.

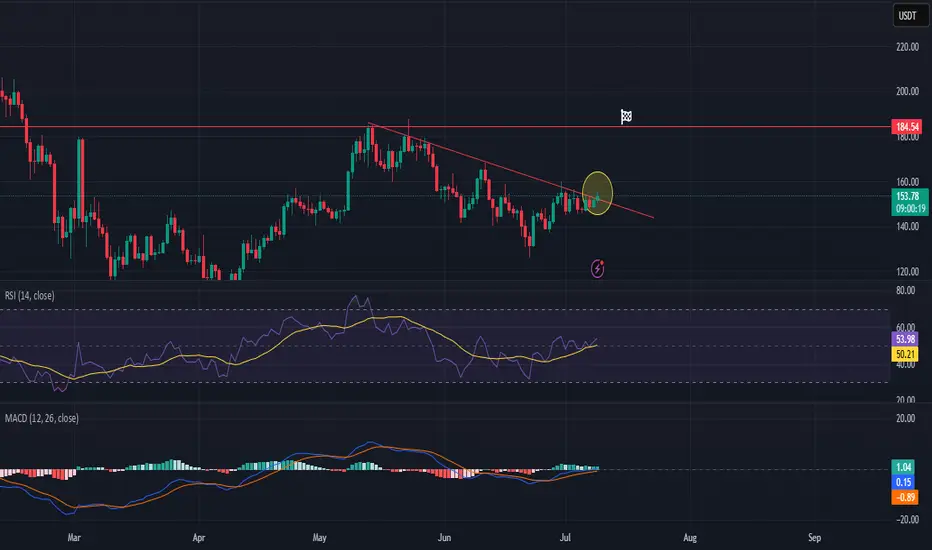
SOLUSDT longhi Traders,
We can see that price is currently trading below a well-defined downsloping trendline.
The trendline (blue) has been tested multiple times, confirming its validity as resistance.
Price action is showing higher lows, indicating building pressure, usually a bullish sign often seen before breakouts.
The breakout seems to be happening right now, so entering the long position is justified.
Target: 184
Invalidation: daily close below the downsloping resistance trendline
Weekly trading plan for Solana BINANCE:SOLUSDT The chart clearly shows a triangular correction pattern. Price has now broken the trendline and is rallying, suggesting we may see:
Retest of the local high at $160
Achievement of our first monthly target
More details in the video itself - enjoy watching
Trade safe and stay adaptive

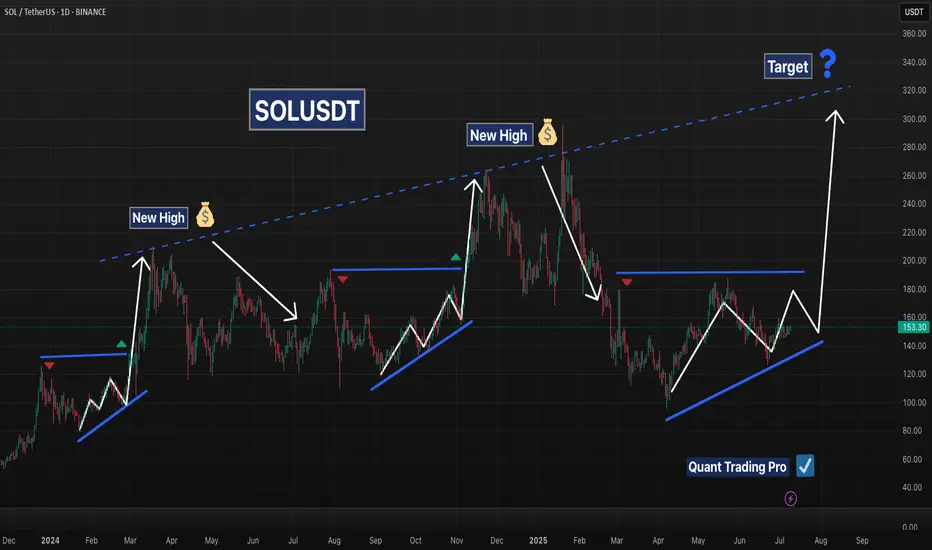
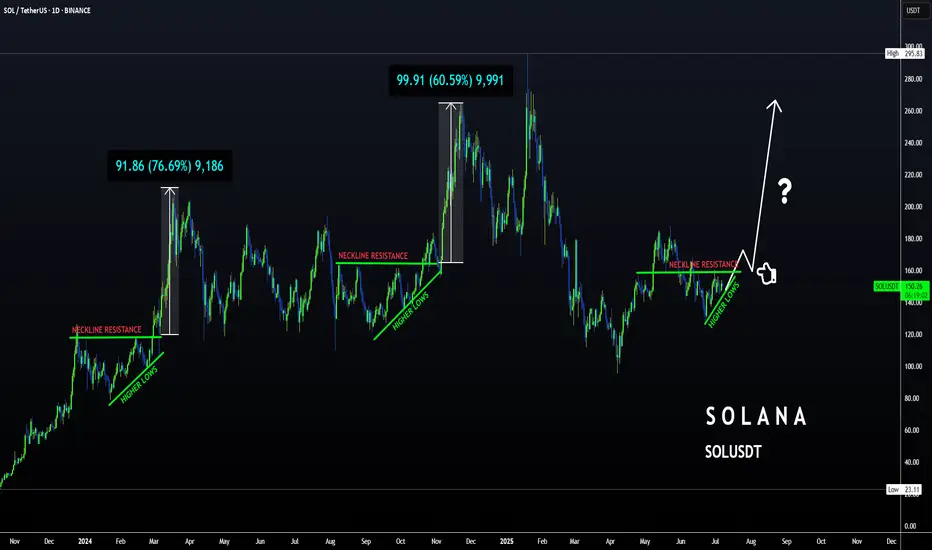
SOLANA – Repeating Structure Points to Major Upside PotentialSolana’s chart reveals a recurring bullish pattern that has played out multiple times over the past year. In each instance, SOL formed a rising base or ascending triangle followed by a strong breakout and a new high. These breakouts typically occurred after:
A series of higher lows forming an ascending structure
Compression beneath horizontal resistance
A clean breakout followed by a rapid price expansion
The current price action appears to be forming the same structure once again:
A clear ascending support trendline is intact
Price is approaching the horizontal resistance zone near $180
The 50 EMA is turning upward and price is pressing above the 200 EMA
If SOL breaks above the $180 level with volume, it could mirror previous rallies and target the long-term diagonal resistance trendline, currently pointing toward the $300–$340 range. Until then, a pullback to retest support near $140–$150 would remain within the bullish structure.
Key Technical Features:
Consistent ascending accumulation patterns
Breakout levels followed by new highs
Current setup showing a third rising base near major resistance
Clear long-term diagonal trendline acting as a historical ceiling
This is a textbook example of price memory and structural repetition. Traders should monitor for a confirmed breakout above horizontal resistance with strong volume before positioning for continuation.
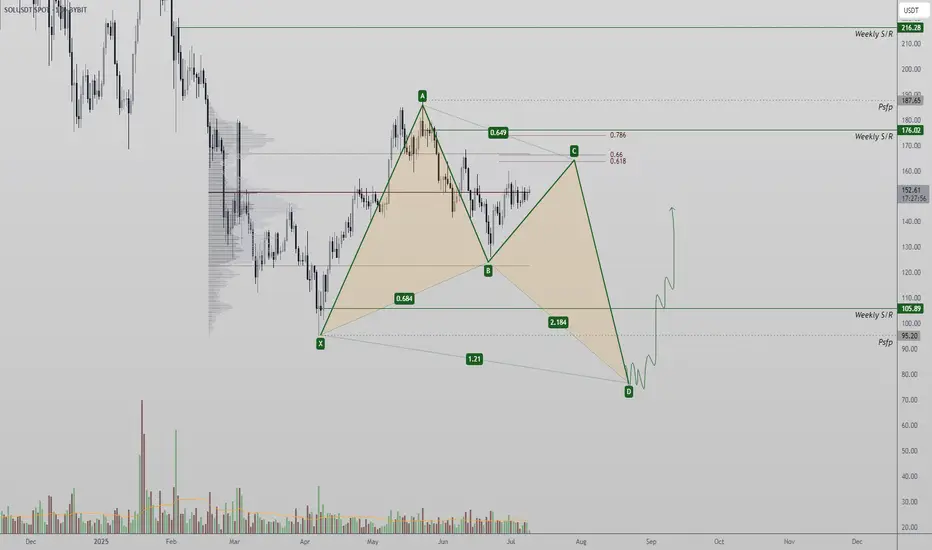
SOL Harmonic Setup — $95 Sweep May Precede Rally Toward $200 +Solana may be forming a rare bullish harmonic pattern, suggesting a possible sweep of the $95 low before a reversal targets the $200 region. Critical resistance levels remain key in the short term.
Solana is showing early signs of a high-probability harmonic setup that could lead to a powerful bullish reversal — but not before a potential sweep of the recent $95 low. From a technical perspective, price is currently trading near the point of control, battling resistance layers that may trigger the next corrective leg in the pattern. If confirmed, this harmonic could produce a textbook C-to-D leg completion before launching a move toward the $200+ zone.
Key Technical Points:
- Point of Control Battle: Price is currently testing the POC with weak momentum
- Resistance at Value Area High + 0.618 Fib: Confluence zone could trigger rejection
- C-Leg Completion Around $95: Potential low before bullish harmonic activates toward $200+
Solana’s price action has entered a critical zone of decision. Price is hovering near the point of control — the highest volume-traded level in the current range — and is now contending with a strong confluence of resistance just above. This includes the value area high and the 0.618 Fibonacci retracement, both of which have historically produced strong rejections.
If Solana fails to break through this resistance cluster with conviction, it increases the probability of a C-leg rejection within the emerging bullish harmonic pattern. This corrective move could send SOL back down toward the $95 region, sweeping the previous low and completing a technical bottom.
Such a move — while bearish in the immediate short term — would not invalidate the bullish thesis. In fact, a sweep of $95 could act as the final leg (D) completion of what may evolve into a textbook “godly harmonic” pattern. These structures are rare and powerful, typically resulting in sharp reversals when key conditions align. The eventual upside target for this move lies in the $200+ region, in line with the prior macro swing highs and high time frame resistance levels.
Until this scenario is confirmed or invalidated, Solana remains range-bound between major high time frame levels. Traders should stay alert for signs of rejection at current resistance — or, conversely, a volume-backed breakout above the value area high that would negate the harmonic setup.
SOLANA Loves THIS Pattern | BULLISHSolana usually increases alongside ETH. Possible because its a big competitor.
We can see SOL follows ETH very closely, with the exception of dipping earlier than ETH by a week:
In the 4h, we see a push to breakout above the neckline resistance:
In the daily timeframe, SOL is just about to break out above the moving averages - which would be the final confirmation of a bullish impulse to come:
Could this pattern be the confirmation of the start of another big pump for SOL?
_______________________
BINANCE:SOLUSDT
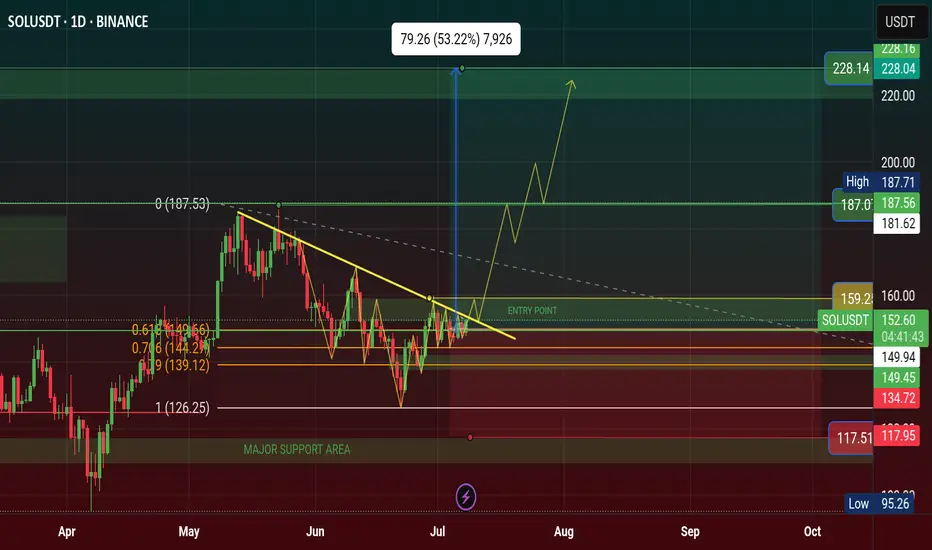
$SOL Price Will Hit $228 Q3, Inverse Head and Shoulder Pattern✨ CRYPTOCAP:SOL Price Will Hit $228 in Q3 of 2025 | Solana Chart Showing Inverse Head and Shoulder Pattern. It's a Bullish Reversal Pattern.
‣ Solana price is hovering below key resistance; a breakout above $159 and it's going to $228.
ETF Buzz Grows, but Price Action Still Caught in Limbo Here is why this could be the catalyst that sends price to all time highs Do THIS before that happens.
‣ Solana ETF Buzz Grows, but Price Action Still Caught in Limbo
🔸BlockNews The SEC has asked SOL ETF applicants to revise and refile submissions by end of July, fueling speculation of an ETF approval before October. Solana’s daily active addresses just hit a record 15.39 million, pointing to rising demand and user engagement on the network.
#Write2Earn #NFPWatch #BinanceSquareFamily #TrumpTariffs #SUBROOFFICIAL
Disclaimer: This article is for informational purposes only and does not constitute financial advice. Always conduct your own research before making any investment decisions. Digital asset prices are subject to high market risk and price volatility.
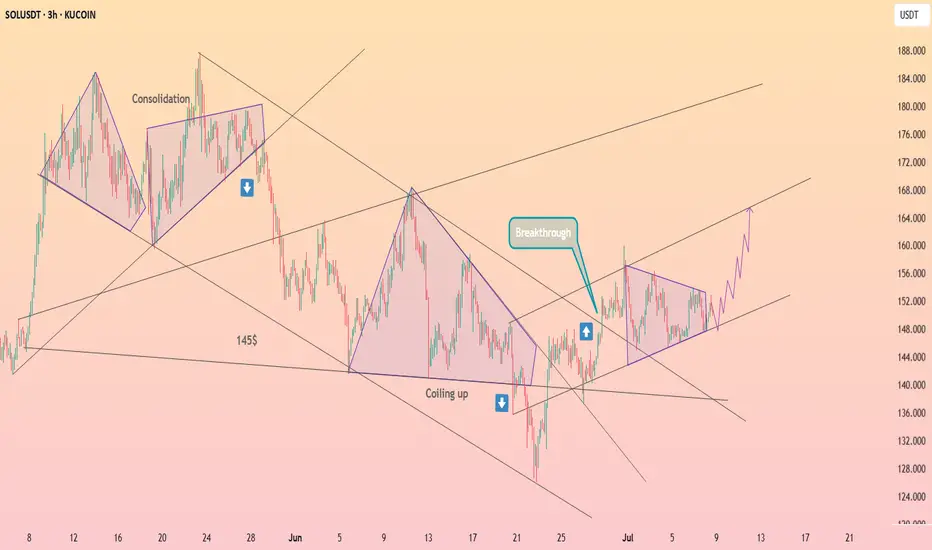
HolderStat┆SOLUSD seeks to the resistance lineBINANCE:SOLUSDT has broken out of a descending wedge and is coiling in a symmetrical triangle above 150. The setup supports a push toward 165–170, with momentum favoring bulls if the triangle resolves upward.