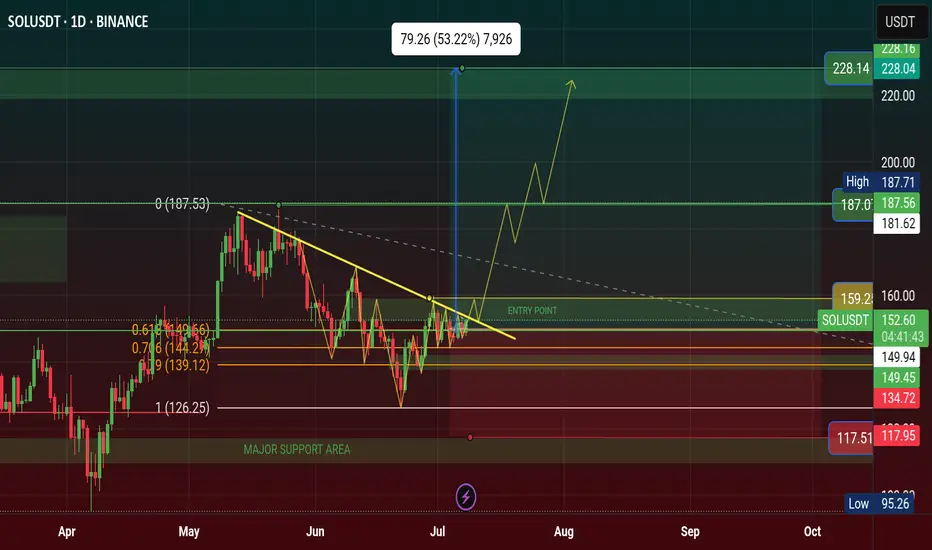
$SOL Price Will Hit $228 Q3, Inverse Head and Shoulder Pattern✨ CRYPTOCAP:SOL Price Will Hit $228 in Q3 of 2025 | Solana Chart Showing Inverse Head and Shoulder Pattern. It's a Bullish Reversal Pattern.
‣ Solana price is hovering below key resistance; a breakout above $159 and it's going to $228.
ETF Buzz Grows, but Price Action Still Caught in Limbo Here is why this could be the catalyst that sends price to all time highs Do THIS before that happens.
‣ Solana ETF Buzz Grows, but Price Action Still Caught in Limbo
🔸BlockNews The SEC has asked SOL ETF applicants to revise and refile submissions by end of July, fueling speculation of an ETF approval before October. Solana’s daily active addresses just hit a record 15.39 million, pointing to rising demand and user engagement on the network.
#Write2Earn #NFPWatch #BinanceSquareFamily #TrumpTariffs #SUBROOFFICIAL
Disclaimer: This article is for informational purposes only and does not constitute financial advice. Always conduct your own research before making any investment decisions. Digital asset prices are subject to high market risk and price volatility.
SOLUSDT trade ideas
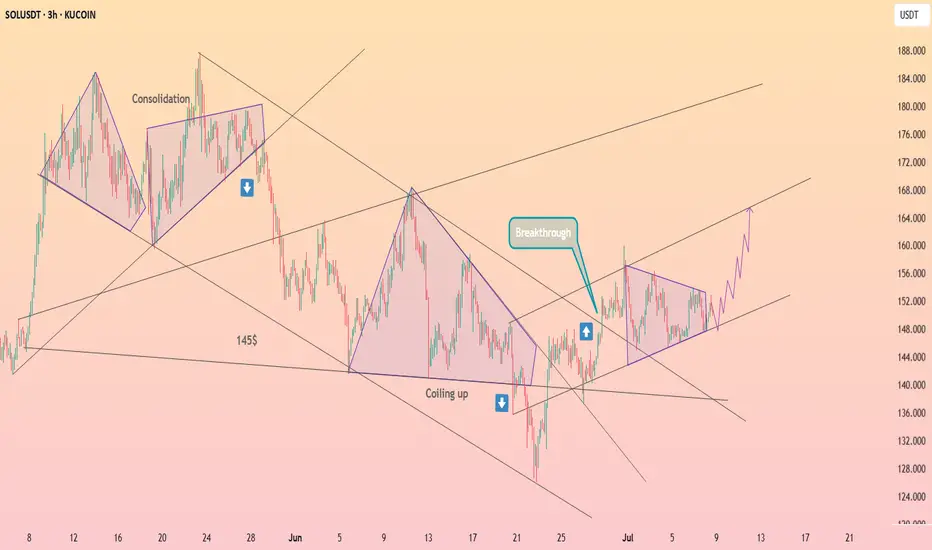
HolderStat┆SOLUSD seeks to the resistance lineBINANCE:SOLUSDT has broken out of a descending wedge and is coiling in a symmetrical triangle above 150. The setup supports a push toward 165–170, with momentum favoring bulls if the triangle resolves upward.
SHORT - SOLUSDTEdge:
- Order Flow => Increase in OI, decrease in CVD, strong increase in net shorts.
- structural edge
- CVD spot and CVD futures are diverging: CVD spot going down => CVD futures staying flat/increasing slightly. Latest wave up is solely made by leveraged positions. No real demand.

#SOL Update #3 – July 8, 2025🟠 #SOL Update #3 – July 8, 2025
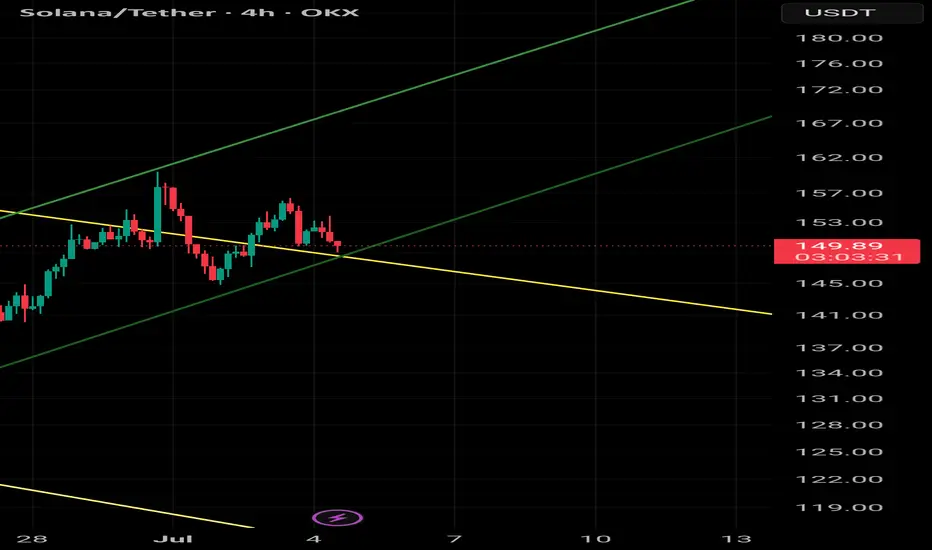
Solana, much like Litecoin, is still undergoing corrections following its latest impulsive move. While it currently holds above a strong support level, two significant resistance zones are ahead.
The market is undecided, and Solana's direction remains uncertain, making it one of the riskiest assets to trade today.
If the $145 support fails, the price may drop toward $137. Conversely, a daily close above $159 could trigger a move toward $167. For now, it's best to stay on the sidelines and monitor the price action closely.

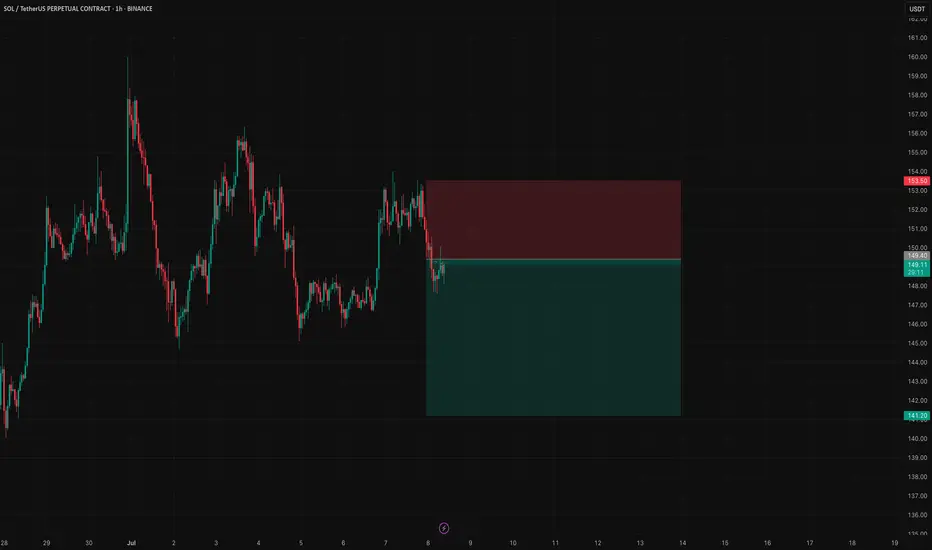
Monday, 7 July 2025 - SOL/USDT.P ShortTrading Journal Entry: SOL/USDT SHORT
Date of Entry: July 8, 2025
Asset: SOL/USDT Perpetual Futures
Position: SHORT
Entry Price: $149.40
Stop Loss: $153.50
Take Profit: $141.20
Risk/Reward Ratio: 2.00:1
Setup Grade: A+
1. Core Thesis
The trade is a high-confluence short position designed to capitalize on a probable breakdown of a key support level, driven by overwhelming bearish sentiment and a clear liquidity-based objective. The core thesis is that the market, having failed to show strength at a critical resistance point within a larger downtrend, is incentivized to purge the liquidity resting at the bottom of the local range.
2. High-Timeframe Context (The Strategic Landscape)
My analysis began with a top-down approach to understand the broader market environment.
Weekly Context: The market is in a multi-month corrective phase after a significant long-term uptrend. This indicates that the primary bullish momentum has stalled, making the market susceptible to deeper corrections and range-bound activity. Trading between major HTF zones is the governing dynamic.
Daily Context: The immediate trend on the daily chart is clearly bearish, defined by a series of lower highs and lower lows. This downtrend brought the price to a pivotal support zone identified by the Volume Profile Point of Control (POC) around $140-$145. This created the central conflict: a dominant bearish trend meeting a significant historical support level.
3. Order Flow & Sentiment Analysis (The Deciding Factor)
This layer of analysis was the key to resolving the trend vs. support conflict and solidified the bearish bias.
Liquidation Analysis: The liquidation maps revealed a very large and proximate pool of long liquidations concentrated around $145. This liquidity cluster acts as a powerful magnet for price, providing a clear, logical target for a downside move.
Funding Rate Analysis: Funding rates across the majority of major exchanges were negative. This provided clear evidence that derivative traders were predominantly positioned short and were willing to pay a premium to maintain those positions. In this context of price failing at resistance, it signaled strong bearish conviction and a market leaning heavily in one direction.
Synthesis: The presence of a large downside liquidity target (the "magnet") combined with dominant bearish sentiment (the "conviction") created a high-probability scenario for a breakdown. The path of least resistance was for the market to resolve the consolidation by pushing down to trigger the liquidity pool below.
4. Tactical Execution (The Entry Trigger)
With a firm directional bias, the final step was to find a low-risk entry.
4-Hour Structure: The price action leading into the entry was weak. The 4H chart showed a low-volume, corrective bounce that failed to decisively reclaim its Point of Control around $150. This lack of a strong rejection from the lows was a critical sign that buyers lacked control and that the support was fragile.
1-Hour Entry Pattern: I identified the perfect entry trigger on the 1H chart.
Price formed a tight consolidation pattern, building a clear support base around the $149.50 - $150.00 level.
The volume throughout this consolidation was visibly declining, indicating a coiling of energy before a volatile move.
My entry at $149.40 was a stop-limit order placed to trigger on a confirmed breakdown of this immediate support, allowing us to join the move with momentum.
5. Risk Management (The Trade's Foundation)
Stop Loss ($153.50): The SL was not an arbitrary price but a logical invalidation point. It was placed just above the structural high of the 1-hour consolidation range. A move to this level would have proven the breakdown thesis incorrect and signaled that buyers had absorbed the selling pressure.
Take Profit ($141.20): The TP was chosen for two reasons:
Rule Compliance: It mathematically secured my required 2:1 risk/reward ratio.
Strategic Placement: It sits just above the major daily support zone and the daily POC, increasing the probability of a fill before a significant HTF reaction and potential bounce.
This trade represents a textbook example of our strategy: using high-timeframe analysis to build a directional bias, confirming it with order flow and liquidity data, and executing with precision on a low-timeframe pattern, all while adhering to strict, non-negotiable risk management rules.
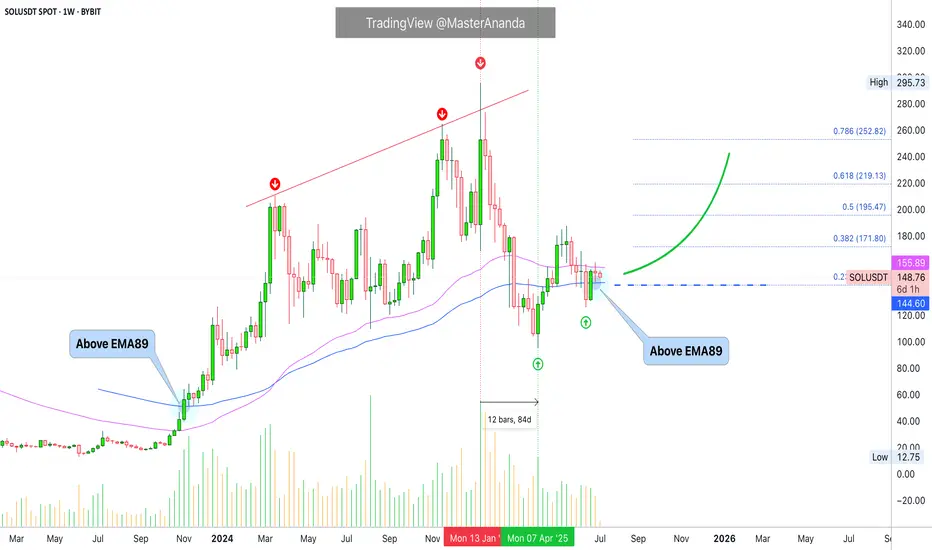
Solana Moving Averages: Patience is KeySolana is trading above EMA89 while at the same time trading below EMA55, we have a mixed situation. When in doubt, stay out. Anything is possible on this chart.
There was a major correction already that lasted 84 days. Solana lost more than 65% in this correction. A -67% drop. This correction removed all gains from 2024 sending prices back below $100. This is to say that Solana already went through a full and major flush.
The market could very easily continue lower and produce a lower low compared to 7-April, a major crash leading to August and I can easily see this scenario developing. Will it develop? Is it really necessary?
I can also see a slow but sure change of course. A few days red at the start of the week, as it is usual and then Boom!, the market turns green. And it grows day after day after day. It is already happening, patience is key. Better focus on the numbers.
» If Solana trades weekly above $142, we are bullish, strongly bullish and can expect additional growth.
» If Solana moves and closes weekly below $142, market conditions still remain bullish but we can approach this pair with caution.
» On a broader perspective, any trading above $95, the 7-April low, is bullish long-term. As long as this level holds, we can expect higher prices. The last low sits at $126...
It doesn't matter how you slice it, the price is good and is more likely than not to continue to increase. Patience is key.
Namaste.
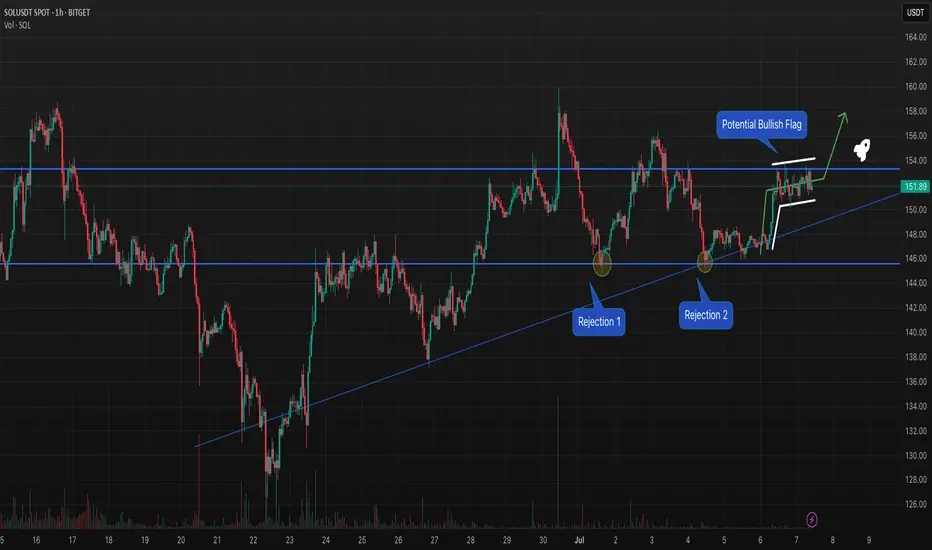
SOLUSDT Testing Resistance With Bullish Flag — Breakout in SightSOL is pressing against horizontal resistance after bouncing cleanly off trendline support twice (Rejection 1 & 2). Price action is now coiling inside a potential bullish flag — a breakout above $153 could send SOL toward $158 and beyond 🚀
📍 Bullish Scenario: Break above the flag → momentum toward $158
📍 Bearish Scenario: Break below trendline support → revisit $146
This post is for educational purposes only — not financial advice.
#SOL #Crypto #TechnicalAnalysis #BullishFlag #BreakoutSetup #TradingView #QuantTradingPro
5 RRPossible Elliott wave triangle suggests a new local high in the near future giving a trade opportunity at the untested range. Target may be adjusted--that provided is conservative.

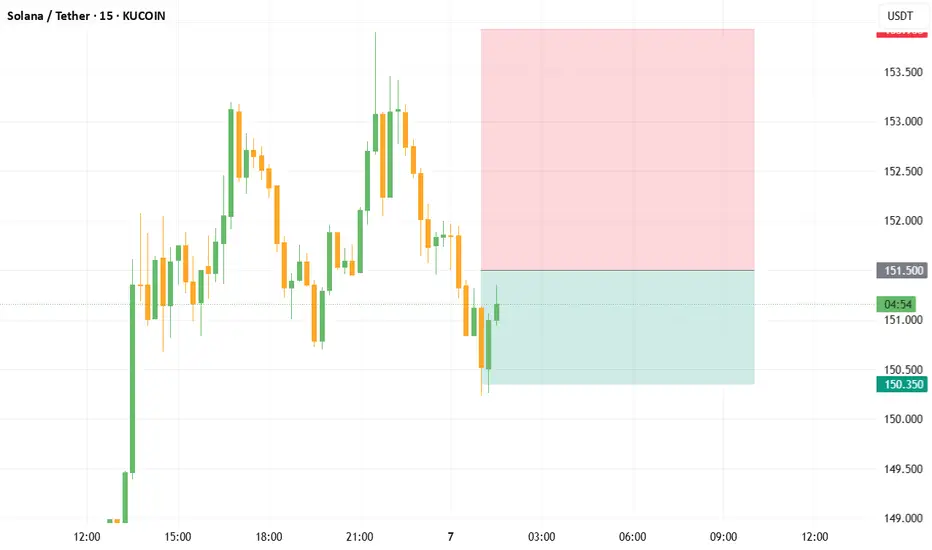
[SOLUSDT scalping short signal]- Signal: SHORT
- Entry: 151.300 ~ 151.500
- Take Profit: 150.820, 150.350
Chasing highs and lows is prohibited, so miss it;
Prohibit stop-loss operation, only to do "controlled static and dynamic resonance zone" within the transaction.
Solana's fate: pump or dump ?Hello friends
You see that Solana, after its good growth, got stuck in a range and is gathering strength. Now, considering the strong upward trend of this currency, it can be said that this force can push the price upwards, but everything is possible in the market, so observe capital management and trade with your will and wisdom.
*Trade safely with us*
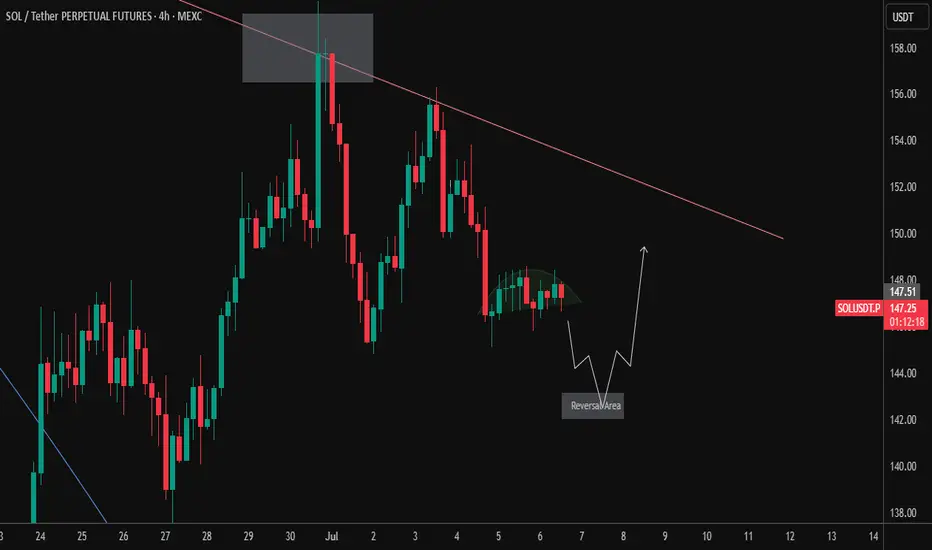
SOLUSDT.P – Watch for Reversal from Key Demand Area (4H Outlook)SOL on the 4-hour timeframe is forming a potentially bullish setup, but patience is key as price nears a critical reversal zone.
🧠 Market Context:
After a strong move up in late June, SOL faced heavy rejection near $155–$157, which aligns with both a supply zone and a long-term descending trendline (visible across higher timeframes).
Since then, we’re seeing a series of lower highs, signaling ongoing seller control in the short term.
🔄 Short-Term Price Action:
The recent candles form a rounded consolidation, with volatility compressing.
Price is expected to retest the $143–$144 area, highlighted as the "Reversal Area" on the chart.
This area previously acted as a pivot and may serve again as a demand zone.
🛠️ Trade Plan:
Wait for a reaction at $143–$144: either a bullish engulfing, hammer, or strong volume candle to confirm buyer presence.
If reversal occurs, potential move is toward $150–$152, where price meets the long-term descending trendline again.
This setup aligns with a classic "higher low" formation before continuation.
❌ Invalidation:
Clean break below $142 with strong volume would invalidate the short-term bullish thesis and may open up downside to $138.
✅ Summary:
Bias: Bullish on confirmation
Reversal Zone: $143–$144
Target: $150–$152
Invalidation: Below $142
This setup provides a low-risk, high-reward opportunity — but only with a confirmed reversal. Let the market show its hand.
SOLUSDT.P – Waiting for Bullish Confirmation at Key ZoneThe daily chart of SOLUSDT Perpetual Futures (MEXC) is currently showing signs of a potential reversal setup, but confirmation is key before taking a long position.
🔍 Chart Overview:
Price action is in a clear downtrend, with lower highs forming consistently, capped by a descending trendline.
We’ve recently seen a pullback after a failed breakout near the $152–$154 region.
📌 Key Zone to Watch:
A demand zone around $137–$140 is marked, which previously acted as a springboard for bullish movement.
There's a confluence of this demand zone with the wedge breakout retest area.
📈 Trade Setup & Plan:
The chart notes: "Need Bullish Engulfing here to go long".
This implies a waiting strategy: look for a strong bullish engulfing candle at the $137–$140 zone before entering a long position.
If confirmed, price could rally back toward the descending trendline near $150–$154, which aligns with the prior resistance level.
⚠️ Invalidation:
A daily close below $135 would invalidate the bullish setup and likely trigger continuation toward $128–$130 support area.
📊 Summary:
Bias: Cautiously Bullish (Waiting for confirmation)
Entry Trigger: Bullish engulfing candle at $137–$140
Target: $152–$154
Invalidation Level: Below $135
Patience is key here. Let the price come to you and confirm intent before jumping in.

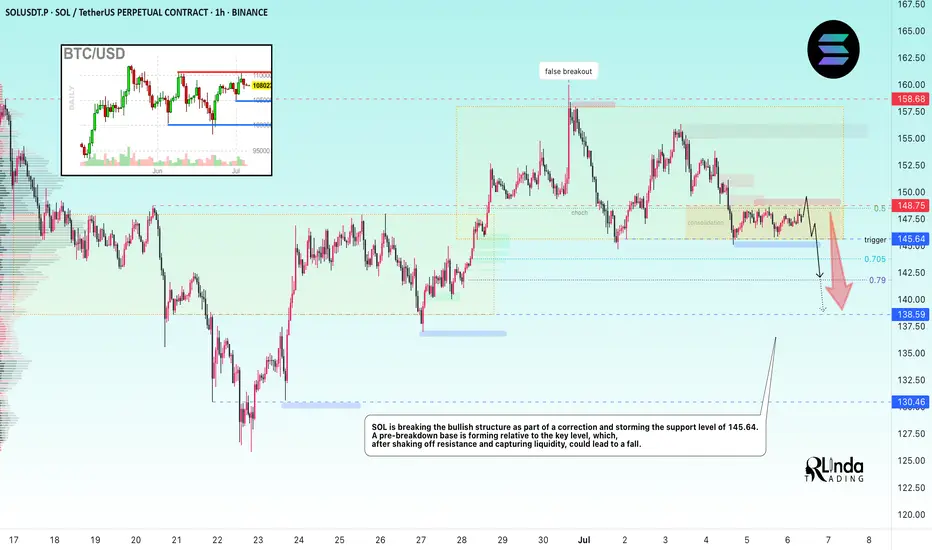
SOLANA → Pre-breakdown consolidation may lead to distributionBINANCE:SOLUSDT is declining and testing the support of the trading range as Bitcoin pauses after strong growth and enters a correction phase...
SOL looks a bit weaker than Bitcoin technically, but SOLANA has some positive fundamentals, though that might not be enough.
After forming a false breakout of key daily resistance, Bitcoin is moving into a correction phase. An update of local lows on the chart could trigger a drop across the entire cryptocurrency market.
In SOL, the focus is on the two nearest levels of 148.75 and 145.64. A breakdown of support could trigger the distribution of accumulated energy within the specified range as part of a downward momentum.
Resistance levels: 148.75, 151.2, 153.88
Support levels: 145.64, 138.59
The ideal scenario would be a false breakout of 148.75 (liquidity capture) and a retest of 145.64, followed by a break of support. Consolidation below 145.65 could trigger a drop to the zone of interest at 138.59.
Best regards, R. Linda!
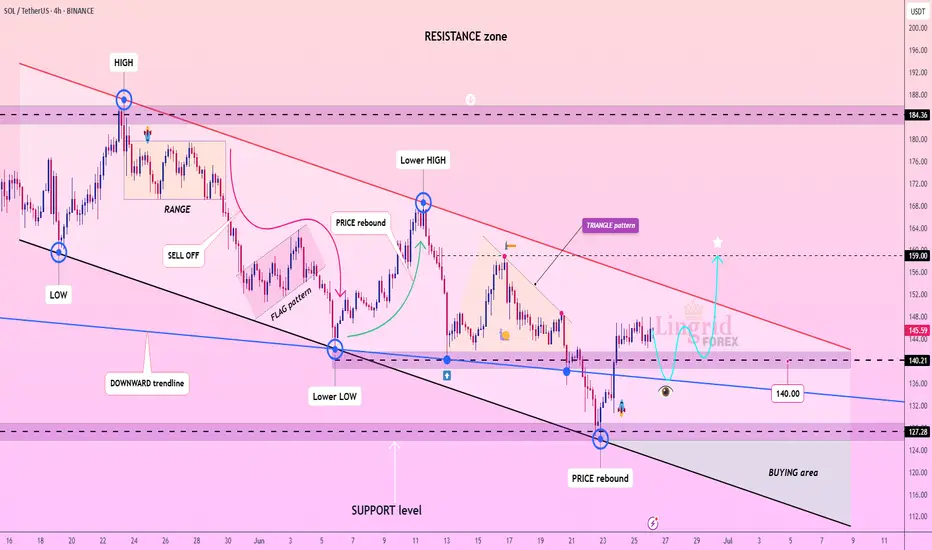
Lingrid | SOLUSDT possible Channel BreakoutBINANCE:SOLUSDT is showing early signs of recovery after rebounding from the 127 support zone and reclaiming structure near the 140 level. Price is now consolidating below the red descending trendline, which acts as dynamic resistance. A breakout above 145 could confirm bullish reversal and target the 159 resistance zone as indicated by the star projection. The key lies in whether buyers can sustain pressure above the 140 zone.
📈 Key Levels
Buy zone: 138–142
Sell trigger: break below 127
Target: 159
Buy trigger: breakout and close above 145 trendline
💡 Risks
Failure to hold above 140 may lead to fresh lows
Downtrend may resume if price gets rejected at 145
Low volume breakout may signal a bull trap
If this idea resonates with you or you have your own opinion, traders, hit the comments. I’m excited to read your thoughts!
#SOL Update #2 – July 5, 2025🔴 #SOL Update #2 – July 5, 2025
Yesterday, I mentioned that Solana was at a critical level and not suitable for long or short entries. I also noted that I’d stay in watch mode and that hasn’t changed.
Right now, SOL is trying to hold above the support box, but volume remains quite low. Even worse, footprint data is showing negative pressure. If SOL loses the $144.5 level, I expect a move toward the $137–136 zone, as mentioned in my previous update.
Let’s also not forget that the $150 area is a strong resistance. At this stage, I don’t see any high-probability setup on either side. I’m still watching. No trade for now.

SOL USDT CAN BE BULLISH IN A WEEK Just my opinion not make tradeAt the time Sol USDT will trade in 147.50
My analysis this is spot level
I am not recommending to buy but I think this is the best move for sol

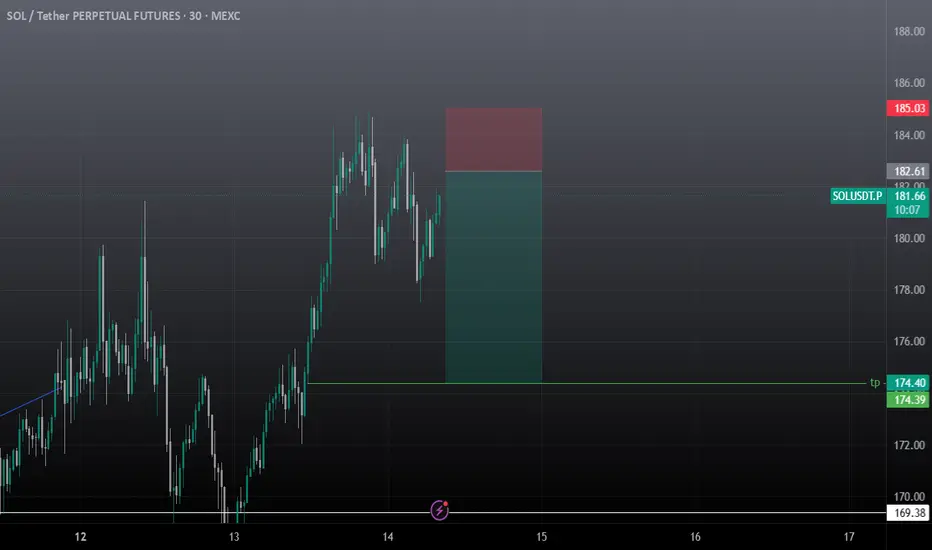
SOL SCALP SetupSOl can retrace to 175$ on ltf, must use sl before taking any trade. Market is too volatile now
SOL REJECTED AT RESISTANCE SOL with evening star candlestick pattern on 1D, two zones are my areas to watch for next coming days
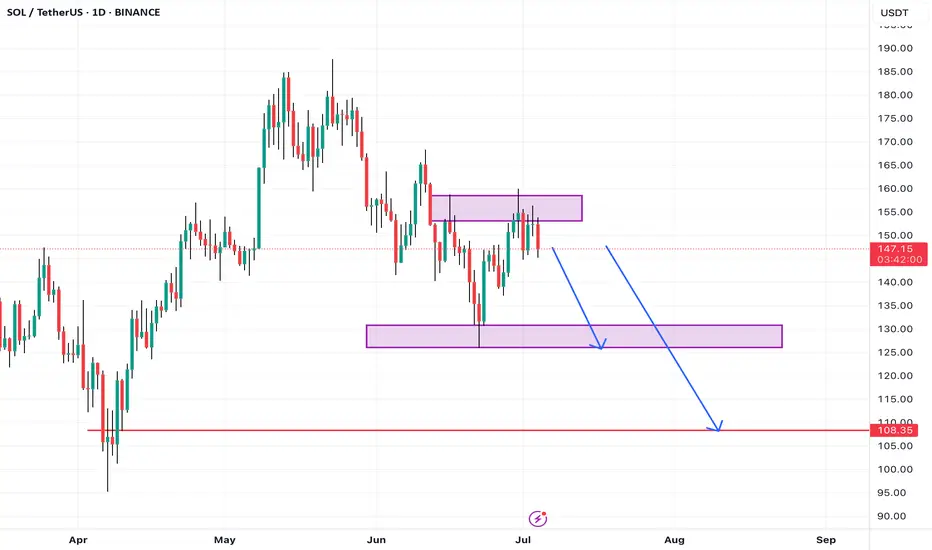
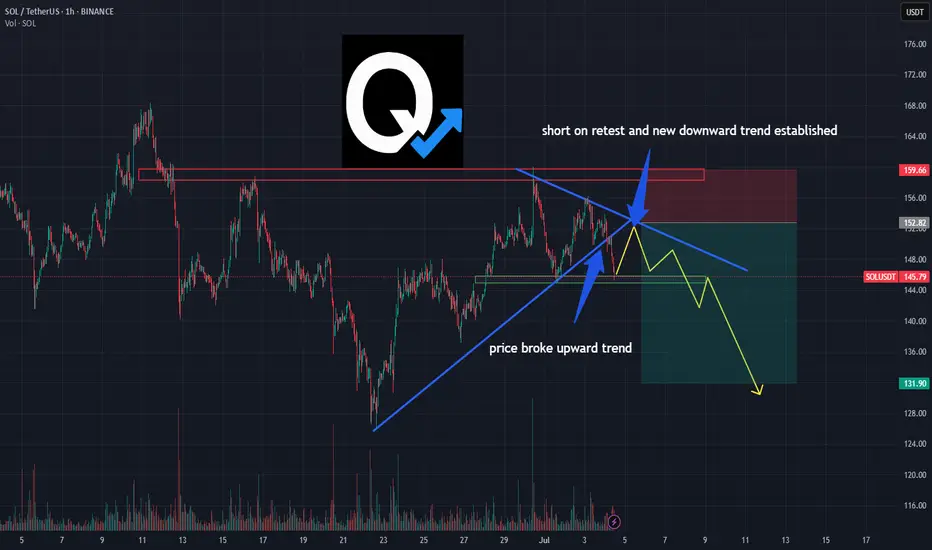
SOL/USDT Breakdown: Bearish Retest Sets Up ShortPrice action on SOL just confirmed a key structural shift 📉
The ascending trendline has been broken, and we’re now seeing a textbook bearish retest below prior support — which is flipping to resistance.
This setup suggests momentum is turning.
A lower high beneath the new downtrend line points to possible continuation toward the 132 zone.
• Trendline broken
• Retest in progress
• Short thesis active unless price reclaims 159+
This is not financial advice — just a breakdown of a technical idea based on structure and market behavior.
#SOL #CryptoTrading #TrendBreak #BearishSetup #TechnicalAnalysis #TradingView #QuantTradingPro
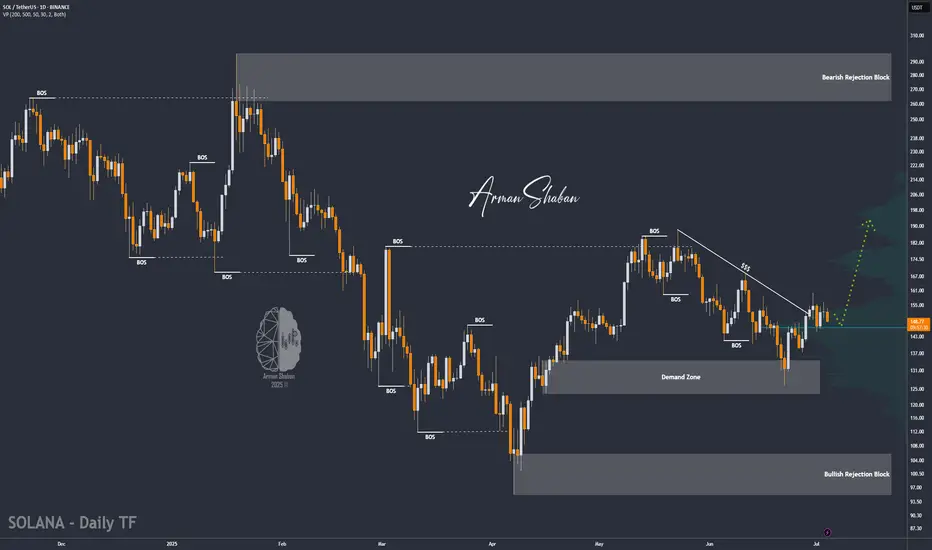
SOL/USDT : Strong Bullish Move Ahead?By analyzing the #Solana chart on the daily timeframe, we can see that the price is currently trading around $149.62. If the price holds above the key level of $146.28, we could expect the beginning of a strong bullish wave, potentially delivering over 25% short-term returns.
If this scenario plays out, the next bullish targets are $168.50, $187, $220, and $263.
(Personal research is strongly recommended for long-term investment decisions.)
Please support me with your likes and comments to motivate me to share more analysis with you and share your opinion about the possible trend of this chart with me !
Best Regards , Arman Shaban
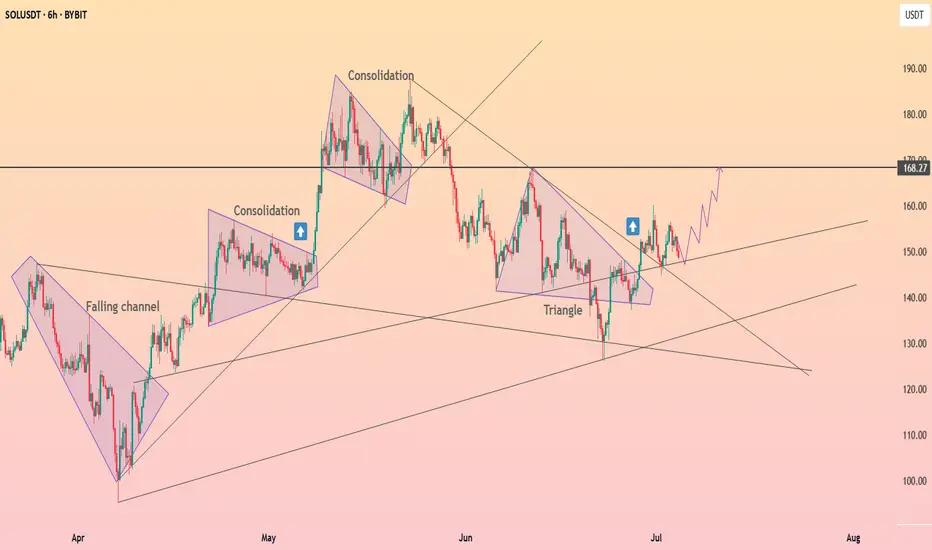
HolderStat┆SOLUSD got out of the triangleBYBIT:SOLUSDT is trading in a well-structured upward channel with a history of consolidation zones acting as breakout springboards. The price recently bounced off trend support and now targets the resistance at 170. Structure remains bullish as higher lows continue to form.
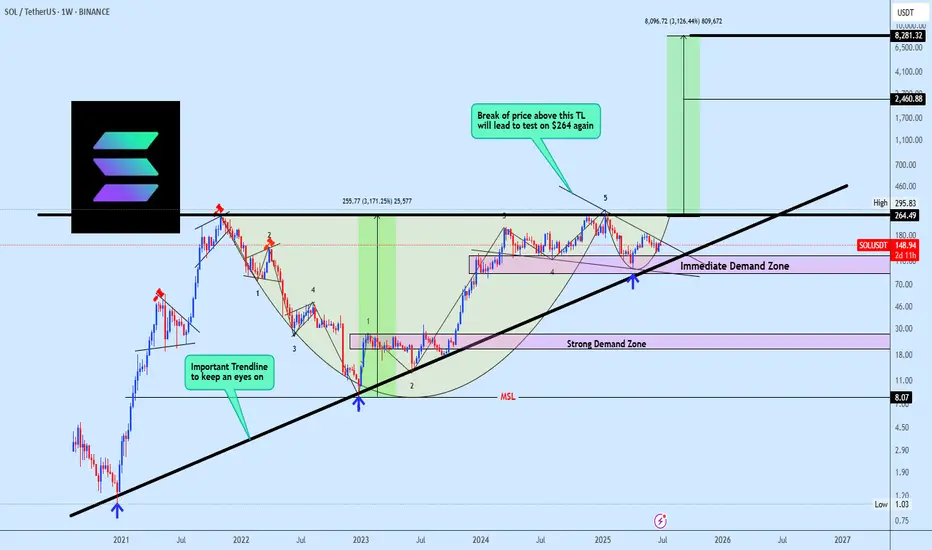
SOLUSDT Holding Long Term Trendline SupportSOLUSDT continues to show strong bullish structure, with price consistently holding above a multi-year ascending trendline a key structural element that has defined its uptrend. This dynamic support has anchored price action within a broader ascending formation, reflecting steady long-term accumulation.
Additionally, the chart reveals a well defined Cup and Handle formation, further reinforcing the bullish outlook. As long as price respects the immediate demand zone, this area remains a prime region for re-accumulation, with expectations for it to hold as a firm support level.
The projected target for this setup is clearly illustrated on the chart, aligning with the broader bullish continuation narrative.
Share your view, do you see SOLUSDT pushing higher from here, or is a deeper retest likely before the breakout?
Exactly as I expected Lower low Love to see it as I plane 💯😬
The chart followed my plan so perfectly, I’m starting to worry it’s stalking me...
Like, chill Solana, I was just kidding when I said “do exactly this!” 😂📉📏