$420 Solana Within 2 Months —TargetsSolana is on a path to a hit a price target of $420 mid-term, within 1-3 months. This is the continuation of the uptrend that started in early April with the end of the previous correction and a more than a year long strong low.
This is not for the faint of heart. Solana is preparing for something massive, even scary but positive. $600+ is also possible but we are going step by step and $420 is the first step.
Immediately when prices start to rise Solana is likely to find resistance around $220 and $253.
The last high, January 2025, would be the minimum on this bullish wave. This would be price tag of $296.
The end of the retrace happened 22-June. This means that the market is already bullish for an entire week. Bitcoin is about to produce the best possible weekly close. As Bitcoin is ultra-bullish above $106,000/$107,000, the altcoins can continue to recover and will aim higher trying to catch up. Of course, no altcoin can catch up to Bitcoin but invariably the entire market will grow.
The wait is over, we are bullish now. Timing is great.
Bullish momentum will grow for weeks and then a major force will permeate the market, something not seen in many years. I hope you are prepared.
Namaste.
SOLUSDT trade ideas

SOLANA ABOUT TO EXPLODE?CRYPTOCAP:SOL just broke out and is surging within a long-term bullish channel
Price action is clean, momentum is strong, and if this channel holds — we might be eyeing $700+ in the next run.
This is not the time to ignore Solana.
Chart says it all.
DYOR. Stay sharp.

sol usdt pattern identified inverse head and shoulders with chan🧠 Technical Analysis (SOL/USDT – 4H Timeframe)
🔍 Pattern Identified: Inverse Head & Shoulders
Left Shoulder: Around $137
Head: Dipped to ~$126
Right Shoulder: Formed around $135
Neckline Breakout: Successfully broken near $148–$150 zone
This classic bullish reversal pattern indicates a potential trend shift from bearish to bullish.
📈 Trend & Channel
The price was previously trading inside a descending parallel channel (marked in yellow).
The breakout from the upper channel boundary confirms strength and momentum shift.
🚀 Price Targets (Resistance Levels Ahead):
$158.36 – First resistance level (short-term target)
$168.52 – Mid-level resistance (medium-term)
$187.56 – Key resistance (long-term target area)
✅ Bullish Confirmation:
Breakout with volume from both descending channel and head & shoulders neckline
Price holding above neckline now acting as support
⚠️ Risk Note:
A retest of the breakout zone ($148–$150) can occur before moving higher
Invalid if SOL drops back below neckline and fails to hold above $145 support zone

SolusdtIn daily chart S_WAVE DONE NOW CAN move TO N_WAVE and in the weekly price so far from kumo so price can Checking kumo in weekly chart

Solana (SOL): Gameplan Remains The Same | Aiming at $100 Solana's game gameplan has not changed for us, where we are still looking for that downward movement to form a proper support zone near the psychological area at $100.
More in-depth info is in the video—enjoy!
Swallow Academy

SOL Long Idea Going Pretty WellTime Frame - D
Confluences
Turtle Soup
EOB
Breaker Block Confirmation
Retest of EOB
I am targetting atleast 158. Ideal entry was around 142.
#NFA, #DYOR

SOLUSDTSOL has been trending below the trend line for more than 162 days. It is reaching local low and my plan is to trade the breakout. If 127$ local low gets taken then we might see 110$. Lets see how it plays out.
Note: It is not a financial advise. Please DYOR

SOL/USDT 15-minute high win scalping signals are as follows:- Signal: LONG
- Entry: 147.800 ~ 148.400
- Take Profit: 149.800, 151.300

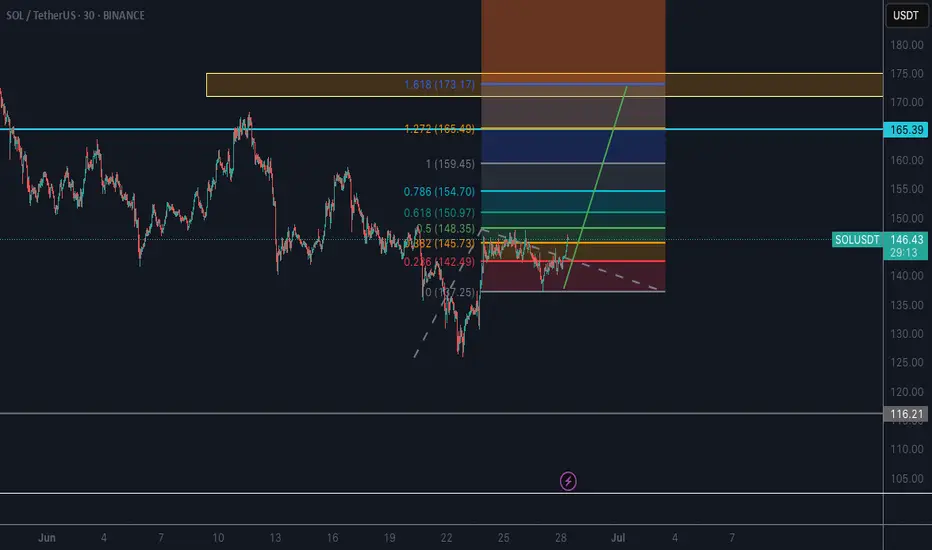
SOL Fractal long-term set up: 100% upside📈 SOL/USDT Long-Term Setup: Potential for 100%+ Upside or 16% Downside
This chart presents a Fibonacci-based technical outlook on Solana (SOL/USDT) on the daily timeframe.
🔍 Key Highlights:
Current price: $150.65
Major resistance zones: $177.12, $183.22, and $199.05
Fibonacci retracement levels (from $294.75 high):
0.618 at $171.32
0.5 at $200.08
0.382 at $222.42
Strong support at $137.97, $131.16, and $122.56
Downside risk to $126.99 (0.886 Fib) or even $105.40 (1 Fib)
Bullish target: $301.64 (+105.25%)
Bearish scenario: $126.99 or lower (-16.53%)
📊 The chart includes harmonic structures and descending/ascending channels suggesting consolidation, but the current structure could pivot into a bullish continuation if key resistances are broken.
🎯 Risk-to-Reward Ratio Favorable for Bulls: The setup offers a potential 105% upside against a 16% downside, making it attractive for medium- to long-term traders.
⚠️ As always, manage your risk appropriately and consider macroeconomic factors.

solana crazy ideaWell, I made this silly little chart for myself. I kind of expect it to follow the pattern of some bots running on Solana, at least within the range I’ve marked. But hey, it’s a bull market, and sometimes even random drawings by amateurs like me end up working out!
That said, I'm keeping my target modest — not expecting anything crazy. Stop loss depends on how Bitcoin behaves, and honestly, I wouldn’t recommend anyone follow what I’m doing. This is not investment advice, just a ridiculous idea I had.

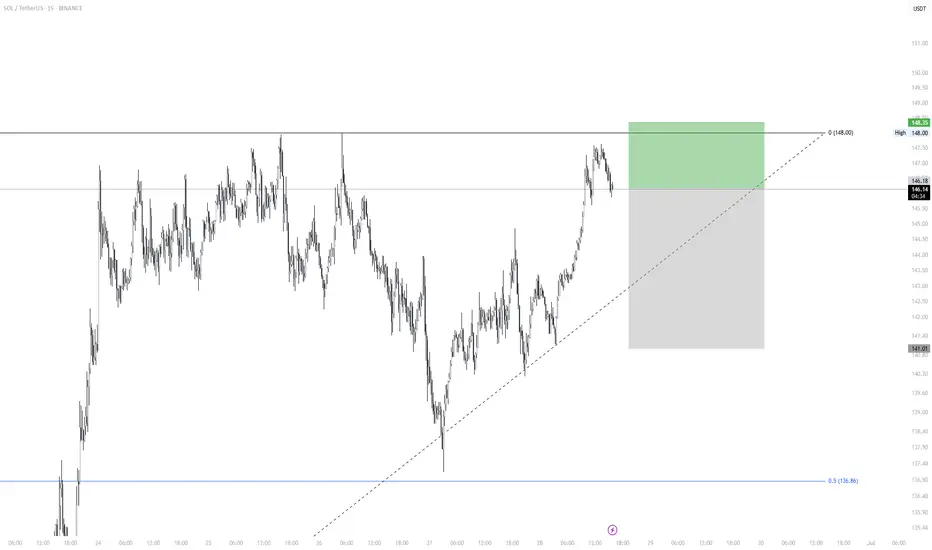
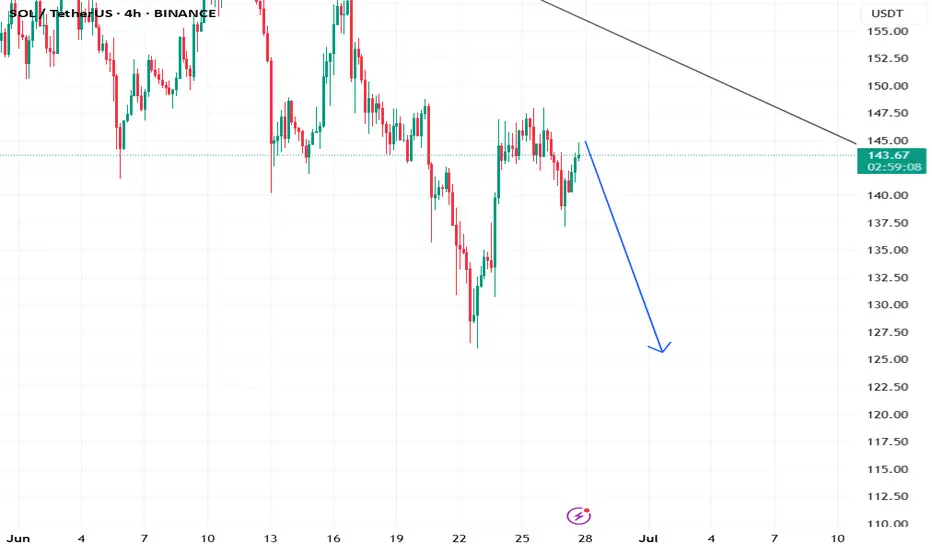
SOL/USDT Short Setup – Targeting Range LowContext:
Price just rejected off local range high near $148 — a key resistance that has held several times historically. We’re seeing initial signs of weakness after a strong rally, with price failing to hold above resistance and beginning to break minor structure.
Setup Details:
Entry: ~$146.20
Stop Loss: ~$148.35 (above recent high)
Target: ~$141.00 (range low + demand pocket)
Risk/Reward: ~2.38R
Trade Idea:
This is a classic range play — short from top of the range, targeting the base. Momentum is fading near resistance and we have a clean invalidation just above. Price structure suggests lower highs are forming, and any further weakness should push us back into the mid-to-lower part of the range.
NothingThe SOL will increase $150 and reach to the top of the wedge in the coming weeks .
Best regards CobraVanguard.💚

Buy limit 146.60 TiqGPT buy signalAnalyzing the SOL/USDT across multiple timeframes, we observe a consistent upward momentum, particularly evident in the shorter timeframes (1H, 15M, 5M, and 1M). The 1D and 4H charts show a recent recovery from a downward trend, indicating a potential shift in market sentiment or a retracement phase.
1D Chart: The daily chart shows a series of bearish and bullish candles with recent bullish activity suggesting a potential reversal or pullback from previous lows.
4H Chart: This timeframe shows more granularity in the recovery, highlighting a resistance-turned-support level around $142, which has been retested and held as support.
1H Chart: A strong bullish impulse is visible, breaking past previous minor highs, suggesting an increase in buying pressure.
15M Chart: This chart shows a continuation of the bullish momentum with higher highs and higher lows, a classic sign of an uptrend.
5M and 1M Charts: Both these timeframes show detailed price action within the bullish trend, with the 5M chart beginning to form a pullback.

SOL LONGSolana price flipped bullish as bears fail to push price below $140
Next target areas for resistance are $160 and $170
SOL - You take its SOUL!SOLLLLL is going to get a hump of liquidity touch it and fall down, what can be more better than knowing what you doing hahahahha


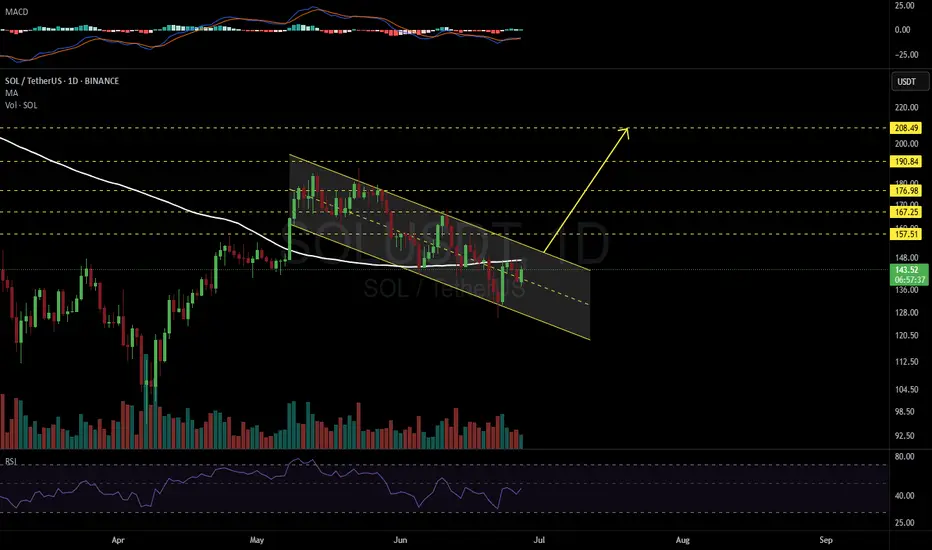
SOLUSDT 1D📈 #SOL – Bullish Flag Setup on Daily
Solana has formed a bullish flag on the daily chart — a continuation pattern that often leads to strong breakouts.
Currently, the price is trading above the midline of the flag and testing the daily MA100 as dynamic resistance.
🚀 If #SOL breaks above the MA100 and the upper boundary of the flag, the next targets are:
🎯 $157.51
🎯 $167.25
🎯 $176.98
🎯 $190.84
🎯 $208.49
📌 Watch for:
Breakout confirmation with strong volume
Retest of breakout zone for safer entries
⚠️ Risk Reminder:
Always use a tight stop-loss and apply solid risk management to protect your capital.
SOL can retest the bottom again, trade carefullySOL retest the bottom is likely before starting the run, lets see
SOL is missing only one thing for the price to explode⚡️ Hello everyone! I decided to update my idea a little and take a closer look at the 4-hour timeframe on SOL.
After closing the gap from below, the price is now trying to consolidate at key levels of 141-150. If it fails, the nearest strong support is at 133.
📈 At the same time, the price has entered the buying range. This is a signal for position traders to accumulate positions.
⚙️ Metrics and indicators:
Money Flow - divergence with price. While the price fell from 300 to 140, liquidity remained virtually unchanged and is in a neutral zone.
Liquidity Depth - there is increasing liquidity at the top. On the daily timeframe, there is already an almost 5-6 times overweight in shorts. On the 4-hour timeframe, it is currently almost x2. And as we know, the price moves from one liquidity zone to another.
📌 Conclusion:
SOL continues to see liquidity inflows and huge demand. However, there is still one catalyst missing for a powerful price breakout: an ETF on SOL.
Institutional inflows into SOL are precisely the factor that could be the key piece of the puzzle for the next leg of the trend.
Have a great weekend, everyone!

HolderStat┆SOLUSD breakoutBINANCE:SOLUSDT on the 6h chart has shifted from a falling to a growing channel structure. Support around $135 held, and now the price is eyeing $160–$170. Previous breakouts from similar structures have triggered steep gains.

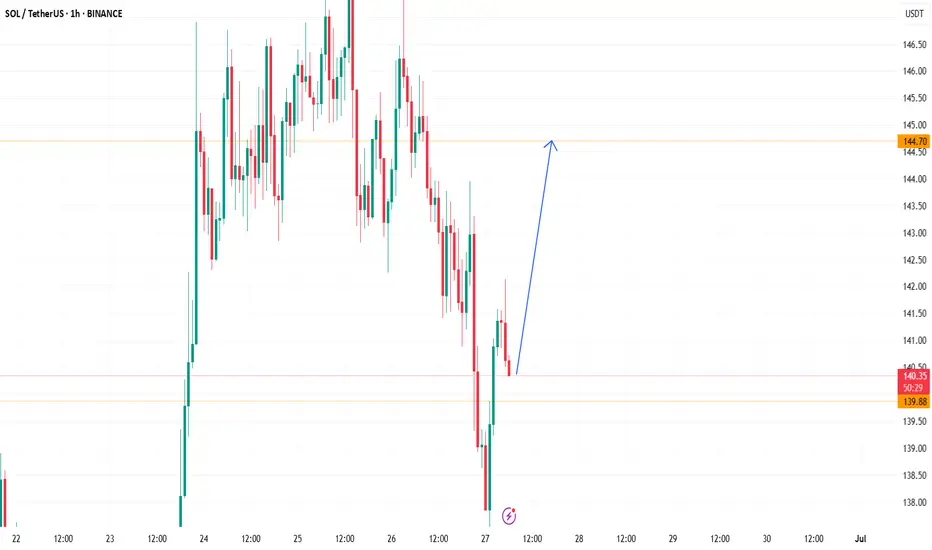
SOL NEXT MOVES 🧠 Scenarios:
1️⃣ Break above $149.50 → Possible push to $154–161
2️⃣ Rejection from red zone → Drop toward $132
3️⃣ Dip to $126–132 → Bullish recovery expected
📊 Plan your entries with structure & confirmation. No chasing.

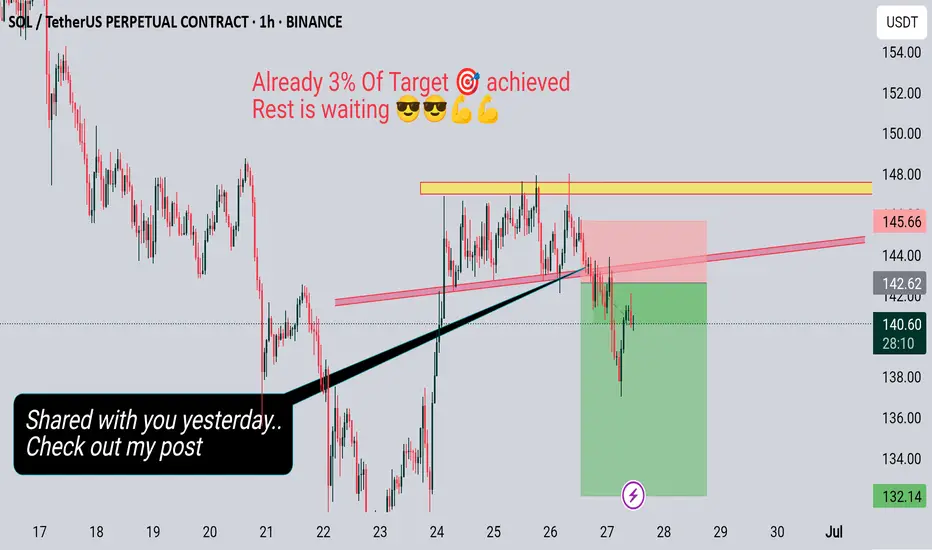
Solana 3 % Target Achieved Waiting for rest..Hello trader's
Here's the Solana update
How many off you traded after breakdown
🎯 Comment