SOLUSDT - UniverseMetta - Analysis#SOLUSDT - UniverseMetta - Analysis
The price on W1 formed a double 3-wave structure. It is also worth considering the previous development for 2-3 months to reach all levels and update ATH. Against the background of the growth of all other assets, and the possibility of the beginning of the altseason, this pattern can be considered for a set of positions in the portfolio. The nearest targets will be at the level of 206 - 245. When the entire structure is realized, we can see a price of 338 per asset. Observe the risks.
Target: 206 - 338
SOLUSDT trade ideas

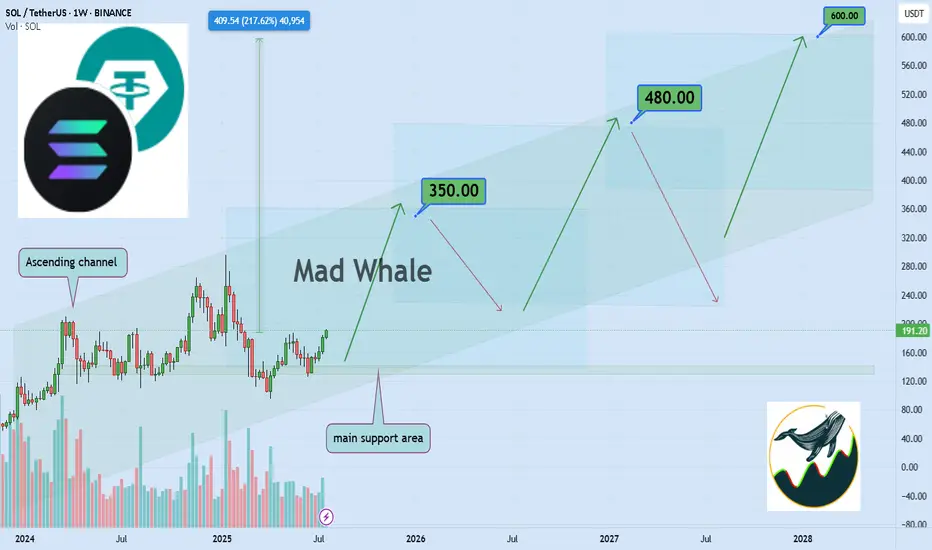
Bullish SOL Setup: $350, $480, $600 Main Price TargetsHello✌
Let’s analyze Solana’s upcoming price potential 📈.
BINANCE:SOLUSDT , I expect a long-term upward bullish trend.
There are three main targets in this analysis: $350, $480, and a final target of $600, which could be reached within 2 to 6 years.
The price may form parallel channels at times, which are shown on the chart. I also expect the current bullish channel to remain valid and continue upward.
✨We put love into every post!
Your support inspires us 💛 Drop a comment we’d love to hear from you! Thanks , Mad Whale🐋
🐋Many of the points and levels shown on the chart are based on personal experience, feeling, and over 7 years of research and daily study of crypto charts.
Some of the lines, channels, and price zones are drawn to make the chart easier to understand and to help imagine possible future price movements.
I’ve also included one very big drop in price even bigger than the others because in the crypto market, it’s common for prices to suddenly fall hard and push out small investors and traders with positions.
The targets on the chart are not guaranteed; they might be reached, or they might not.📚
📜Please make sure to do your own research before investing, and review the disclaimer provided at the end of each post.
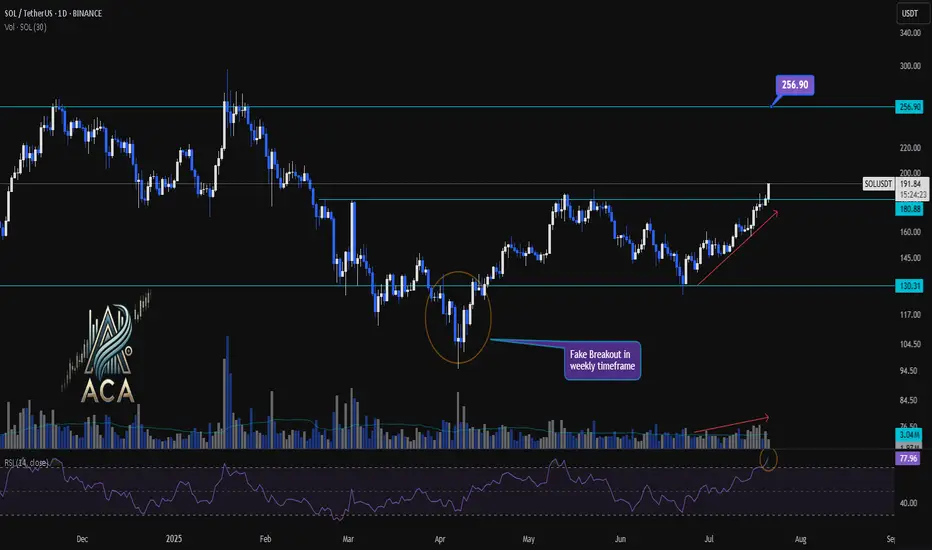
SOLUSDT 1D Chart Analysis | Accumulation Breakout Signals....SOLUSDT 1D Chart Analysis | Accumulation Breakout Signals Fresh Momentum
🔍 Let’s drill into the SOL/USDT daily chart, focusing on the recent breakout above the accumulation range, key support and resistance levels, RSI momentum, and volume confirmation for a robust bullish scenario.
⏳ Daily Overview
SOLUSDT has decisively broken out above a prolonged accumulation box, marking a significant shift in market structure. A daily close beyond this range now serves as a strong indicator for renewed bullish momentum. RSI is currently above 77, signaling that buyers are commanding momentum. Notably, volume has surged in tandem with price, confirming trader participation behind this breakout move.
📈 Technical Convergence and Trend Structure
- Accumulation Zone Break: After consolidating within a clear box for weeks, SOLUSDT closed above the upper boundary (around $180.88–$191.05), signaling a possible trend reversal or continuation.
- Daily Close Signal: A daily close outside the accumulation box offers high conviction for bullish continuation. This close acts as a potential entry signal for trend-followers.
- RSI Momentum: The RSI sits above 77—deep in the overbought territory. A close here not only confirms buyer strength but often precedes sustained uptrends when accompanied by price breakouts.
- Volume Surge: Volume has increased with the breakout, providing confirmation the move isn’t a false start, but likely fueled by real demand.
- Weekly Fake Breakout: There was a notable false breakout in the weekly timeframe, quickly reclaimed by bulls. This flip suggests buyers fended off downside attempts and now drive higher prices.
🔺 Bullish Setup & Targets
- First Target: $256.90 — marking the next major resistance on the chart and a logical upside objective for traders.
- Key Trigger: A confirmed daily (or weekly) close above the accumulation range with strong volume is essential for validating the upward trajectory.
📊 Key Highlights
- The breakdown of the accumulation box—now turned support—marks a pivotal structural change.
- RSI and price are making new local highs, solidifying the case for continued bullish momentum.
- Volume is climbing in sync with the move, offering real confirmation versus a potential fakeout.
- Recent fake breakout on the weekly chart, immediately negated, emphasizes that buyers are regaining—and likely maintaining—control.
🚨 Conclusion
SOLUSDT appears set for higher prices following the confirmed breakout above the accumulation range. Signs of trend health include an overbought RSI, volume confirmation, and the swift invalidation of a recent weekly fake breakout. As long as daily closes stay above the breakout level, the path remains clear for a rally toward $256.90. A strong daily close and continued volume will be your best signals for bullish continuation.
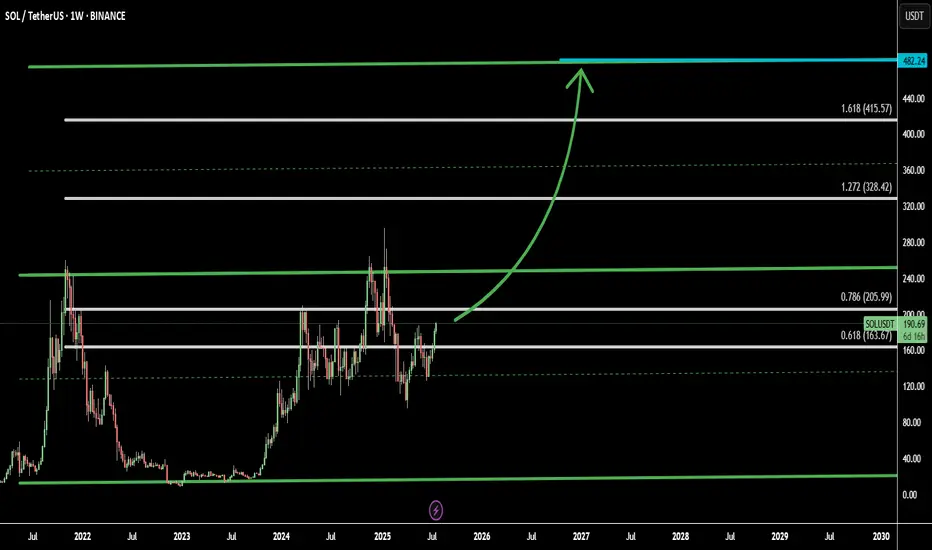
SOL Aiming to Double: Channel & Fibonacci Targets Signal $380Solana (SOLUSD) is currently trading around $190, and technical analysis suggests it may be on the path to doubling in price toward $380. This projection is supported by both a bullish ascending channel and Fibonacci extension levels, providing confluence for an extended rally.
Using this combined strategy, I’ve identified 4 key targets:
Target 1: 0.786 Fib – 205.99 - mid-range target within the upper half of the channel
Target 2: 1.272 Fib – 328.42 - aligns with historical breakout levels
Target 3: 1.618 Fib – 415.57 - Last Fibonacci Targets
Target 4: projected top of the current channel near 482.24
Beyond the technicals, Solana’s ecosystem continues to outperform many other Layer 1 chains, offering faster transaction speeds, lower fees, and robust DeFi and NFT activity. This fundamental strength supports the technical bullish thesis.
As always, breakout confirmation and volume are key. Manage risk accordingly.
Solana at $189 Now… $295 Might Just Be Days AwaySolana (SOL) on the 3-day chart is showing strong bullish structure after bottoming out near the $95–$110 demand zone. The price has formed a series of higher lows following a prolonged downtrend from the $295 top earlier this year. After reclaiming support levels and confirming demand zones twice (marked with blue "B" signals), SOL is now heading toward key resistance with bullish momentum.
The price also broke above the short-term lower high structure and is consolidating above $189, hinting that bulls are preparing for a leg higher. The red "S" markers at ~$210 indicate past sell zones — and reclaiming this level will likely open the path for a much larger bullish continuation. This move is technically supported by multiple rejections of the $140–150 zone in the past, which now acts as a solid base.
With momentum shifting in favor of buyers and a clean structure in place, here's the bullish trade setup:
________________________________________
📊 Trading Setup (Bullish)
• 📥 Entry: Around $189.45 (current breakout zone)
• 🛡️ Stop-Loss: $140.05 (below last bullish pivot)
• 🎯 Take-Profit (Target): $295.83 (major historical resistance)
• ⚖️ Risk-to-Reward: ~2.16 (healthy R:R with 56% upside potential)
________________________________________
The target of $295.83 is justified not only by price history but also by the structure of the current recovery phase — a move from $95 to $210 followed by a minor retracement, forming a potential rounded reversal pattern. If price breaks above $210 cleanly, momentum traders are likely to enter aggressively, pushing toward $250–295 range.
The stop-loss at $140 is strategically placed just below the last accumulation zone, and protecting against deep pullbacks that would invalidate the bullish sequence.
📈 As long as SOL holds above $180 and continues forming higher lows, the chart remains bullish with $295 as a technically valid target over the next several weeks.

SOLUSDT SELLConsidering the divergence and price patterns and price support, expect a drop to the price of the opinion model.

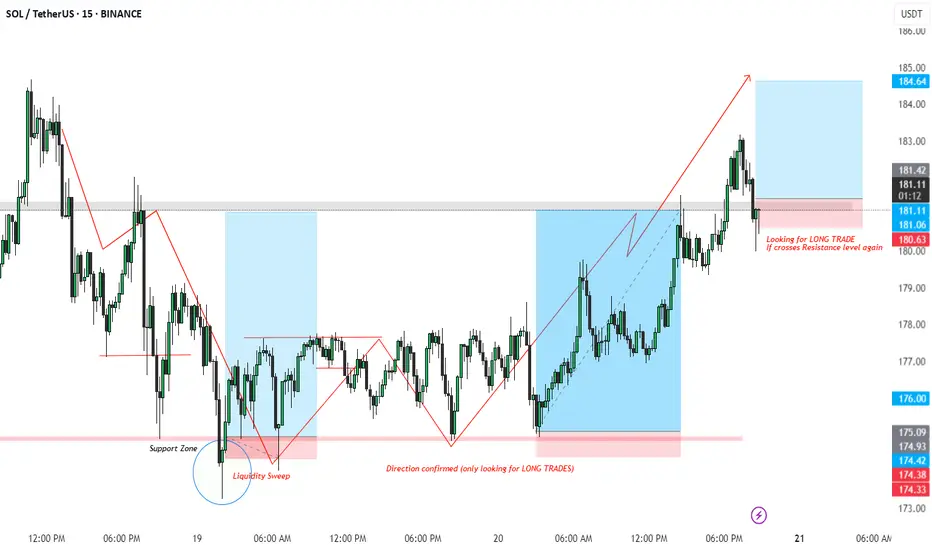
SOL/USDT LONG Setup – Liquidity Sweep + Break of Structure
Timeframe: 15m
Market Bias: Bullish (Long only)
Setup Type: Liquidity Sweep + BOS + Retest
📌 Breakdown:
Liquidity Sweep Identified:
Price dipped below the previous support zone, triggering stop hunts and grabbing liquidity.
Marked as a clear sweep of lows, signaling possible reversal.
Shift in Structure:
Following the sweep, price printed a Higher High and Higher Low, confirming change in structure.
At this point, we shift bias to Long Only trades.
Retest & Entry Zone:
After bullish momentum, price has pulled back to a key resistance-turned-support zone (highlighted in pink).
Looking for long entry on confirmation if price reclaims the resistance again (~181 zone).
📈 Trade Plan:
Entry: On reclaim and candle close above 181.00
SL: Below the recent structure low (~180.00 or dynamic based on confirmation)
TP: Previous high at 184.60 zone (approx 1:3 RR)
🧠 Trading Psychology:
Patience is key — wait for structure confirmation and avoid pre-emptive entries. The liquidity sweep setup gives us a solid probability edge when combined with market structure shift.
#SOLUSDT #CryptoTrading #SmartMoneyConcepts #LiquiditySweep #TradingSetup #BOS #MarketStructure #ReversalPattern #CryptoAnalysis #LongTradeOpportunity #PriceActionTrading #15MinSetup
Solana (SOL/USDT) Technical Analysis – 4H🚀 Solana (SOL/USDT) Technical Analysis – 4H Timeframe | July 20, 2025
Solana is currently testing the major resistance at 181.57, riding a strong bullish trend across all timeframes. Price action, moving averages, and volume all point to a continuation — provided key confirmations hold.
🔍 Chart Structure & Key Levels
- 🔺 Resistance: 181.57
- 🟩 Supports: 168.21 | 158.39 | 145.58 (key support on deep correction)
📈 Indicators Snapshot
- ✅ Moving Averages: 14 of 15 flashing Buy — strong uptrend in play
- 🟡 Oscillators: RSI at 70.19 — near overbought, but no clear sell signal
- 🔁 MACD: Weak Sell — possible divergence or slowdown
- ❗️ AO & ADX: Neutral — waiting for confirmation
🧠 Fundamentals via Bitcoin
- BTC is ranging 🔄
- BTC Dominance is declining 🔻 → Good for alts like Solana
📊 Scenarios
🟢 Breakout Above 181.57
- Next targets: 188 → 195 → 199.74
- Valid if confirmed with volume + stable BTC
🟡 Rejected at Resistance – Pullback to Support
- Watch EMA20 (~176) & 168.21 for re-entry with better risk
🔴 Deeper Correction
- Losing 168.21 → Possible drop to 158.39 or 145.58
---
✅ Trade Idea: Entry above 181.57 only with confirmation — volume, breakout candle, or lower timeframe trigger
⚠️ Watch BTC — any sharp move could affect SOL
📉 Avoid jumping in before a confirmed breakout or clean pullback
---
🧲 Like what you see?
🔔 Follow for more pro-level setups
🚀 Smash the rocket if you're flying with Solana

SOL LONG POSITIONLooking for a long position off the bottom of this upward trendline, Trend continuation trade.

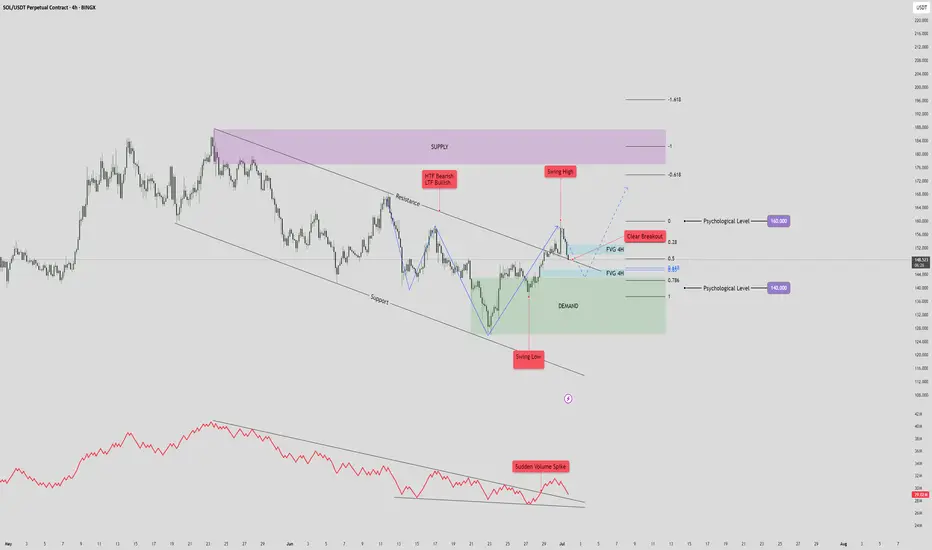
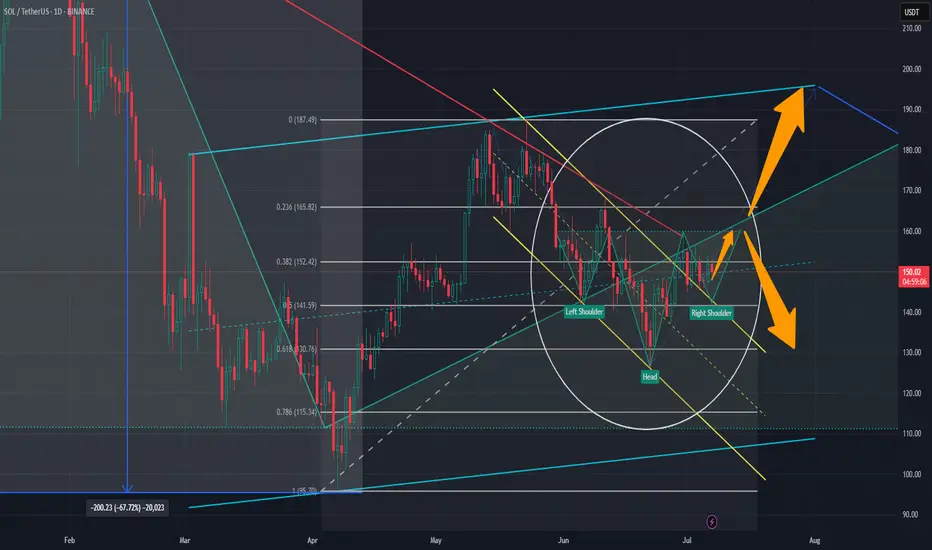
Solana (SOL/USDT) 4H Reverse H&S PatternSolana (SOL/USDT) – 4H Market Outlook | July 1, 2025
Introduction
SOL has formed a reverse head and shoulders pattern, followed by a clean breakout above resistance. While the lower time frame is bullish, the higher time frame remains bearish, creating a short-term opportunity within a broader downtrend.
Context 1: Key Zones
Supply Zone: 176 – 187
Demand Zone: 126 – 143
Psychological Levels: 140 and 160
Context 2: Technical Structure
Pattern: Reverse Head & Shoulders
Breakout: Confirmed above neckline/resistance
FVGs:
One below price (within demand)
One above price (potential target)
Golden Pocket: Sits just above lower FVG and inside demand — strong confluence support
Context 3: Volume Insight
OBV Indicator: Shows a sudden volume spike, adding strength to the breakout and the bullish pattern confirmation.
Bullish Scenario
Price pulls back into the golden pocket + FVG + demand zone
Finds support → bounces to form higher low
Second leg of the move breaks swing high → targets upper FVG and 160 psychological level
Bearish Scenario
Price breaks back below demand zone and invalidates the golden pocket
Fails to hold structure → reverts to macro bearish trend
Potential retest of previous swing low below 126
Summary
SOL is showing bullish momentum on the 4H after completing a reversal pattern and spiking in volume. A pullback into the demand zone confluence may offer a strong long setup — but failure to hold could revalidate the higher timeframe downtrend.
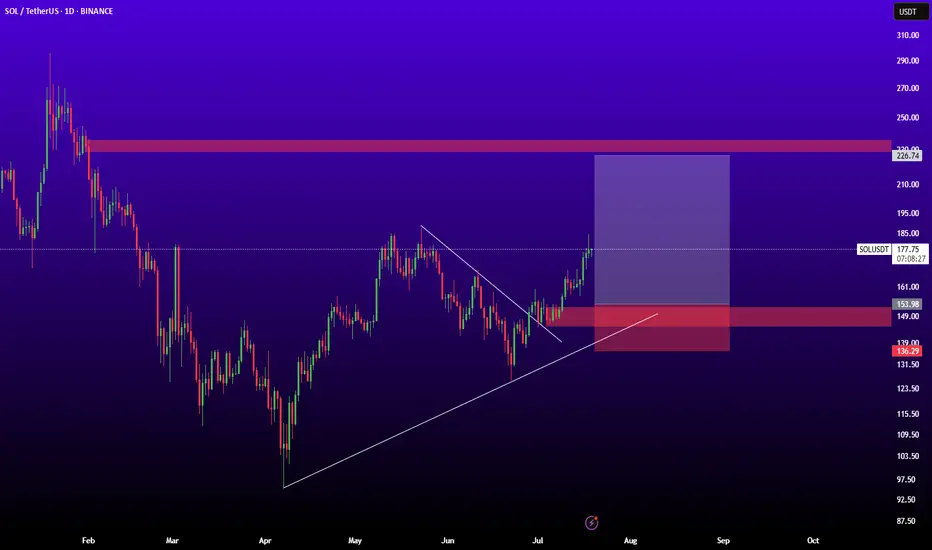
SOLUSDTThis signal for bull-trend because breaked trendline and higher high higher low.
best entry: 154
stop: 136
traget: 226
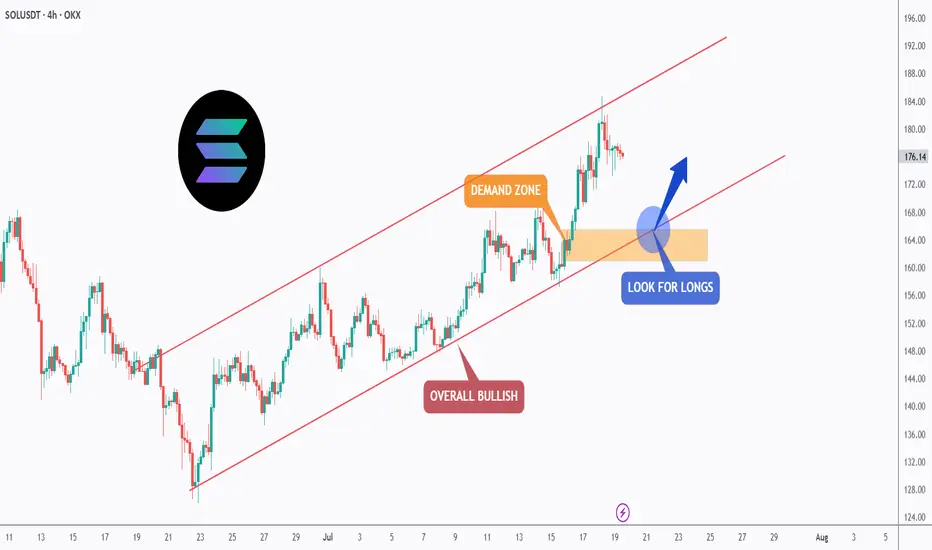
SOL - Trend-Following Longs in the making!Hello TradingView Family / Fellow Traders. This is Richard, also known as theSignalyst.
📈SOL has been overall bullish trading within the rising channel in red.
Moreover, the orange zone is a strong demand.
🏹 The highlighted blue circle is a strong area to look for buy setups as it is the intersection of the orange demand zone and lower red trendline acting as a non-horizontal support.
📚 As per my trading style:
As #SOL retests the blue circle zone, I will be looking for bullish reversal setups (like a double bottom pattern, trendline break , and so on...)
📚 Always follow your trading plan regarding entry, risk management, and trade management.
Good luck!
All Strategies Are Good; If Managed Properly!
~Richard Nasr
SOLANA I 3M CLS I 3STD Deviations Extension = $538 TargetHey what up traders welcome to the COT data and Liquidity report. It's always good to go with those who move the market here is what I see in their cards. I share my COT - order flow views every weekend.
🎯 Non Commercials added significant longs and closed shorts at the same time. So for that reason I see the highs as a liquidity for their longs profits taking.
📍Please be aware that institutions report data to the SEC on Tuesdays and data are reported on Fridays - so again we as retail traders have disadvantage, but there is possibility to read between the lines. Remember in the report is what they want you to see, that's why mostly price reverse on Wednesday after the report so their cards are hidden as long as possible. However if the trend is running you can read it and use for your advantage.
💊 Tip
if the level has confluence with the high volume on COT it can be strong support / Resistance.
👍 Hit like if you find this analysis helpful, and don't hesitate to comment with your opinions, charts or any questions.
"Adapt what is useful, reject what is useless, and add what is specifically your own."
— David Perk aka Dave FX Hunter ⚔️

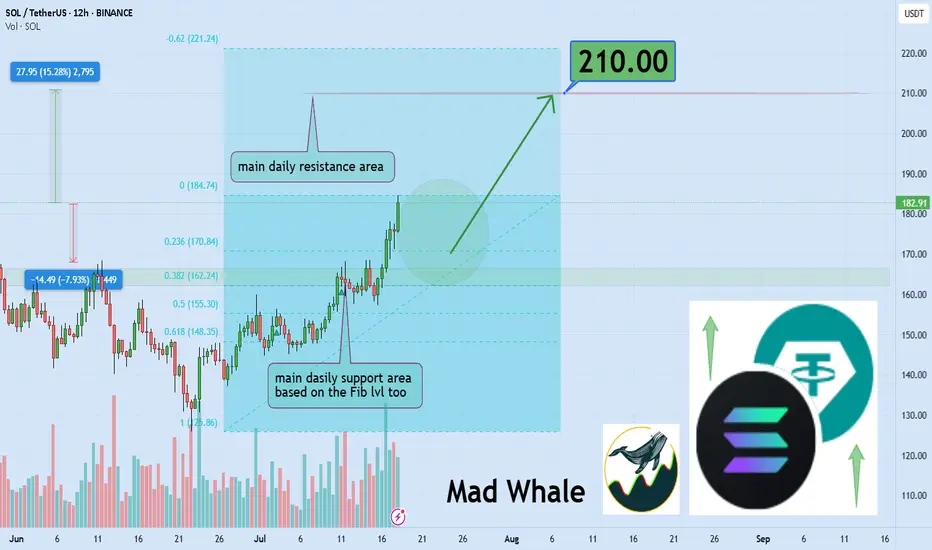
Solana Eyes 15% Rally, Targeting $210 After Key Support BounceHello✌
Let’s analyze Solana’s upcoming price potential 📈.
BINANCE:SOLUSDT is approaching a key daily support near the 0.38 Fibonacci level, setting up for a potential 15% rally with a target around $210. Breaking above the important psychological resistance at $200 could confirm a bullish trend continuation. 📈 If this level holds, SOL looks well-positioned for further upside in the coming weeks. 🚀
✨We put love into every post!
Your support inspires us 💛 Drop a comment we’d love to hear from you! Thanks , Mad Whale 🐋
Inverted head and shoulder suspected ..keep an eye on necklineHi dear friends and followers, I suspect this inverted head and shoulders pattern with a neckline around 160 usd. If it breaks in, it can go down toward the inferior support level around 130 usd and the 0.618 Fibo. If it breaks out it can go up until the next resistance and psychological level of 200 usd. As you can see, this 200usd resistance level does match with a large ascending channel.
You all need to DYOR and keep an eye on RSI and volume to confirm the movement and take a trade.
Wishing you the best and success on your decision.
SOL: The optimal entry level! Keep an Eye on SOL
Now is the time to watch SOL. If the price breaks to the upside, we could see a significant move that might take it above $190!
Trading Setup
If you’re considering trading SOL, here’s a quick setup that may help you.
The idea is: Buy when the price breaks above $170 and take profits at the levels shown in the chart.
Targets:
1. $175
2. $180
3. $188
-------------------------------------------
About our trades:
Our success rate is notably high, with 10 out of 11 posted trade setups achieving at least their first target upon a breakout price breach (The most on TW!). Our TradingView page serves as a testament to this claim, and we invite you to verify it!

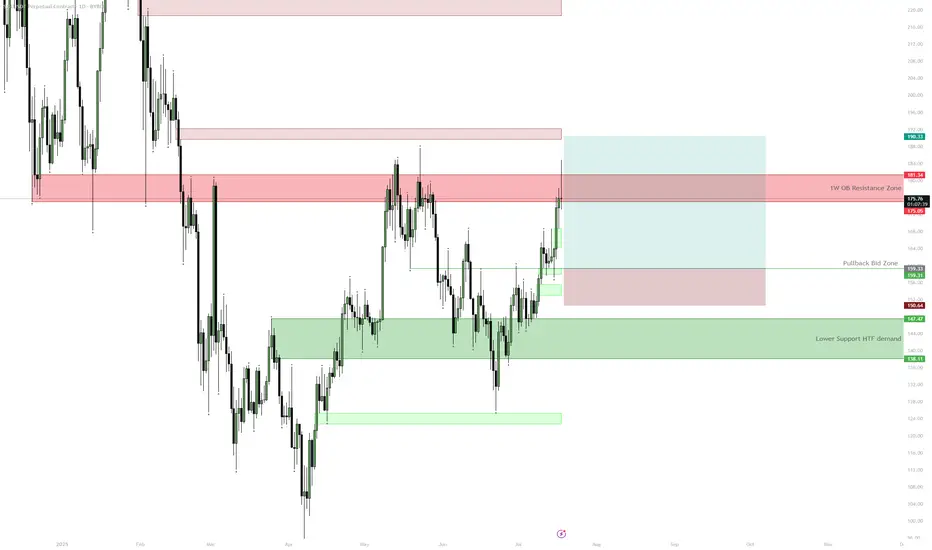
SOL — $180 HTF Resistance | Consolidation ExpectedSOL is approaching a key HTF resistance zone at $175–$181 with 1D RSI close to overbought. Unless price cleanly breaks above this area, a pullback to $160 or even the $138–$147 demand zone is likely before further upside. The setup provides a better risk/reward for longs on pullbacks after consolidation rather than chasing at resistance.
SOL Breakout — Eyeing $180 NextCRYPTOCAP:SOL | Breakout above channel — main target $180 next.
Watch $140–145 for retest/bounce. If failed, $112 is major support.
Trend: Bullish | Next stop: $180
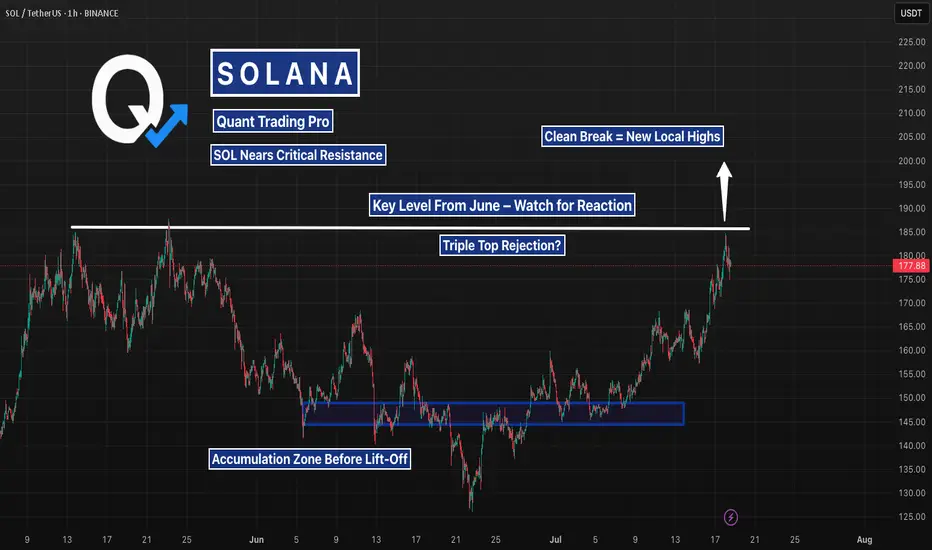
Solana Testing the June Breakdown Level — Decision TimeAfter weeks of slow grind, SOL is now pressing into a level that triggered a major selloff in June. A clean breakout here could flip momentum hard — but if buyers stall again, a short-term double top could catch late longs off guard. Watching $185 closely.

SOL/USDT Technical Outlook – Breakout Holding, Eyes on 175+Solana has successfully broken above the key resistance zone at $155–157 and is currently testing it as new support. If the level holds, this breakout could extend toward the next major target around $175–178.
📌 Key Insights:
Clean breakout followed by a potential SR flip
Watch for confirmation of support before continuation
Target aligns with previous swing high
Invalidated on breakdown below reclaimed level
🟢 Bias remains bullish as long as price holds above the breakout zone. A confirmed retest could provide a high-probability long setup.

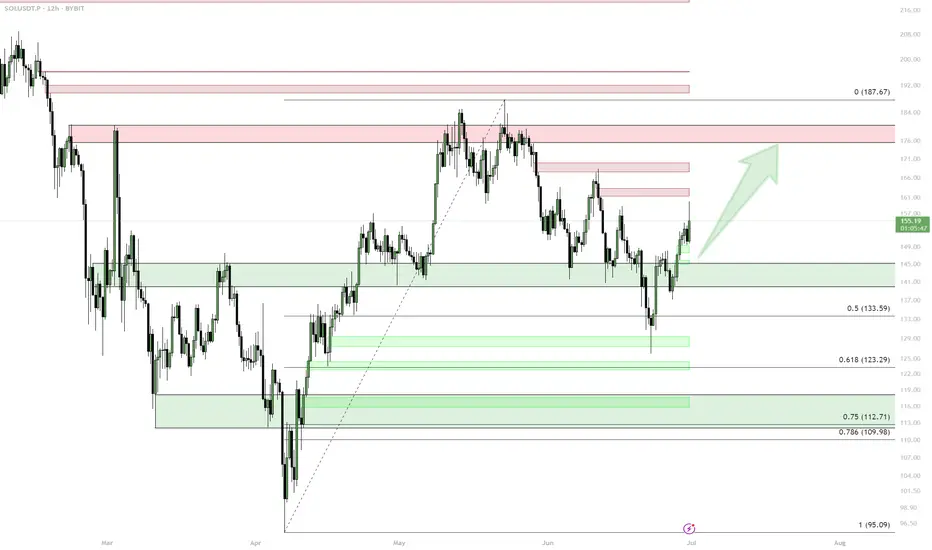
SOLUSDT – Healthy Pullback Before ContinuationSolana has shown strong bullish momentum recently, breaking out of a consolidation range and trending upward within a clear ascending channel.
However, in the short term, I expect a minor correction as price is likely to revisit the Fair Value Gap (FVG) zone marked around the $160–$165 area. This would be a healthy retracement within the trend and could provide a solid base for continuation toward higher targets.
If price respects the FVG and the lower trendline, SOL could resume its bullish move, potentially aiming for the $200 level and higher within the channel.
Key levels to watch:
FVG support zone: $160–$165
Resistance target: $200 – $220
Waiting for a pullback to enter on strength. Trend remains intact as long as the channel holds.

Solana starting to look bullish again | Target $180 - $260In my previous idea, I anticipated a liquidity hunt below the $140 level, and price action played out exactly as expected. SOL wicked below this key support zone, triggering stop-losses and inducing panic selling — classic behavior before a major reversal. Following this sweep, price quickly reclaimed the range, breaking out of the downward channel, and is now retesting a bullish break of a textbook cup-and-handle pattern, signaling a potential trend continuation to the upside.
📊 Technical Setup
Cup and Handle formation is evident, with the "handle" forming as a downward-sloping channel now being challenged.
Price reclaimed the $140 demand zone post-sweep and is now retesting.
Target zones: $180 → $220 → $260 based on historical resistance levels and measured move projections.
📉 Invalidation Level
A daily close below $120 (marked as the Invalidation Zone) would invalidate this setup and suggest bulls have lost control.
🌐 Macro Perspective
Fed Rate Cut anticipation and cooling inflation data are helping risk-on assets like crypto regain momentum.
SOL staking ETF launching this week, while SOL spot ETF approval imminent.
Solana's growing DeFi ecosystem, along with high TPS performance and low fees, continues to attract developer and user activity. SOL remains a top candidate for sector outperformance in a bullish H2 crypto cycle.
📌 Conclusion
With market structure turning favorable and strong macro tailwinds, SOL may be gearing up for a major breakout rally. Watch the $160 level closely — a decisive break and hold above could confirm the next leg higher.
