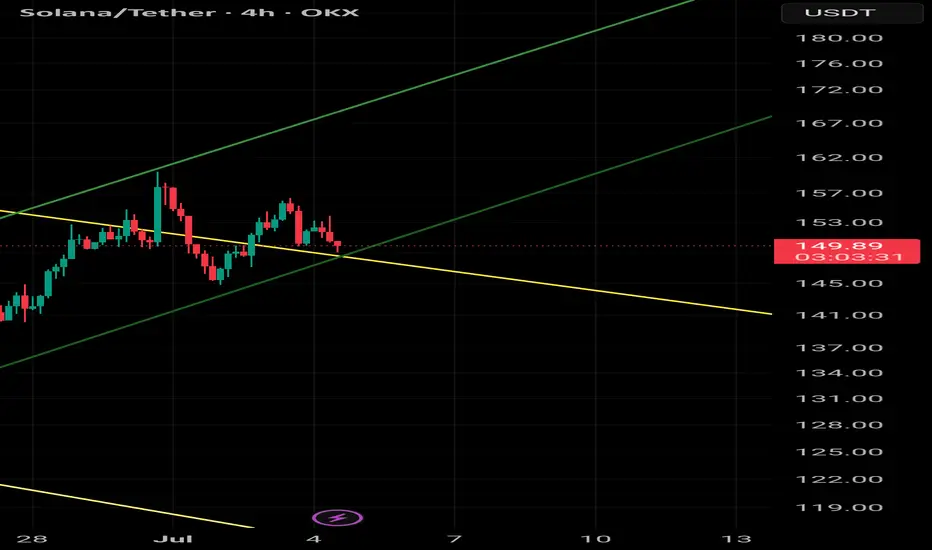
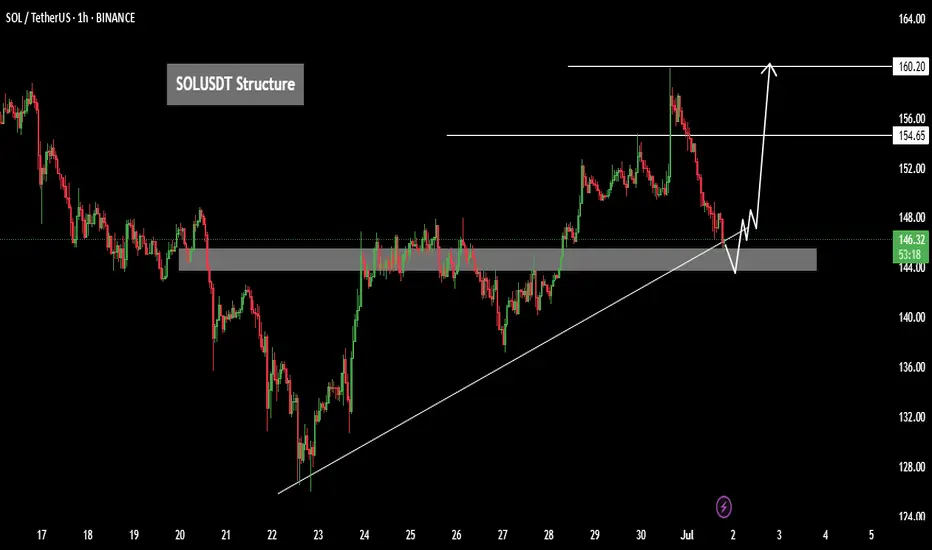
Exactly as I expected Lower low Love to see it as I plane 💯😬
The chart followed my plan so perfectly, I’m starting to worry it’s stalking me...
Like, chill Solana, I was just kidding when I said “do exactly this!” 😂📉📏
SOLUST trade ideas
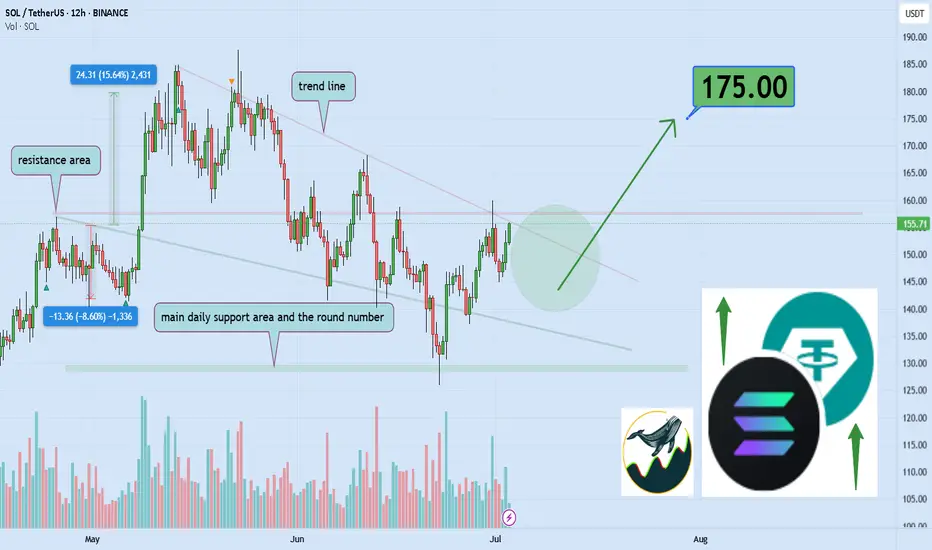
Can Solana reach $175 target after breaking $160 level?Hello,✌
let’s dive into a full analysis of the upcoming price potential for Solana 🔍📈.
BINANCE:SOLUSDT is approaching a crucial daily resistance level between $150 and $160. A clear break above this zone could lead to a 15% upside, with a target near $175 🚀. Keep an eye on volume for confirmation before entering the trade 📈.
✨ Need a little love !
We pour love into every post—your support keeps us inspired! 💛
Don’t be shy, drop a comment—we’d love to hear from you.
Big thanks , Mad Whale 🐋
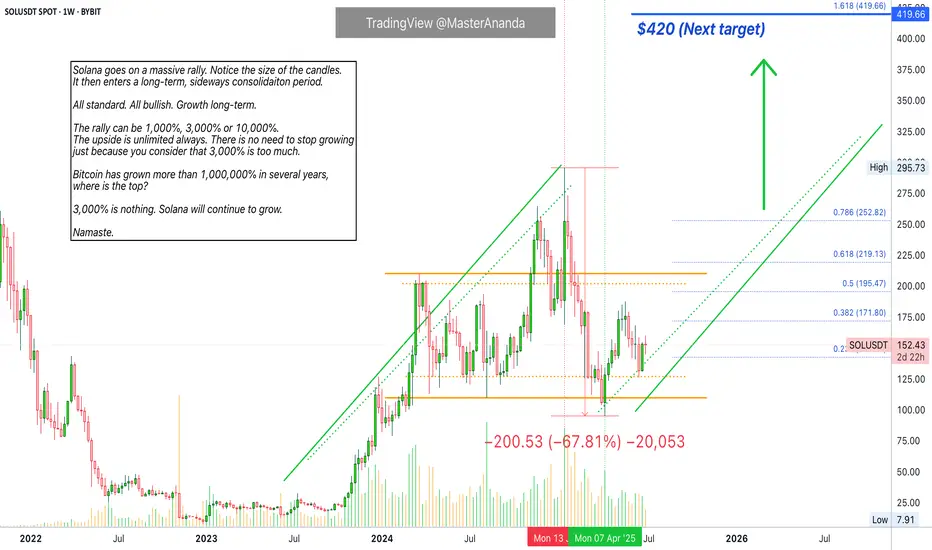
Solana Will Grow Despite "3,200% Rally"Oh my god! Folks, this friend of ours is saying Solana is going down because of a "3,200% rally." Crazy stuff. Can it continue growing after a 3,200% rally? But he is ignoring a massive correction between January and April. How big is the correction you ask? 67%. Meaning, there is no need to mention the previous rally because it has been corrected already.
Ok, hold on... Let's breatheeeeee deeply first.
Solana ETFs. Growing Cryptocurrency market. Global adoption. Old finance finally waking up to the new financial system. Even banks are starting to buy Crypto and opening up a ramp for their customers to buy Crypto, Solana, using their savings and other funds. This is why it will grow.
Think of this. Think of Apple, Inc. when it was young. Think of Tesla and Google and Microsoft. Would you quit after a 3,000% rally? Well, these companies are still growing today. Crypto is no different, it will grow for decades to come. Solana is going up. 100% certainty, you can see it on the chart; the fundamentals as well.
Get on board the bullish train, it is not too late.
Everything money goes into Crypto. You will be happy with the results.
If you stay out, your loss.
Namaste.
Solana Price Poised to Explode — But Only If This Level BreaksThe chart shows Solana trading around $153.85 USDT after a corrective rally from the June lows. Overall market structure has shifted in recent sessions, highlighted by a clear Break of Structure (BOS) on June 29, which signaled the first real attempt to reclaim higher ground after persistent weakness. However, the price has now approached a cluster of supply zones, which could either trigger a further rally if absorbed or mark a fresh rejection.
Above the current level, you can see strong red zones between 160–180 USDT, representing prior swing high supply and institutional sell interest. These are areas where large sellers previously stepped in to push price lower, so if Solana fails to break above this region with convincing volume, sellers may become more active again. In contrast, the nearest major demand zone sits around 137–140 USDT, highlighted in blue. This zone has acted as a key support and liquidity pocket where price has rebounded multiple times.
The Smart Money Concepts on the chart, including frequent CHoCH (Change of Character) and EQ/CHoCH labels, indicate that liquidity sweeps and engineered reversals have been common. This suggests the market may be preparing to hunt stops above recent highs or below recent lows before committing to a longer-term move.
At this point, the trend bias is cautiously neutral to bullish in the short term because the BOS suggests an attempt to reclaim higher levels. However, this bullish bias remains unconfirmed until Solana cleanly breaks and holds above 160–170 USDT. If sellers defend that area, the market could revert to the 137–140 zone.
Below is a clear trade scenario based on what the chart is showing:
Potential Trade Setup (Not Financial Advice)
Scenario: Short from Supply Resistance
o Entry: 153.85–154.35 USDT (currently being tested)
o Stop Loss: Above 160 USDT (invalidates bearish rejection)
o Take Profit Target: 137–140 USDT demand zone
Alternatively, if Solana rejects and returns to retest demand, this would offer a possible buy scenario for traders looking to play the rebound:
Scenario: Long from Demand
o Entry: 137–140 USDT demand zone
o Stop Loss: Below 135 USDT (confirms demand failure)
o Take Profit Target 1: 153.85 USDT resistance retest
o Take Profit Target 2: 170 USDT upper supply
At the moment, the price is balanced between these zones, so a wait-and-see approach can help confirm whether supply breaks or holds. A clean break above 160 USDT with strong momentum could invalidate the short idea and favor continuation higher toward the upper supply region around 170–180 USDT.
In summary, the chart structure is showing early signs of potential accumulation but still faces significant overhead resistance. Careful confirmation around the 154–160 level is critical before committing to either direction. If you’d like, I can help you refine these plans further or overlay additional indicators like volume or moving averages for extra confirmation.
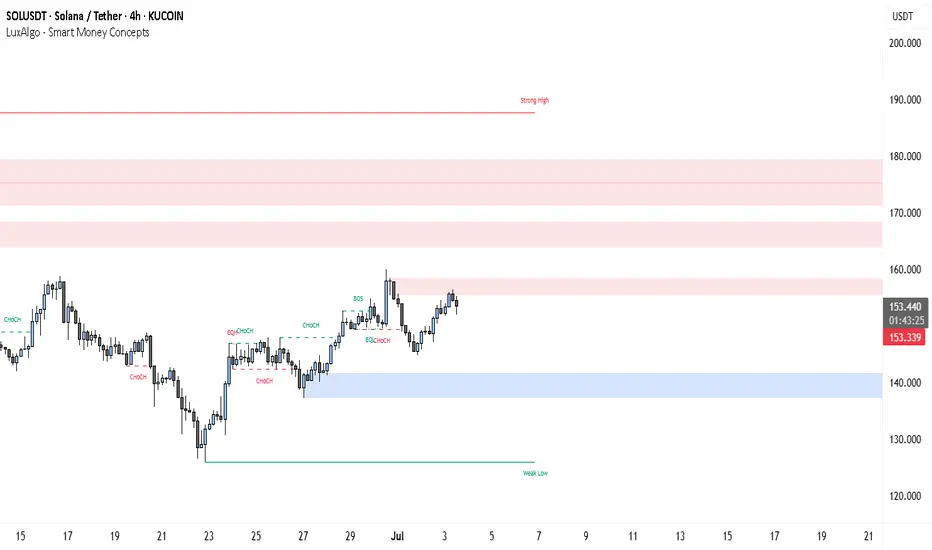
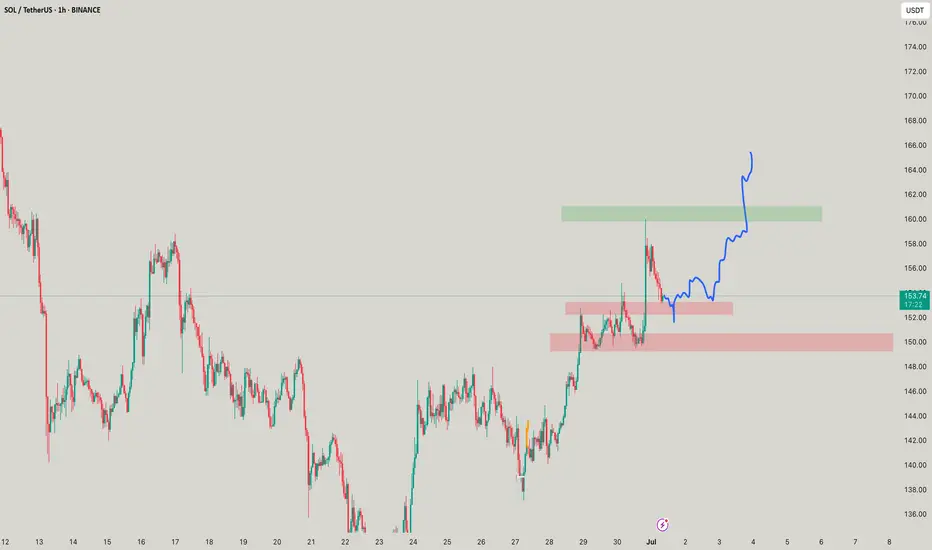
HolderStat┆SOLUSD confirmed the breachBINANCE:SOLUSDT rebounded sharply from the 145 region and broke above descending trendline resistance. Now holding the retest zone, it’s coiling for a move toward 164 in a classic breakout continuation setup.

#SOL/USDTSOLANA →
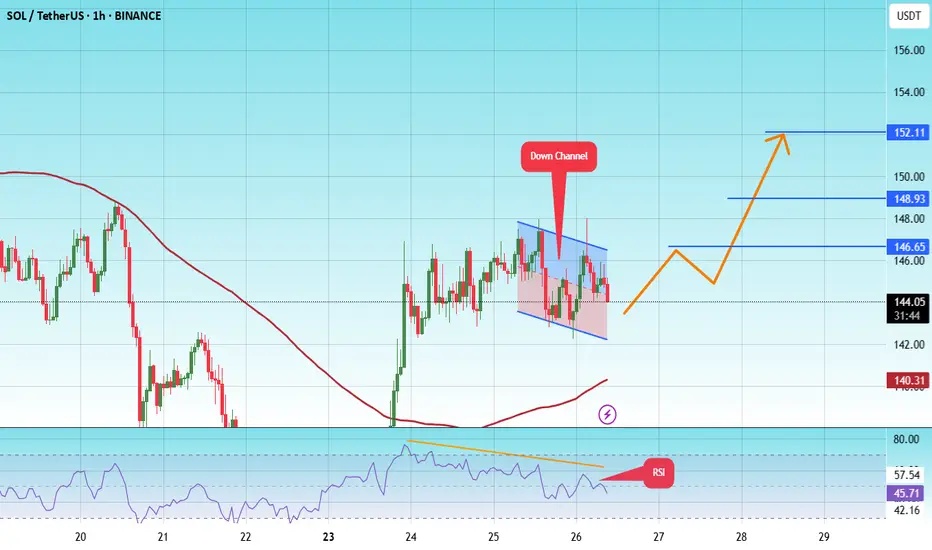
The price is moving within a descending channel on the 1-hour frame and is expected to break and continue upward.
We have a trend to stabilize above the 100 moving average once again.
We have a downtrend on the RSI indicator that supports the upward move with a breakout.
We have a support area at the lower limit of the channel at 142, acting as strong support from which the price can rebound.
Entry price: 144
First target: 146
Second target: 149
Third target: 152
For risk management, please don't forget stop loss and capital management
When we reach the first target, save some profit and then change the stop to entry
Comment if you have any questions
Thank You
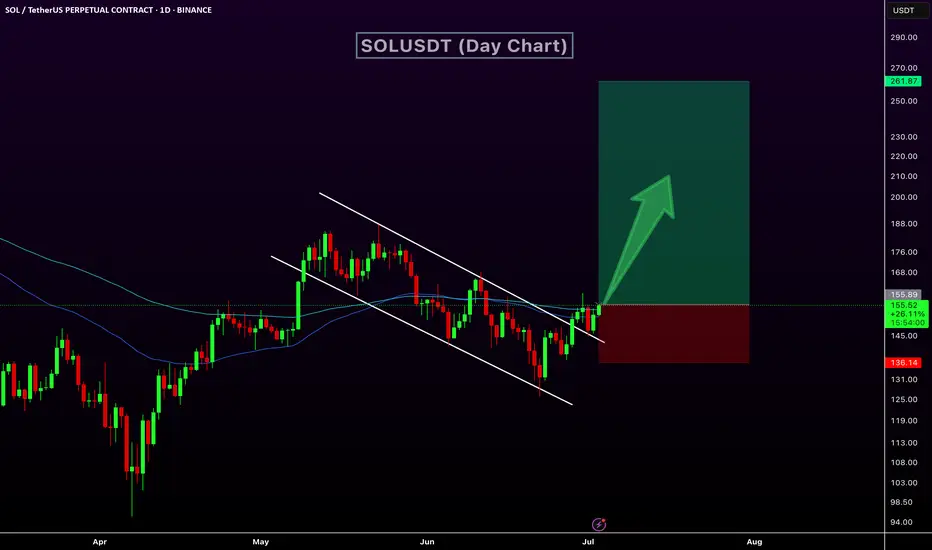
$SOL Bullish Breakout from Falling Channel | Eyeing $180 NextSolana (SOL) has broken out of its falling channel on the daily timeframe, indicating a potential trend reversal. After the initial breakout, SOL made a successful retest of the channel. However, it faced rejection at the 200 EMA, which is now acting as a critical resistance level.
Currently, SOL is attempting a second retest of the 200 EMA. If it breaks and holds above this dynamic resistance, we could see a swift move toward the next major target at $180, with potential to eventually revisit the previous all-time high near $260.
Supporting the bullish outlook:
📈 RSI is showing bullish divergence, confirming upward momentum.
📊 Price action is forming higher lows, establishing a clean uptrend structure.
🔍 Key level to watch: $156 resistance. A daily close above this could confirm the next leg up.
📌 Key Levels:
Resistance to break: $156
Short-term target: $180
Extended target: $260
EMA to watch: 200 EMA (Daily)

SOLUSDT Bullish Flag Pattern!Price has formed a Bullish Flag pattern on the daily timeframe. After multiple touches of both support and resistance, the price has now broken out above the falg resistance, signaling a potential trend reversal. and price trading above 50 and 100 EMA
Currently, SOL is bouncing from the channel breakout level, indicating strong bullish momentum. A clean breakout candle confirms buying interest, and the setup favors a strong bullish continuation if the breakout sustains.
Entry: Above $150
Stop-loss: Below $135
CRYPTOCAP:SOL TRADENATION:SOLANA
SOL - He sees everything!Ironically - It took my local SL and went up, but now it have two moves - two moves means either on the down bottom to top or moves directly on the top as said!
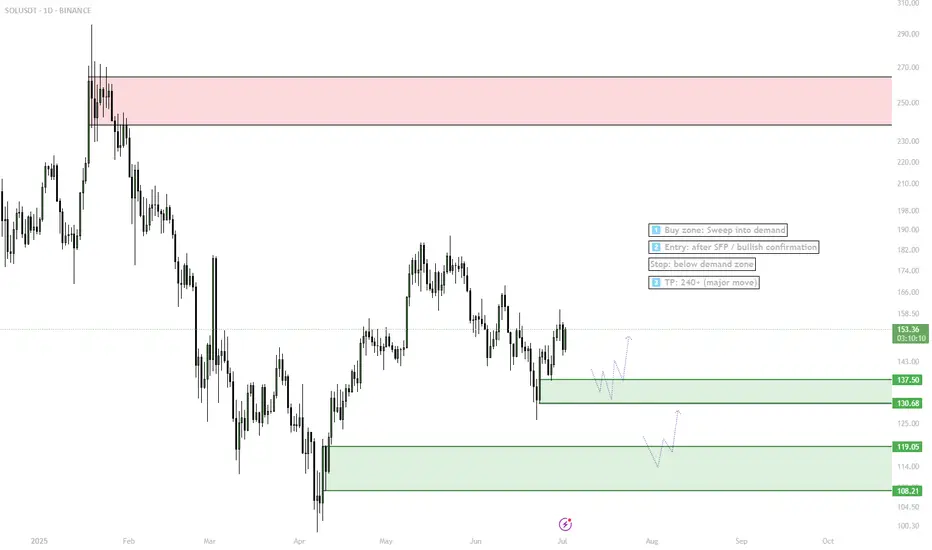
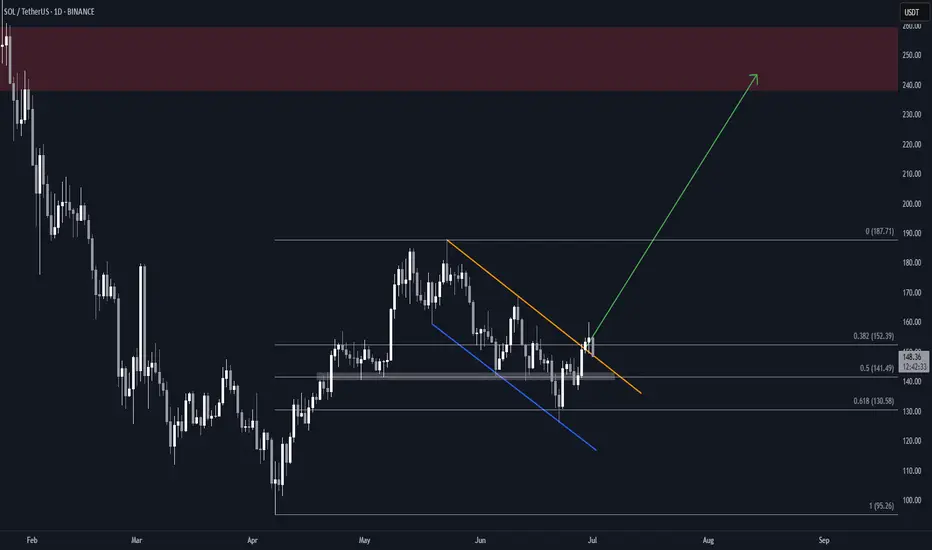
SOL — Liquidity Sweep & Demand Play1. Wait for price to sweep into demand
2. Enter long on SFP or strong bounce
3. Target: 240+
4. Stop: below demand zone
If no sweep, stay flat or wait for clear reclaim
SOLUSDT – Bullish Intraday AnalysisSOLUSDT – Bullish Intraday Analysis
]SOLUSDT is showing bullish momentum and currently testing a key resistance zone. Price action on lower time frames indicates a change of character (ChoCh), hinting at a possible trend reversal or continuation to the upside.
Key Technical Highlights:
✅ Resistance Breakout in Progress: If price holds above the local resistance zone (likely near a prior high or supply zone), we may see further upside.
✅ Structure Shift: A clear break and retest on lower time frames suggests
You may find more details in the chart Ps Support with like and comments for more analysis.
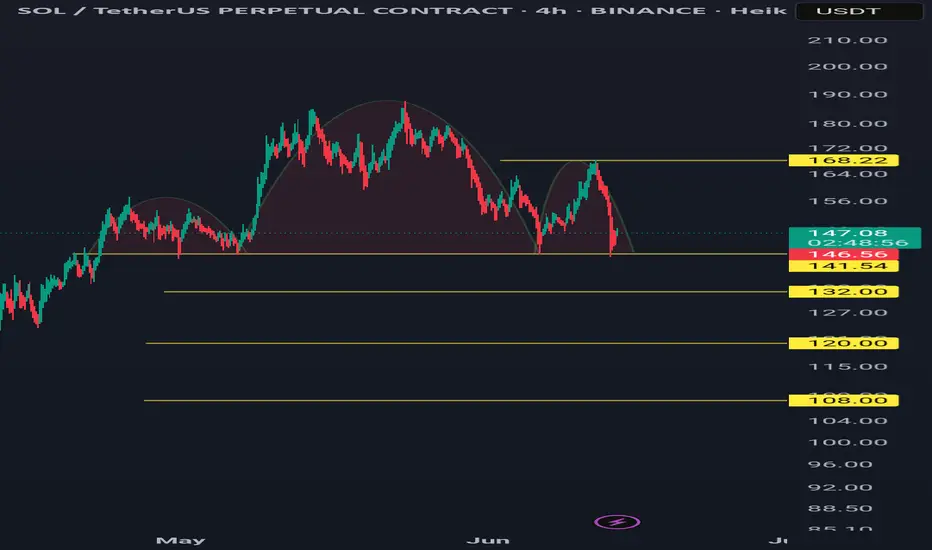
Solusdt 4hr tf bearishA bearish head and shoulders pattern is forming.
If it closes below 141.54 on the 4-hour timeframe, the pattern may be activated.
Targets are 132, 120, and 108.
Invalidation occurs if the high of the right shoulder (168.22) is broken.
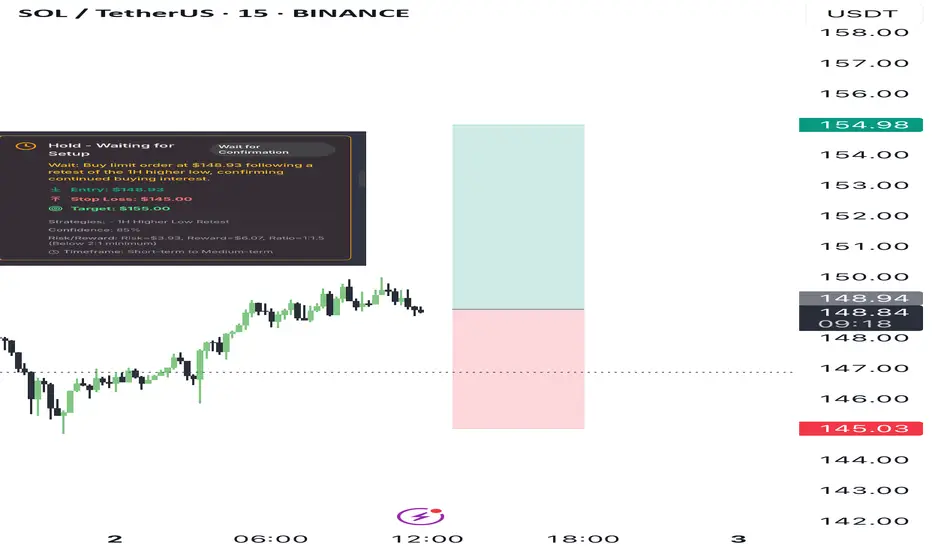
Long setup TiqGPT analysisAnalyzing the SOL/USDT across multiple timeframes, we observe a complex interplay of institutional activities. Starting from the 1D chart, the price action shows a recent recovery from a significant drop, suggesting a potential phase of accumulation or re-accumulation by institutions. The 4H and 1H charts display a series of higher lows, indicating a short-term bullish sentiment and possible preparation for an upward move.
The 15M, 5M, and 1M charts reveal more granular details of this bullish sentiment, with price action forming higher lows and testing previous highs, which could be indicative of a buildup of buying pressure. The presence of wicks on the lower side of candles in these lower timeframes suggests rejection of lower prices, a typical sign of institutional buying interest at those levels.
INSTITUTIONAL THESIS:
Institutions appear to be in a phase of accumulation, particularly noticeable on the 1D and 4H charts where the price has stabilized and started to curve upwards. The higher lows across the 1H, 15M, and 5M charts support this thesis, indicating an ongoing demand at higher price levels. This setup suggests a preparation for a potential upward breakout.
LEARNING POINT:
"1H and 4H higher lows formation amidst a broader 1D accumulation phase."
SIGNAL: WAIT
SYMBOL: SOL/USDT
ENTRY PRICE: $148.93
STOP LOSS: $145.00
TARGET PRICE: $155.00
CONDITION: Buy limit order at $148.93 following a retest of the 1H higher low, confirming continued buying interest.
RATIONALE: Calculated risk/reward ratio of 1:1.5 (Risk=$3.93, Reward=$6.07) does not meet minimum 2:1 requirement. Waiting for better institutional setup with improved risk parameters.
Momentum & Exhaustion: Rejection of lower prices on lower timeframes, indicating exhaustion of selling pressure.
Liquidity Behavior: Potential liquidity above recent highs around $150.00, likely target for institutional profit-taking.
Pressure Analysis: Institutional buying evident from wick rejections on lower timeframes.
Context Awareness: Price action moving from a discount (recent lows) towards a premium zone (above $150.00).
STRATEGIES USED:
1H Higher Low Retest
4H Accumulation Phase Buying
Targeting Liquidity above $150.00
SOLUSDTThere is no confirmation about short scenario yet, but I think we are in distribution phase, so I will wait for short opportunity in 190-220$ zone
News about Solana ETF with staking just give more confidence in such scenario
First target is 80$.
Also we have much lower targets but it is too early to say about them

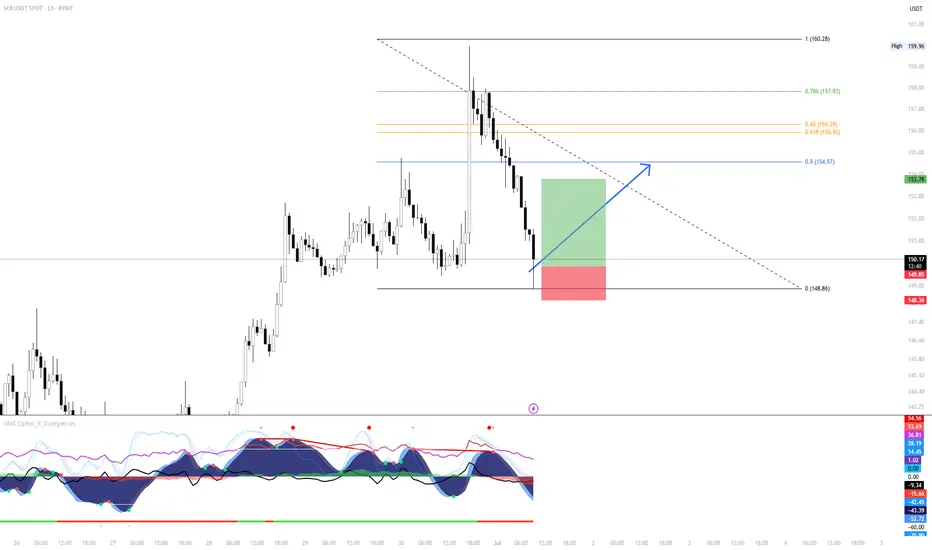
SOL/USDT Scalping Setup – 1H Reversal from Demand with FibonacciMarket Context:
Solana has pulled back into a key short-term demand zone after a sharp rejection from recent highs. Price action is now showing signs of local exhaustion, with confluence from lower timeframe support and bullish structure attempting to form. The setup anticipates a bounce targeting the mid-Fibonacci zone.
Setup Idea:
Price tapped into a local support shelf around 148.80, where previous demand initiated the last impulsive leg up. With momentum indicators stretched and RSI divergence building, this offers a high-probability scalp opportunity.
Targeting the 0.5–0.618 Fibonacci retracement zone as first resistance, with confirmation needed for further continuation.
Trade Plan:
Entry: Around 148.80–149.00
Stop Loss: Below 148.30 (beneath local swing low and structure break)
Target: 154.50–155.90 (Fibonacci 0.5 to 0.618 zone)
Risk/Reward: Approx. 2.5R
Notes:
This is a reactive setup — price must hold the current level or print a higher low. If sellers regain control below 148.30, the trade is invalidated. Watch closely for volume shift and 1H candle confirmation before adding size.
Mid-Fibonacci level (154.57) is a logical area to de-risk or take partial profits.
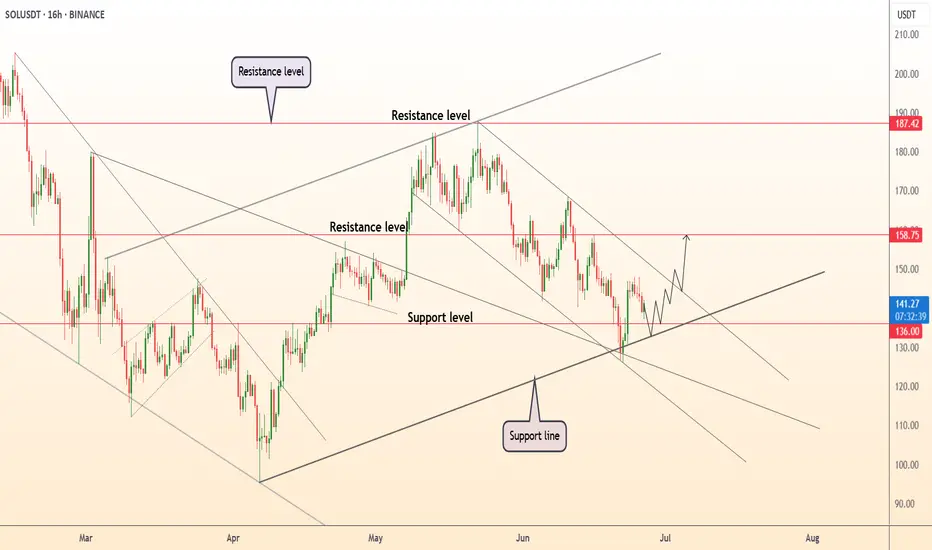
HolderStat┆SOLUSD aims for the $170 levelBINANCE:SOLUSDT has broken above triangle resistance, retesting the $146.60 level as new support. The breakout echoes earlier consolidation-based rallies, opening the path toward $170. As long as the structure remains intact, bulls could extend the climb over the next few sessions.

Solana (SOL) Flag & Pole Breakout (1D)BINANCE:SOLUSDT broke out of a textbook falling wedge two days ago, and is now retesting the former resistance as support.
Key Technicals
• Falling channel with clean structure and multiple touches
• Resistance trendline broken
• Price now retesting the breakout zone (~$148)
• Overhead supply zone at $238–$260
• Measured Target: $240, within supply
Why This Setup Matters
• Clear breakout followed by a retest, which can often precede the next leg up if support holds
• Falling channel retracement aligns with 0.618 Fib, a common reversal area
What to Watch
• Daily close above the previous resistance trendline
• Push above the local $160 high for full confirmation
DeGRAM | SOLUSD retest of the 136 level📊 Technical Analysis
● Price bounced at 136 where the rising-channel base meets a long-held internal trend-line, locking in a higher-low and printing bullish RSI divergence.
● A micro falling-wedge is fading; clearance of the wedge roof/150 round turns bias up toward the 158.8 horizontal pivot and the channel mid-band near 187.4.
💡 Fundamental Analysis
● Solana’s daily active wallets and DEX volume have risen ~20 % since 20 Jun as new DeFi incentive programs (Jupiter, Pyth, Kamino) go live, hinting at returning user demand despite broader crypto lethargy.
Summary
Buy 137-145; confirmed break above 150 targets 158.8 → 187.4. Long thesis voided on a 16 h close below 130.
-------------------
Share your opinion in the comments and support the idea with a like. Thanks for your support!
Your SOUL is for SOLSO SOL looks very nice to cruise up as stated earlier, targets for 161 can be seen!
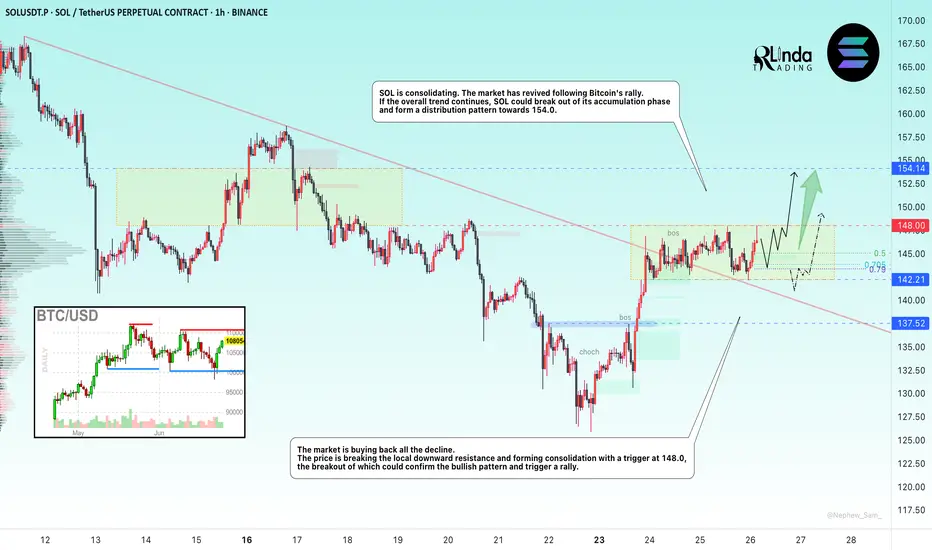
SOLANA → BINANCE:SOLUSDT.P is consolidating after breaking through trend resistance. The market trigger is 148.0, and Bitcoin is provoking the market to recover...
The market is buying back all the losses. SOL breaks the local downward resistance and forms consolidation with a trigger of 148.0. The market has come to life following the rallying Bitcoin. If the general trend continues, SOL may break out of the accumulation zone and form a distribution towards 154.0
The latest retest of resistance is provoking a correction. Before rising, the price may test the zone of interest at 144 or the lower boundary of consolidation at 142.2. The ideal scenario would be a false breakdown of support at 142.2 before rising.
Resistance levels: 148.0, 154.2
Support levels: 142.2, 137.5
Fundamentally, the situation for the crypto market is improving. Technically, the market is also showing positive dynamics. SOL is consolidating after growth, which is generally a positive sign. Now we need to wait for the price to break out of consolidation and continue its growth. One of the signs of this is a rebound from the 0.5 range and a quick retest of resistance with a gradual squeeze towards the trigger.
Best regards, R. Linda!
Solana (SOL): Aiming For $200 | June 2025Solana coin is still showing some kind of buyside dominance, where we are keeping close attention at 100 and 200 EMA on a 4-hour timeframe.
More in-depth info is in the video—enjoy!
Swallow Academy

The price can reach $160-170 and then drop to $80-90.The price can reach $160-170 and then drop to $80-90.
If you want to invest, this is not a good place to enter.
It is a downtrend.
Please do not buy on the downtrend.
you must think to Short in downtrends.
Let it go lower and buy when change to bullish.

Weekly trading plan for Solana Last week, BINANCE:SOLUSDT price followed our bullish (green) scenario perfectly and hit the first target. At this point, the upward corrective phase may be complete, so we could reasonably expect a pullback to either the weekly pivot point or support zone
Write a comment with your coins & hit the like button and I will make an analysis for you
The author's opinion may differ from yours,
Consider your risks.
Wish you successful trades ! mura
