SOLUST trade ideas
bitcoin update right so this is what im seeing, the chart showing right now
a pullback to 102800 approx is absolute for a healthy change in trend. this pullback is backed by 3 points,
1 no such volume in the pole and flag pattern breakout
2 liquidity which works as a magnet is more in down, market will eventually make a new ATH but it wont make that ath until grabbing all the liquidity and leaving retailers in fear.
3 we're at a good strong resistance and the daily close today was showing sign of weakness and possible change in trend.
a short with sl above 109000 can be done,
wont short eth but i have some alts in mind with some scalp short chances
ethfi, cake, aave, link. trading in alts are risky so make your own judgement, im no financial advisor
thanks
SOL - It won't take your soul!SOLOLOL - SOL basically can go direct or if not a halt and a move! But all is interlinked and intertwined to btc!
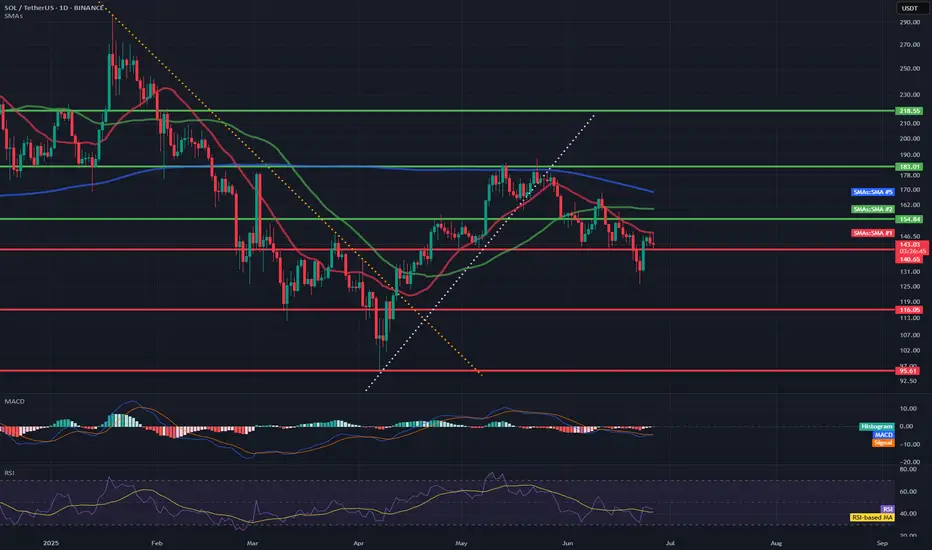
SOL/USD🔹 Trend direction
Current short-term trend: down
Price below key moving averages:
SMA50 (green) ≈ 154.84
SMA200 (blue) ≈ 168.79
Price ≈ 142.49 – below both, confirming weakness.
🔹 Supports and resistances (key levels)
✅ Supports:
142.00–143.50 – current level where price is struggling (multiple price reactions).
131.00 – strong support, last low (June 18).
119.00 / 116.00 / 113.00 – next supports from previous consolidations.
95.61 – deep support if market breaks down.
❌ Resistances:
148.00–150.00 – local resistance, coinciding with the red SMA (short-term resistance).
154.84 – resistance (SMA50).
162.00 – resistance (SMA200).
183.00 – main resistance from the May peak.
218.55 – very strong resistance from March.
🔹 Technical indicators
📉 MACD:
MACD line < signal, negative histogram → bearish signal.
No signs of bullish strength.
📉 RSI:
RSI ≈ 41.31 – close to the oversold zone, but not there yet (below 30).
RSI trend also downward.
🔹 Formations and trend lines
Broken support line after the April-May bullish structure (white trend line).
The previous bearish trend line (yellow) was broken in April, but the momentum did not hold.
A lower high and lower low may be forming now – a classic bearish structure.
🔹 Potential scenarios
🔻 Bearish:
Breakout of 142 → test of 131 → possible drop to 119/116.
Staying below SMA50 and MACD still negative = high chance of continuing declines.
🔼 Bullish:
Recovery of 148–150 needed → only then a chance to test 154 and SMA50.
RSI close to oversold = possible local technical bounce, but not reversing the trend.
📌 Conclusions / Summary
General trend: Bearish (down).
Sentiment: Negative, no confirmed signals of strength.
If level 142 breaks - next test will be at 131.
A strong breakout above 150-154 is needed to talk about a change in structure.
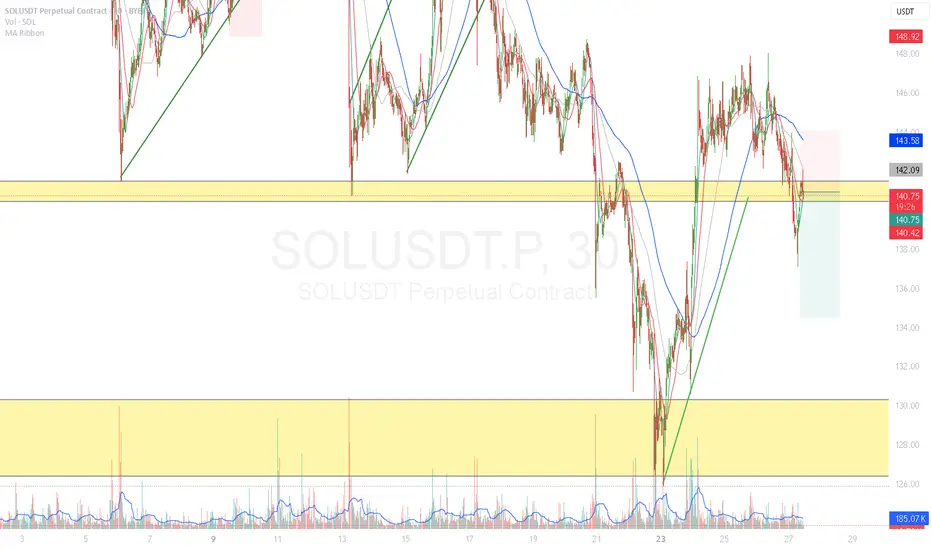
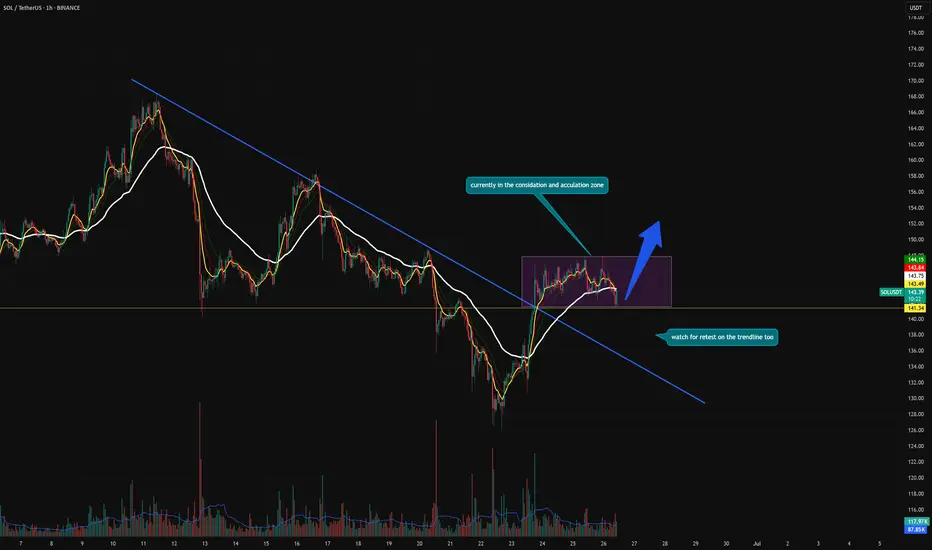
SOL/USDT – Breakout Play in Progress | Accumulation Before ExpaN📍 Overview:
SOL has successfully broken out of a major descending trendline that has been acting as resistance since mid-June. Price is now consolidating above that line, forming a tight accumulation zone — a classic pre-breakout setup.
🔍 What I'm Watching:
Price is currently holding within a sideways range (highlighted in purple).
The previous downtrend line may now act as support — I'm watching closely for a retest of that trendline.
Moving averages are curling upward, signaling a shift in trend.
Volume has declined during consolidation — which often precedes a strong move.
📈 Potential Setup:
A breakout from this accumulation box could trigger a strong bullish continuation, possibly toward the next supply zone around $150–$154.
If price breaks down from the box, I’ll look for a trendline retest as a second chance long entry.
HolderStat┆SOLUSD above the supportBINANCE:SOLUSDT reclaimed the $140 level after a wedge breakout and is now forming a stair-step recovery structure. The price is targeting the mid $150s with higher lows supporting the bullish thesis. Previous consolidations and wedge formations suggest buyers are regaining control. Continued strength above $140 reinforces the move.

sol updateentry price 169.14
stop loss update 169.14
take profit
160.1
145.1
131.5
result full target
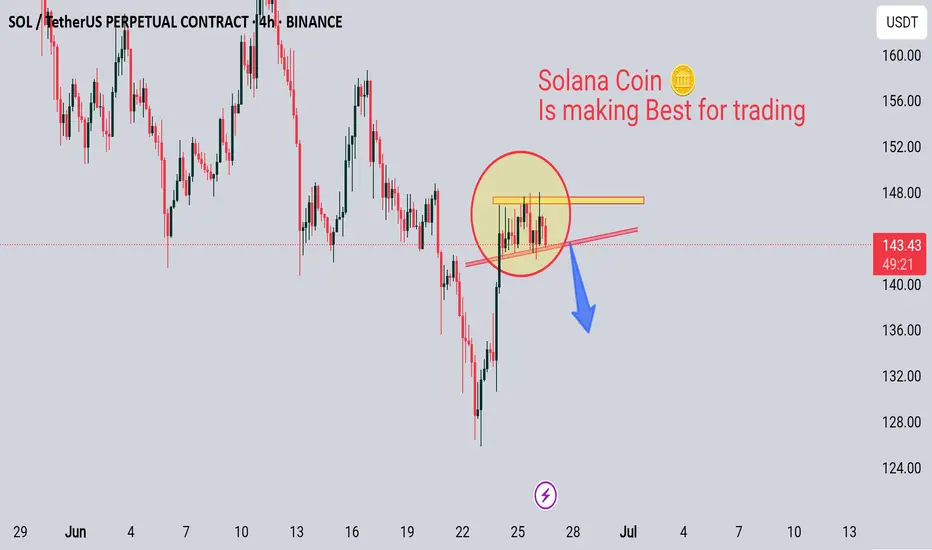
Solana is Making For Trading Hello trader's
Take a look in solana coin ...
Bitcoin is still In waiting holding....
But Solana breaks fast ⏩⏩⏩
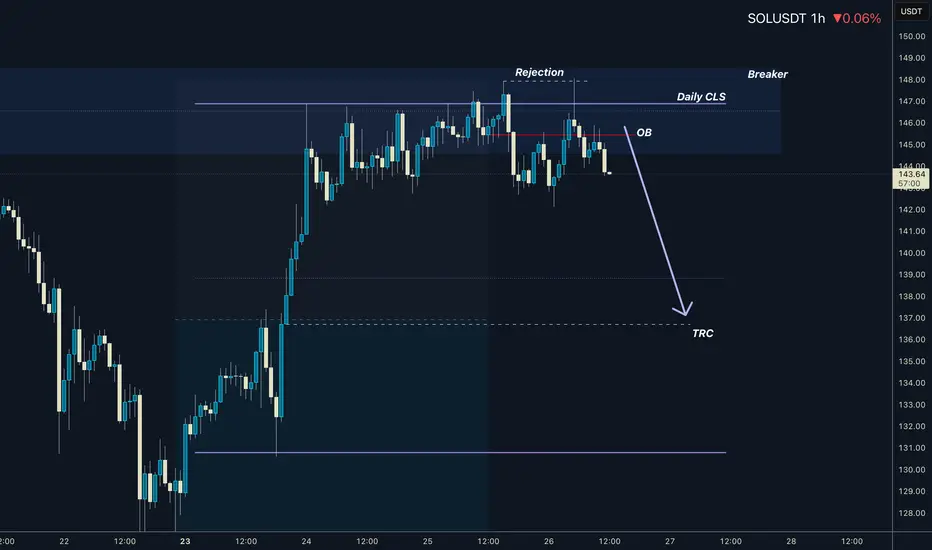
SOLANA I Daily CLS I KL - BRK I Model 1I Target TRCHey, Market Warriors, here is another outlook on this instrument
If you’ve been following me, you already know every setup you see is built around a CLS Footprint, a Key Level, Liquidity and a specific execution model.
If you haven't followed me yet, start now.
My trading system is completely mechanical — designed to remove emotions, opinions, and impulsive decisions. No messy diagonal lines. No random drawings. Just clarity, structure, and execution.
🧩 What is CLS?
CLS is real smart money — the combined power of major investment banks and central banks moving over 6.5 trillion dollars a day. Understanding their operations is key to markets.
✅ Understanding the behavior of CLS allows you to position yourself with the giants during the market manipulations — leading to buying lows and selling highs - cleaner entries, clearer exits, and consistent profits.
📍 Model 1
is right after the manipulation of the CLS candle when CIOD occurs, and we are targeting 50% of the CLS range. H4 CLS ranges supported by HTF go straight to the opposing range.
"Adapt what is useful, reject what is useless, and add what is specifically your own."
— David Perk aka Dave FX Hunter ⚔️
👍 Hit like if you find this analysis helpful, and don't hesitate to comment with your opinions, charts or any questions.
SOl on Resistance level. If this area is broken and retested I will buy otherwise will wait to buy the low around 126$
Give me your SOL!!SOL not SOUL!! Just look at it and understand your stances whats gonna happen if it happens!

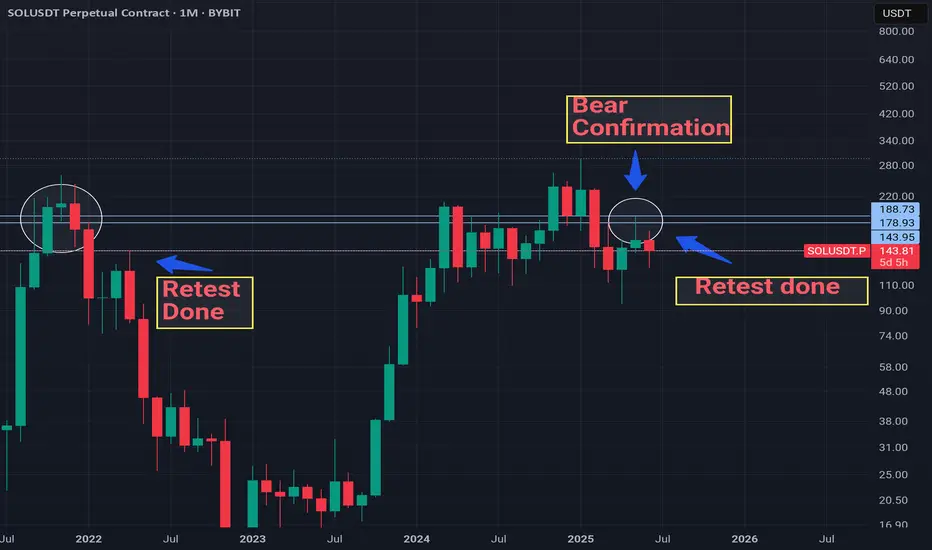
SOLANA BEAR SEASONCurrently i believe that Solana already confirmed bear season last month.
Monthly candles show us that price retest completed to previous 3 candles and turned direction down.
In my opinion highly likely $295 was all-time-high for this cycle and price will continue to drop until the end of year.
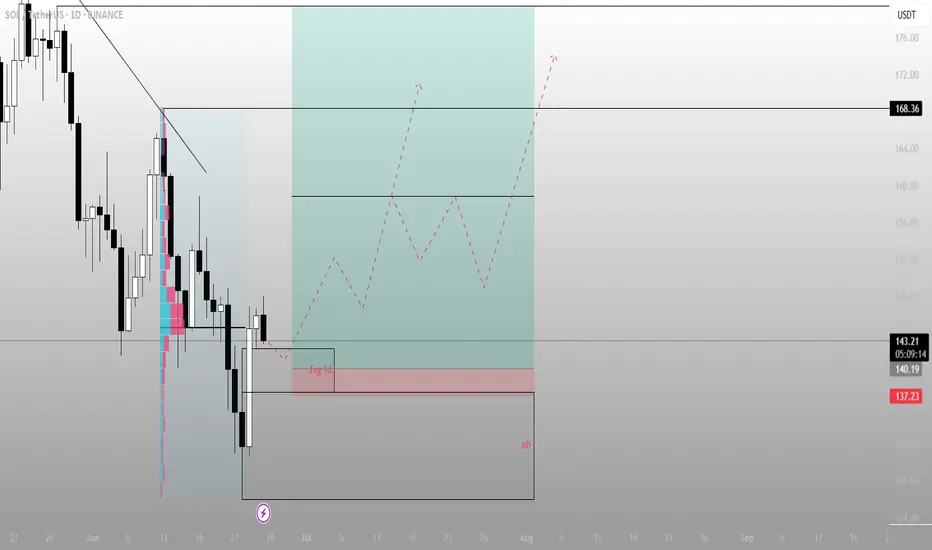
Most see rejection. I see a launchpadWhat looks like a failed breakout is actually SOL setting up for a higher timeframe reversal, right at a refined zone of inefficiency and Smart Money interest. The narrative isn’t over — it’s just beginning.
Technical Breakdown:
Current Price: ~$143.30
Context:
Price tagged the Fair Value Gap (FVG) on the daily and showed reaction — a sign of algorithmic awareness
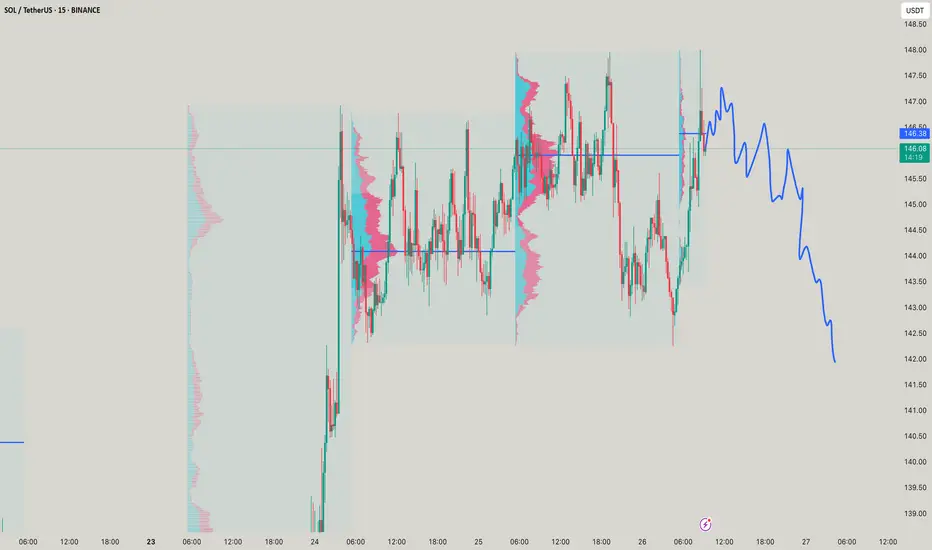
Volume profile suggests thin liquidity above, ripe for expansion if momentum kicks in
Key Levels:
FVG (1D) zone: just under current price (~140.19)
Order Block (OB): ultimate demand zone near 137.23 — strong structural support
Downtrend Line: recently broken, retest in motion
Major Upside Target: 168.36 — a clean liquidity magnet
Strategic Thesis:
Price dipped into FVG but held above the OB — a classic Smart Money accumulation setup
The dashed projection shows potential higher lows forming, giving fuel for a push through prior highs
FVG + OB form the discount zone, where risk/reward is maximized before the next impulse move
Execution Plan:
Entry zone: $140.00–137.50
→ Expect small shakeouts before confirmation
Invalidation: Daily close below $136 kills the bullish case
Target:
Primary: $168.36
Stretch Goal: $172–176 if momentum is sustained into August
Long trade
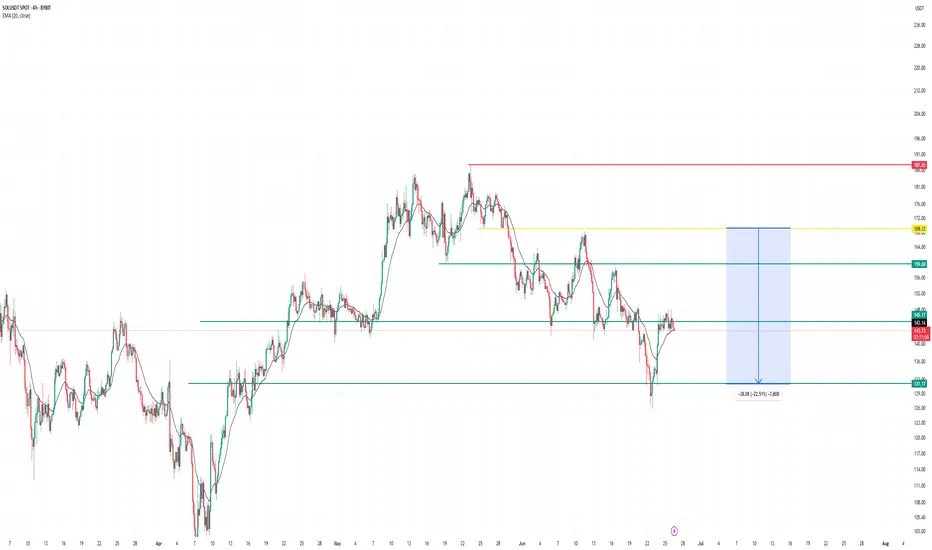
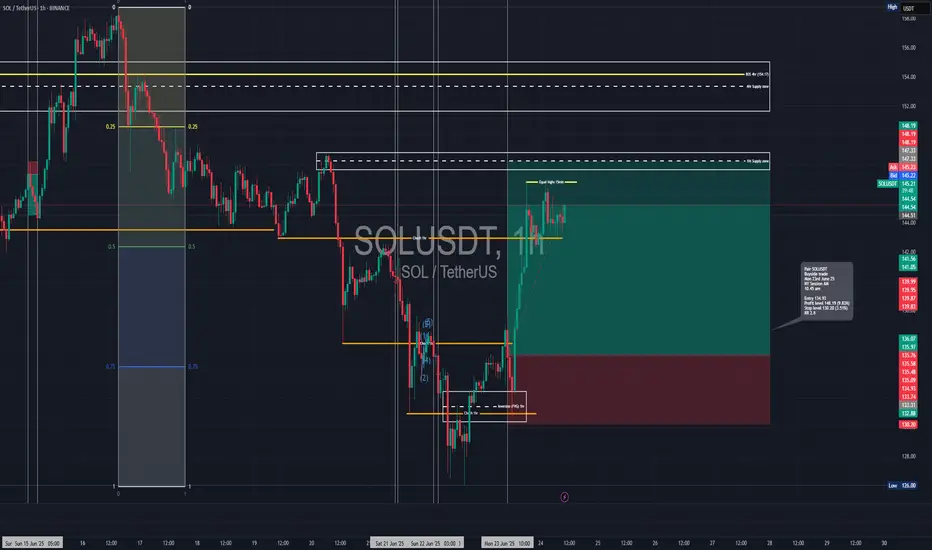
🟢 Trade Journal Entry – Buyside Trade
📍 Pair: SOLUSDT
📅 Date: Monday, June 23, 2025
🕒 Time: 10:45 AM (NY Session AM)
⏱ Time Frame: Not specified (assumed 4Hr or intraday swing)
📈 Direction: Buyside
📊 Trade Breakdown:
Metric Value
Entry Price 134.93
Profit Level 148.19 (+9.83%)
Stop Loss 130.20 (−3.51%)
Risk-Reward
Ratio 2.80 1
🧠 Context / Trade Notes:
Range Expansion Setup:
4H Demand Tap / Rejection:
Price respected a previously unmitigated bullish OB near $130 before printing consecutive higher lows.
Volume Increase + Session Alignment:
The NY session entry coincided with a volume surge and expansion candle, indicating breakout momentum.
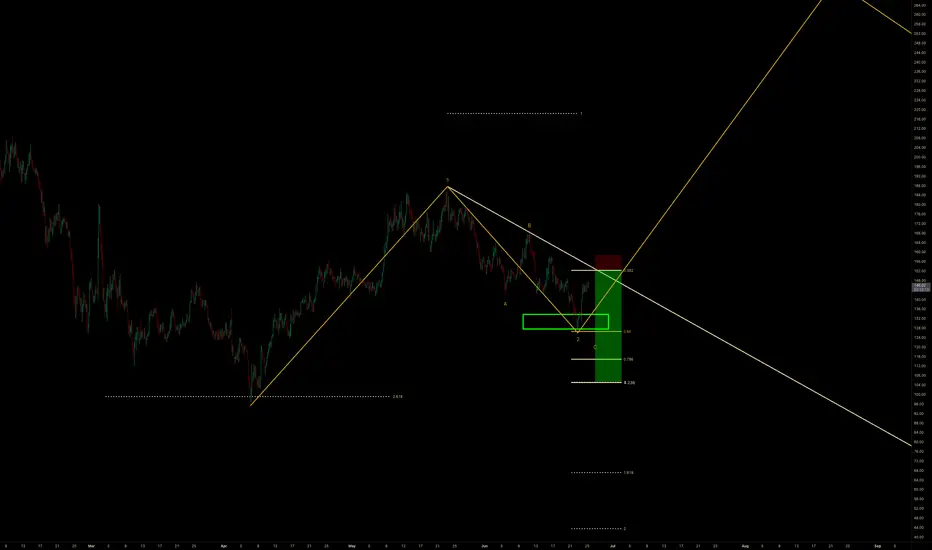
SOLUSDT | T.A.P.E. Method Breakdown: Has Solana Bottomed Or Not?Let’s walk through the T.A.P.E. Method I use to read every chart. This isn’t about price alone — it’s about structure, behavior, pressure, and clarity. Solana is at a critical decision point. I’ll explain what smart money is likely seeing, and how I’m approaching this chart with logic — not guesses.
T — Territory (Know the Zone Before You Clone)
I started with the Fibonacci retracement from the all-time low to all-time high. It’s clear SOL is reacting near the golden pocket zone — a historically strong area for reversals.
We also saw strong support at the 2618 extension after the first major leg down. This alone gave an 87% rally. That’s how clean setups work — clarity beats complexity.
Market structure remains bullish on higher timeframes. Yes, we’ve had a wick below prior lows, but no clean break — structure still holds for now.
A — Activity (Price Behavior Over Indicators)
I don’t use RSI or crossovers. I look at behavior.
From the local low to the swing high, the retracement again held the 618 zone, showing buyer defense.
However, on a second leg down, SOL broke below the 2618 level — a key difference. This shift in behavior is what I’m watching closely. Price pushed past 236 on the retrace — that can hint at a stronger bullish leg forming.
But...
P — Pressure (Pain Points and Traps)
Here’s where most traders get caught.
Early longs that entered during the last local rally are underwater. Especially those who bought around the value area high — they are likely hoping to exit break-even, adding sell pressure.
This is classic: a liquidity zone stacked with pain.
That pressure zone sits just above the current range, near $153–$164. If we get a strong move into that zone without structure, I’ll be watching for short setups — not breakouts.
E — Execution (No Setup Is Complete Without a Plan)
Here’s how I’m structuring it:
No-trade zone: Where we are now. No edge here.
Short area 1: $153 — trendline + resistance
Short area 2: $164 — invalidation just above
Target: Sweep lows + retest $138/$128
Invalidation: Clean breakout above $164 with structure
Support zones to watch:
$138 (value area low)
$128 (786 Fib)
$122 (old structure pivot)
If price forms structure and pushes through the golden pocket cleanly, then I shift bias. But for now — pressure remains to the downside.
Summary & Context:
This T.A.P.E. breakdown keeps me from chasing noise and protects capital. Too many early longs, weak structure, and clean resistance zones make this a potential short setup — not a long.
If price flips those resistance zones into support with structure, I’ll adapt. Until then: Plan the move. Let the market prove.
Disclaimer:
This is not financial advice. All opinions are my own, based on chart behavior and analysis. Do your own research. This is a paper money breakdown shared for educational purposes only.
SOLANA SELLGreetings to all my big bro and big sis, Hopefully we all are doing well? Here on this post i shared my sell analysis on BINANCE:SOLUSDT.P using dailyTF chart.

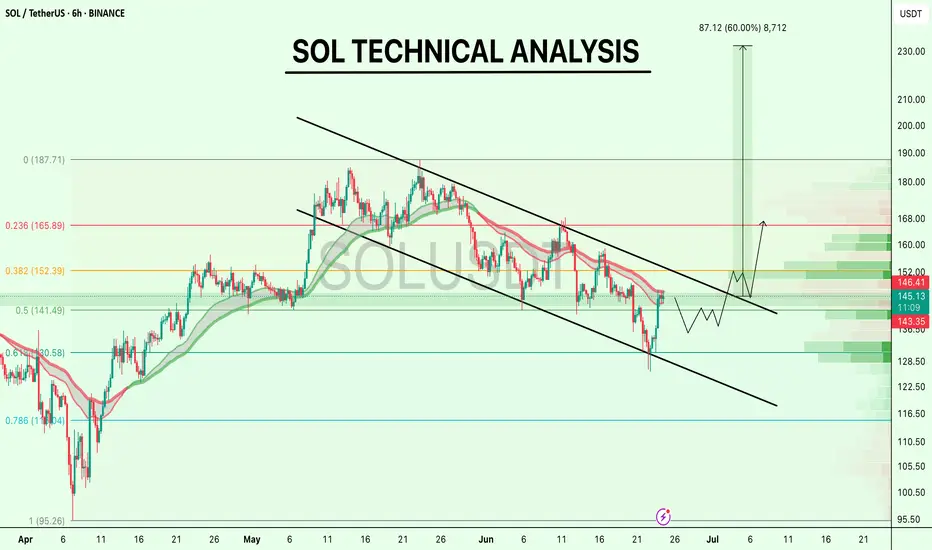
SOL TECHNICAL ANALYSIS !!CRYPTOCAP:SOL is testing the upper boundary of its falling channel.
No breakout yet, just a clean retest of trendline resistance + 0.5 Fib zone around $144–$146.
A breakout above $152 (Fib 0.382) with volume could shift the structure bullish. Until then, it’s still inside the downtrend.
This is where patience pays, wait for confirmation, not hope.
What’s your play here?
If you find my updates helpful, don’t forget to like and follow for more!
DYOR, NFA
#Solana #SOL
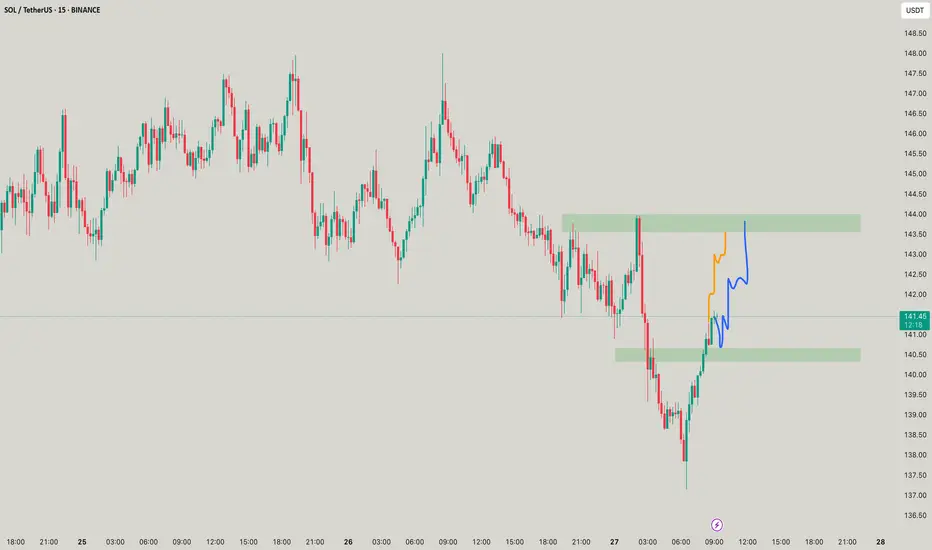
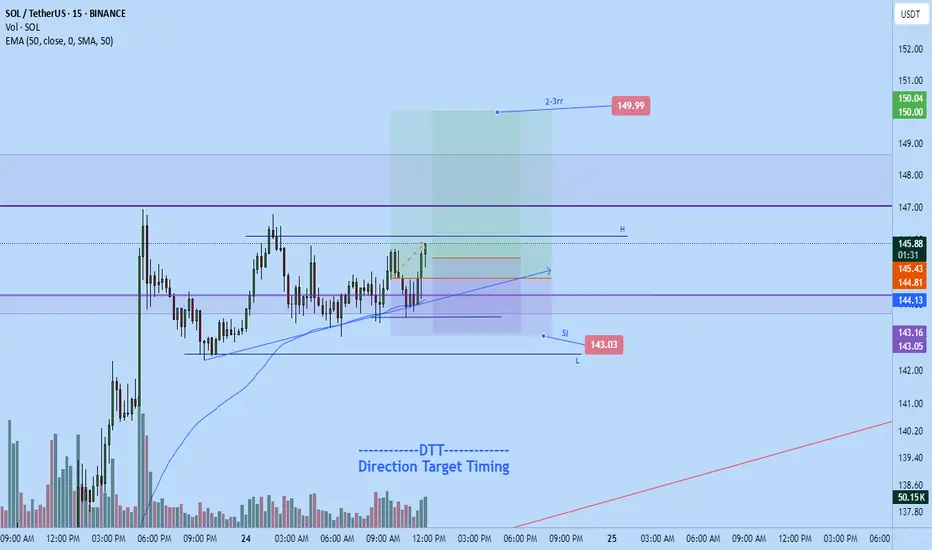
Solana longJust now recently entered a long trade on #solana
Target: $149.99
Sl: $143.03
Roughly 2RR from current entry
Time sensitive, looks likely to breakout any moment now
Weekly trading plan for SolanaLast week, the downtrend continued, but after the weekend, the price staged a fast recovery. Right now, it’s trading above the weekly pivot point but hasn’t managed to break the descending trendline yet. We might see a short pullback before another push higher toward the weekly targets and the monthly pivot. However, if negative news hits or the price shows weakness after breaking the weekly pivot, we could get another leg down toward the 3rd monthly target
Write a comment with your coins & hit the like button and I will make an analysis for you
The author's opinion may differ from yours,
Consider your risks.
Wish you successful trades ! mura

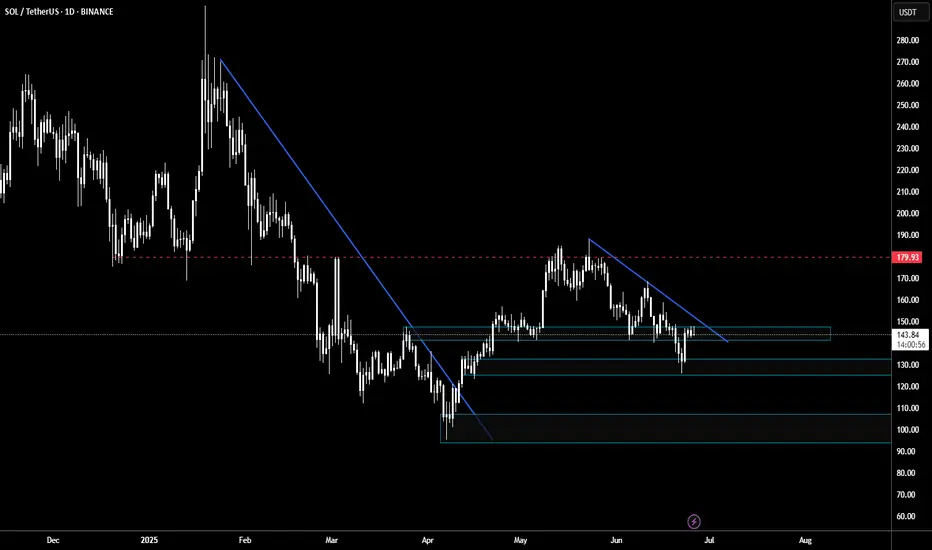
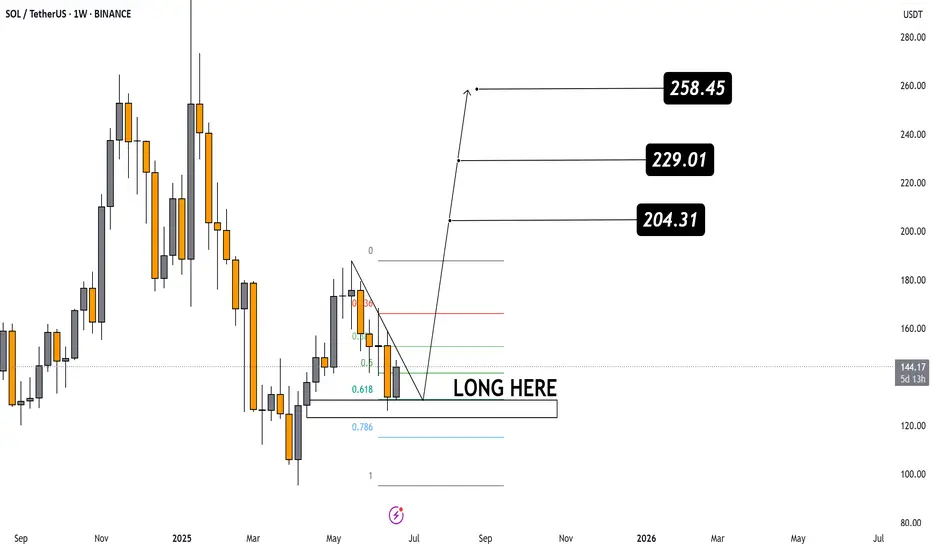
Technical Analysis of SOL/USDT (Weekly Chart)
The chart shows a Falling Wedge pattern – a typically bullish reversal formation.
A breakout to the upside from the wedge has occurred, signaling the potential start of an upward trend.
📉 Entry Zone (LONG HERE):
Clearly marked around the Fibonacci support levels:
0.618 (~130 USDT)
0.786 (~115 USDT)
This support zone is strong and ideal for long positions.
📊 Fibonacci Retracement Levels:
0.382 – First resistance
0.5 – Mid-level resistance
0.618 – Strong retracement support that price bounced from
🎯 Target Projections:
204.31 USDT – First target; a strong historical resistance.
229.01 USDT – Second target; a breakout above this would confirm bullish strength.
258.45 USDT – Final target if the bullish momentum continues.
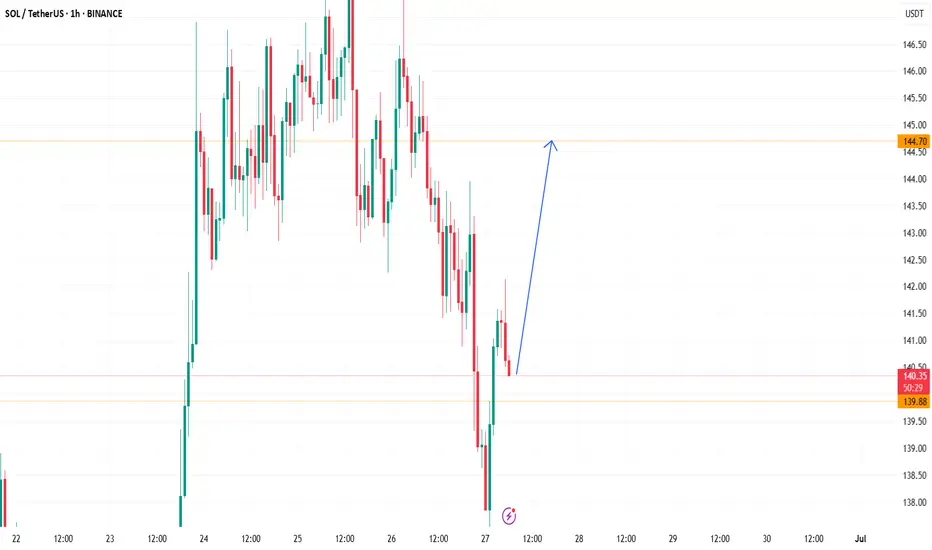
#Sol ShortBias: Leaning bullish short-term (1–3 days), backed by momentum and price structure.
Caution: Funding remains slightly negative—and RSI is near overbought, so a minor consolidation is possible before another leg up.
Trade ideas:
Aggressive: Long near $142–144 with stop below $140, target $150+.
Conservative: Wait for confirmed breakout above $146 before entering long.
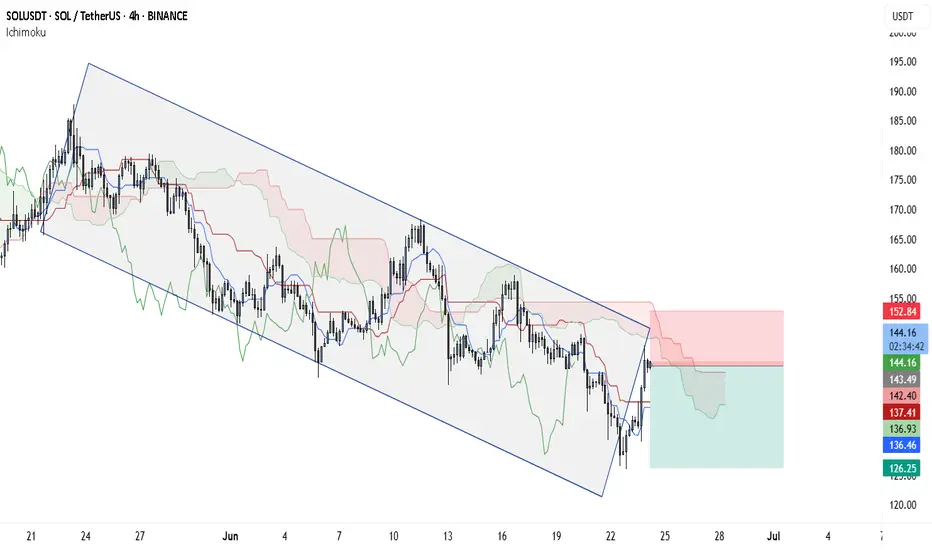
Bearish Breakdown Alert: SOL Eyes $136.46 — Is $126.25 Next?The current SOLUSDT 4-hour chart reflects a strong bearish trend structure, supported by the price consistently respecting a descending channel. This channel has been intact for several weeks, and recent price action shows Solana approaching the upper boundary of this channel once again. Historically, this has acted as a sell zone, and unless there is a confirmed breakout, it remains a high-probability short setup.
Adding to the bearish sentiment is the Ichimoku Cloud. Price is currently trading beneath the cloud, and the cloud itself is shaded red and expanding, signaling ongoing bearish pressure. The Tenkan-sen (conversion line) has just crossed slightly above the price, but the Kijun-sen (base line) sits just above current levels, offering resistance. Most importantly, the Chikou Span (lagging line) is still below both the price and the cloud, which reinforces the idea that momentum remains on the downside.
Within this structure, a clean trade setup emerges:
• Entry: Around $143.87 (Kijun-sen + upper channel area)
• Stop Loss: $152.84 (above the cloud + upper trendline)
• Take Profit 1: $136.46 (mid-channel + local support)
• Take Profit 2: $126.25 (channel bottom)
Given the overall confluence of the bearish channel and Ichimoku resistance, any rejection from the $143–$144 area would support continuation toward the lower bounds of the trend. As always, watch for a strong bearish candle or wick rejection before entering to improve timing.