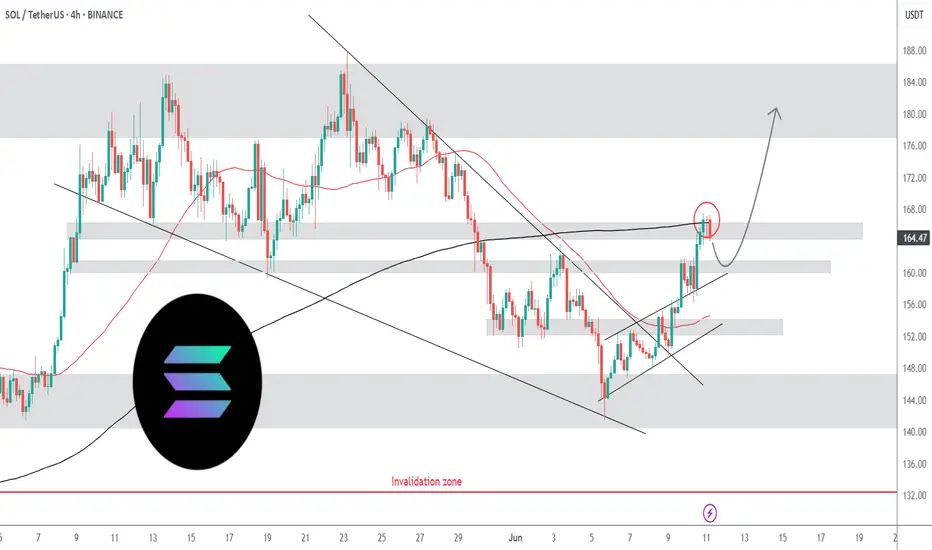
SOLUSDT | The Final Liquidity Hunt | $250 is the Next StopSOLUSDT is currently in an uptrend after recently breaking out of its extended downtrend to $95 which took out millions of long positions. Now, we are seeing yet another extended downtrend on the lower time frame, but the overall direction is still up.
Last week, price action printed two very bullish pinbars at the $155 level which could have been considered support, where price was consolidating around late April. High leverage traders entered here and eventually got liquidated last Friday.
Following the liquidity hunt, price reversed quickly, but not strong enough to reclaim the $155 zone. Many of those who were liquidated likely re-entered on this fast move, thinking that the liquidity hunt is over and price cannot move lower.
I am anticipating one FINAL move down to $140 before the uptrend resumes. This will be the move that takes out the dumb money and where smart money will take their positions. The alternative is that the liquidity hunt never happens, and price breaks out of the falling wedge to resume its uptrend.
What about macro and micro factors?
⚖️ Ripple vs SEC Case
On 8th May, both parties agreed to settle, which ignited a massive market-wide rally. Unfortunately, their filings were rejected due to a procedural issue. The next deadline for refiling is on 16th June. Once accepted, we can expect another massive rally.
🤝 US-China Trade Talks
This week, US and China will meet at the negotiation table again. On 12th May, US & China reached a deal in Geneva and sent markets on another rally. IF (big if) they come to another deal this time, we can expect another rally.
✂️ Fed Rate Cut Expectations
The Fed talked about cutting interest rates in late 2025. They are currently in a "wait and see" stance however, due to uncertainties. Eventually we will see a rate cut, and I believe this would be a "buy the rumor, sell the news" event. Markets will price in the anticipated rate cut before it happens later this year.
Our first price target is $250.
SOLUST trade ideas
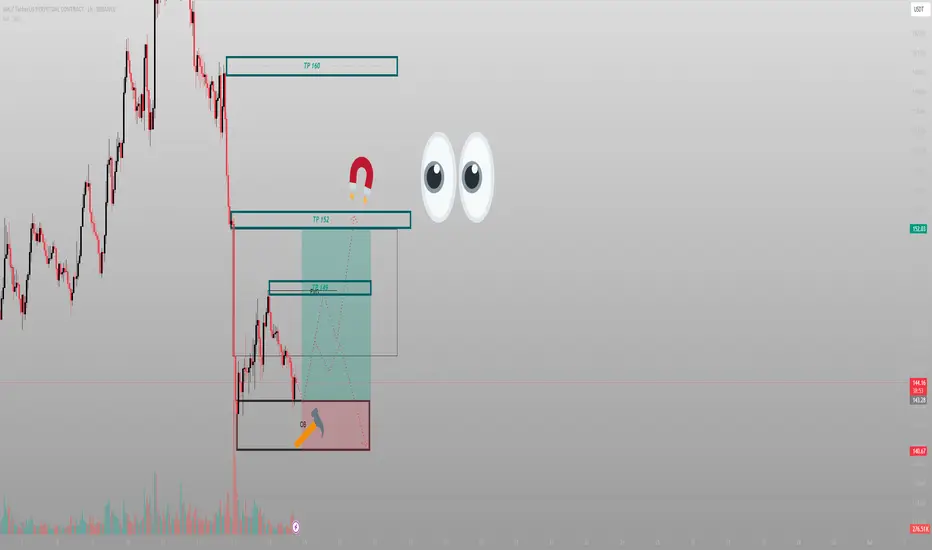
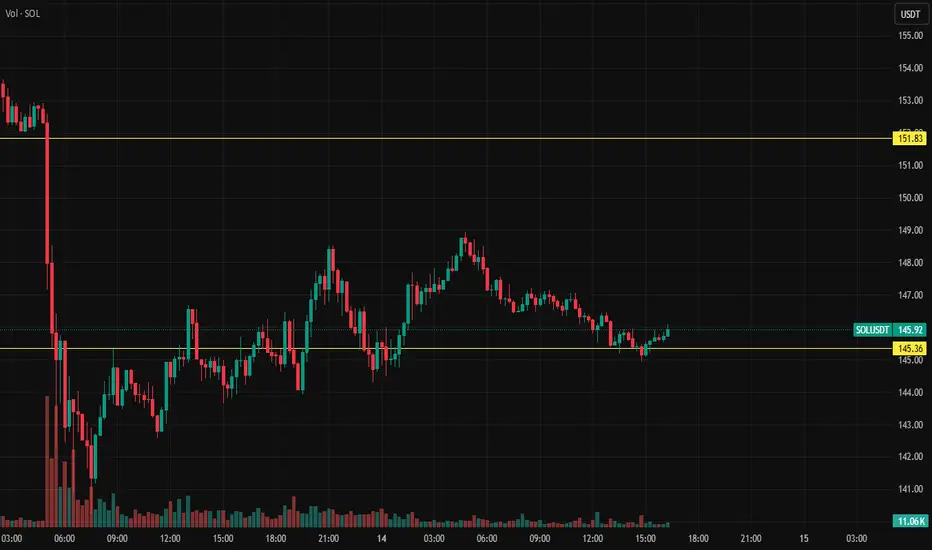
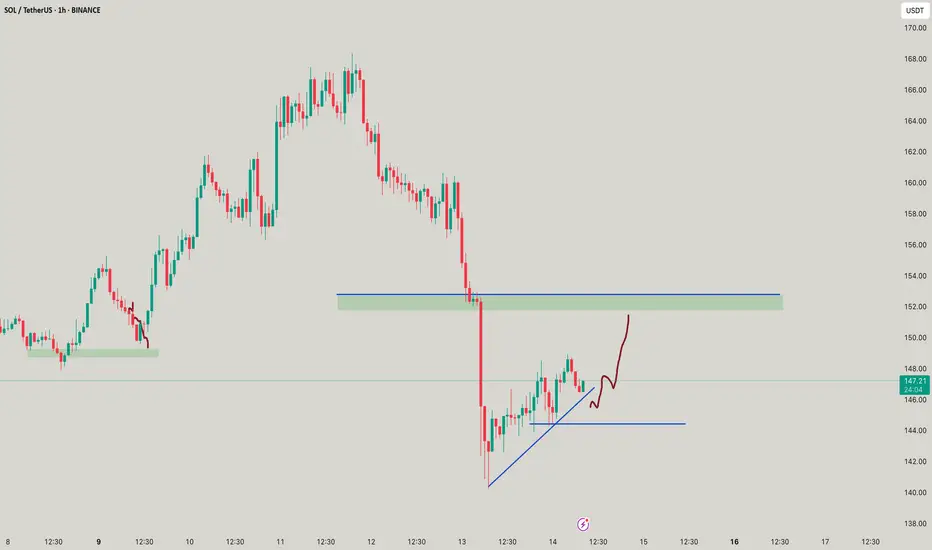
They saw a crash. I saw where the next rally beginsThis isn’t chaos. It’s sequence. SOL sold off into a well-defined 1H OB, paired with a high-volume low. Price didn’t break. It anchored.
The setup:
After an aggressive dump, price settled into an Order Block between 140–143. This isn’t weakness. It’s rebalancing. Right above? A perfect FVG at 149 and inefficiency zones that align with liquidity draws at 152 and 160.
Volume is telling — it spiked into the OB, not on exit. That’s how Smart Money positions.
Expectation:
Accumulation near the OB → quick reversal → reclaim 145
From there, watch price reprice through:
TP1: 149 (FVG reclaim)
TP2: 152 (full inefficiency fill)
TP3: 160 (external liquidity sweep)
Any deeper dip below 140 becomes a deviation — not a breakdown — unless structure is violated with follow-through.
Execution:
Entry: 141–143 zone
SL: Below 139.8
TP1: 149
TP2: 152
Final: 160
This is engineered — not emotional.
Final thought:
“You don’t need to predict the bottom. You just need to know where price is built to return.”
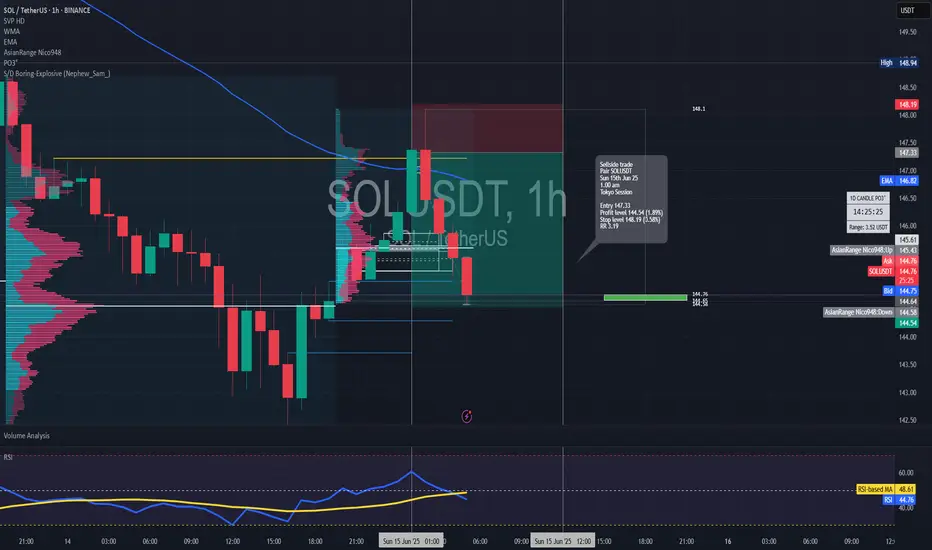
Short trade
Pair: SOLUSDT
Trade Type: Sell-side trade
Date: Sunday, 15th June 2025
Time: 1:00 AM
Session: Tokyo Session
Entry Timeframe: 15min TF
📍 Trade Details
Entry Price: 147.33
Profit Level: 144.54 (1.89%)
Stop Level: 148.19 (0.58%)
Risk-to-Reward Ratio (RR): 3.19
🧠 Context / Trade Notes
Trade executed during the Tokyo session, known for lower liquidity and often used to fade exaggerated price moves from the prior sessions. Price tapped into a minor supply zone formed during the late NY session, showing early signs of sell-side intent.
1Hr TF Overview
#SOL/USDT#SOL
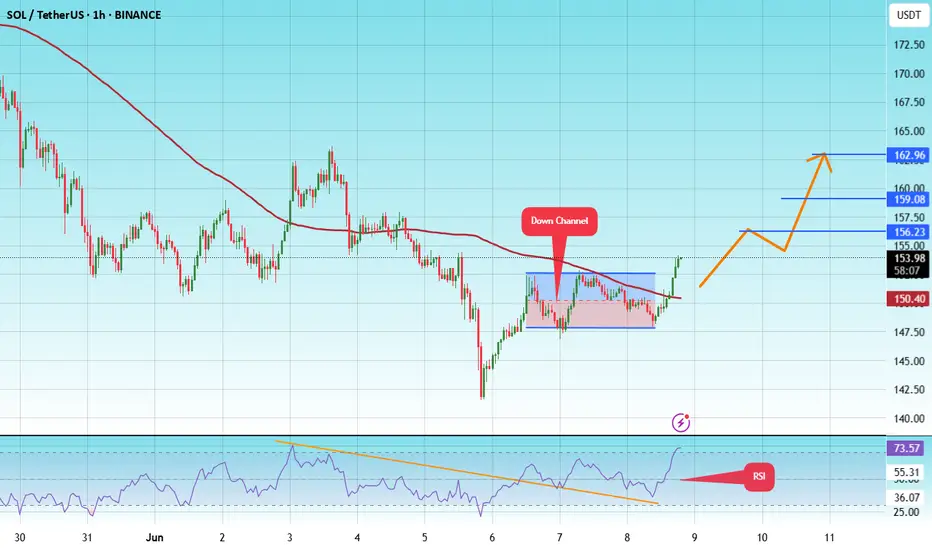
The price is moving within a descending channel on the 1-hour frame and is expected to break and continue upward.
We have a trend to stabilize above the 100 moving average once again.
We have a downtrend on the RSI indicator that supports the upward move by breaking it upward.
We have a support area at the lower limit of the channel at 148, acting as strong support from which the price can rebound.
Entry price: 153
First target: 156
Second target: 159
Third target: 162
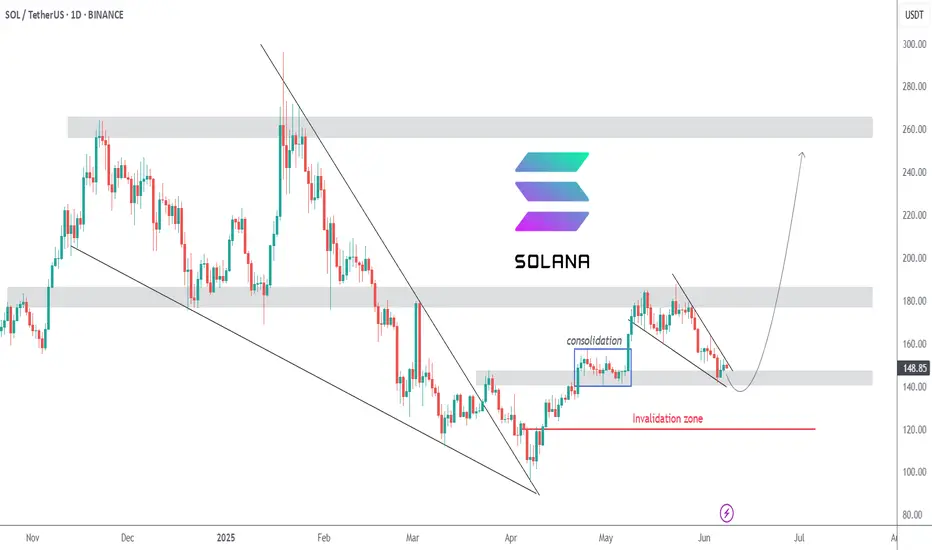
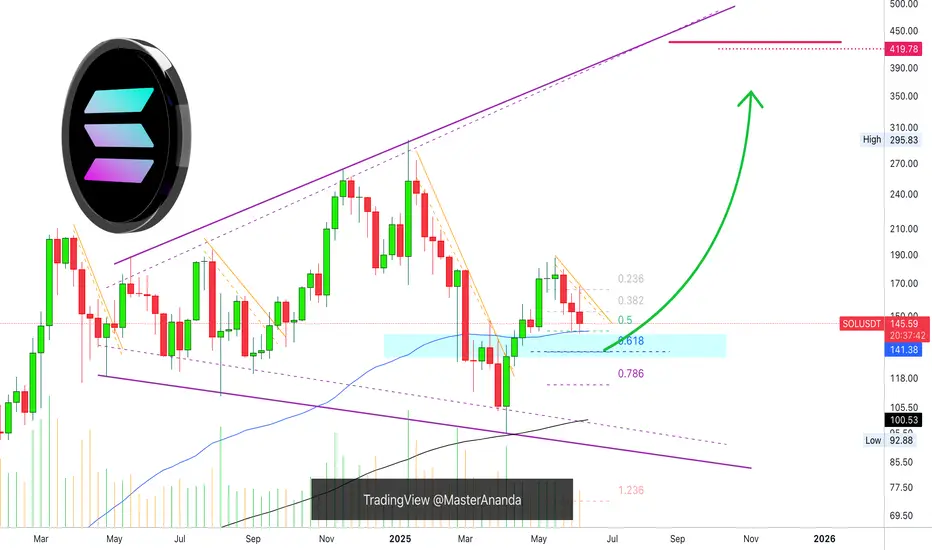
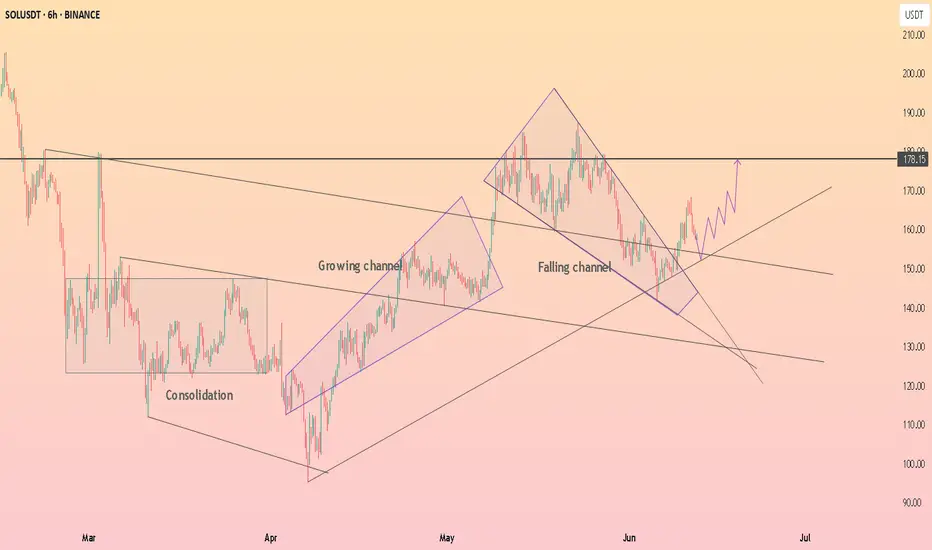
Solana Weekly TF, Good NewsI've gone deeper into Solana's chart and I have good news... You are looking at the weekly timeframe.
I looked at EMA34 and MA200 for some of the major Crypto projects, Bitcoin, Dogecoin, XRP, Cardano and Ethereum. You can find these in my profile @MasterAnanda.
Some were clearly bullish as the action was happening above both moving averages, others were mixed and one was bearish.
Solana is trading below EMA34 weekly but safely above MA200.
MA200 weekly sits at $100 for SOLUSDT.
There is another level of relevance, EMA89. On this chart shown as a blue line and this is the good news. EMA89 is working as support, it worked last week and this week it still holds. This same level matches perfectly the 0.5 Fib. retracement support relative to the move from 7-April to 19-May.
This is all to say that we are looking at a strong support zone, which means that it is likely to hold. If it breaks, it should be brief followed by a recovery right away.
Namaste.
Solana breakout incomingSol preparing for massive big move, war kinda be monitored, and markets dont care anymore. send it
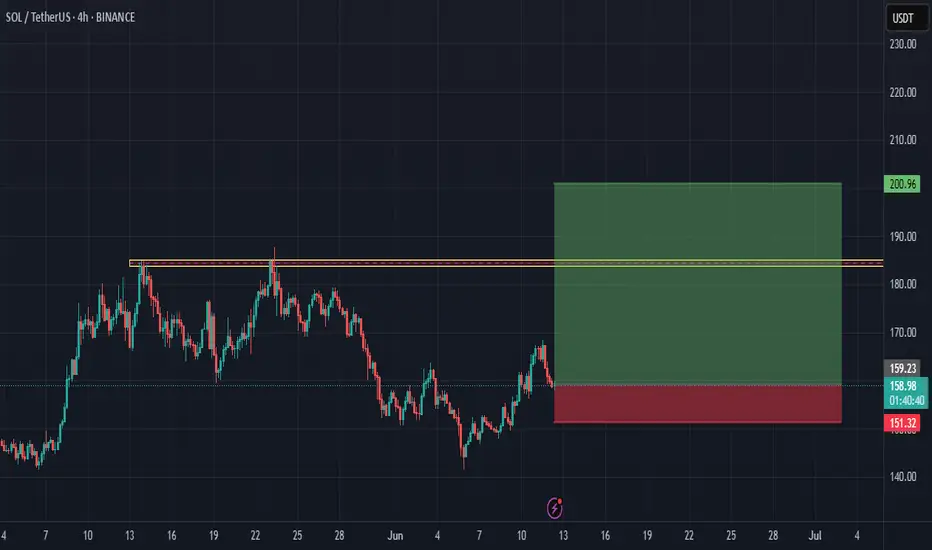
SOLUSDT H4 12th Juneresistance specified which is touched two times. I think that the resistance would break and SOL hit 200$
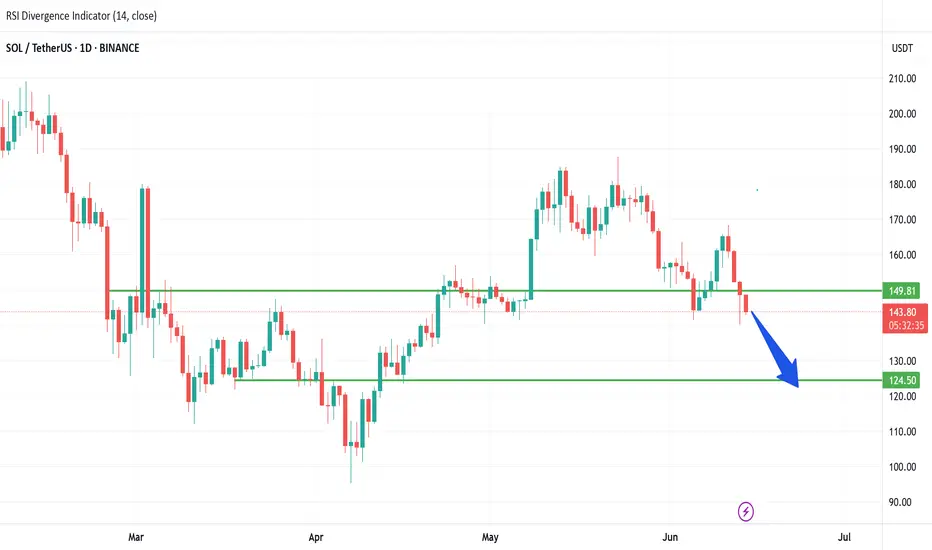
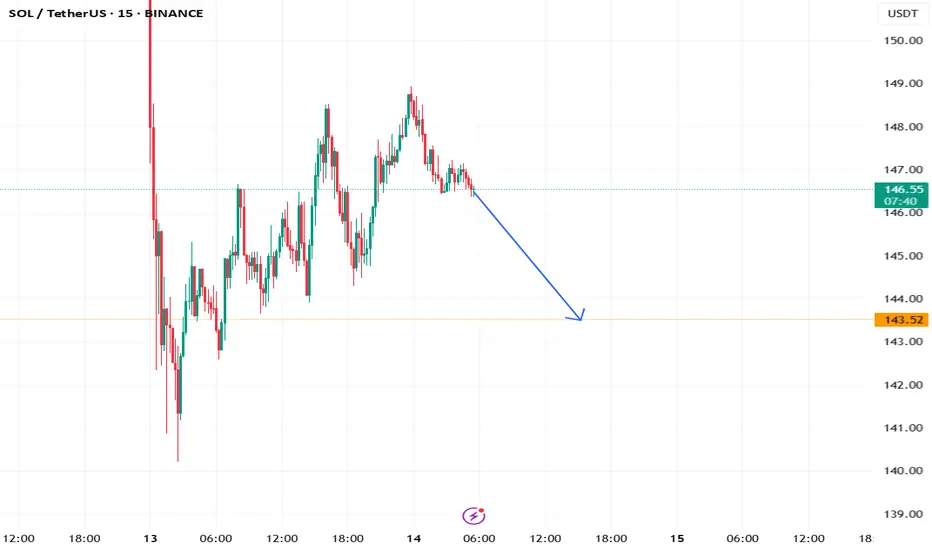
War Shakes Markets: SOL Dips Below Key Support — What’s Next?Solana (SOL) bulls are sweating. After a rough 3% daily drop, SOL has decisively broken below the critical $149–$150 support zone, with price currently hovering around $144. A powerful rejection from the $160 level last week now appears to be more than just a dip—it’s starting to resemble a trend reversal.
But that’s not all. There’s a geopolitical tremor behind the technicals.
Macro Heat: Israel–Iran Conflict Sends Shockwaves
Global markets are rattled after Israel’s latest strike on Iranian military facilities, prompting a missile-heavy retaliation from Tehran. As investors flee risk assets, the “war premium” is being priced into everything—from oil and gold to crypto.
This risk-off sentiment is putting extra pressure on altcoins like SOL, especially those already at key technical inflection points.
The Chart in Focus
Here’s the real-time breakdown:
Price Action: SOL has closed below the $149.81 support (a previous consolidation base). That zone is now likely to flip into resistance.
Volume: 24H volume remains elevated (273M+), suggesting sellers are still active—not just a low-liquidity dip.
RSI: The RSI is sitting at 37.99, creeping toward oversold territory but not there yet—leaving room for further downside.
Next Target: If momentum continues, all eyes are on the $124.50 level — a well-tested demand zone and potential bounce point.
The blue arrow on the chart isn’t just aesthetic—it’s a warning.
What to Watch Next
A daily close below $142 would solidify the breakdown and make a drop to the $124–$125 range highly probable.
However, if SOL reclaims $149 with strong volume, it could trap bears and launch a relief rally.
Keep an eye on macro headlines. If the Israel–Iran conflict escalates, expect more risk-off moves across the cryptocurrency market. Solana, like most altcoins, doesn't thrive in global uncertainty.
Conclusion:
The break below $149 isn’t just technical—it’s emotional. As fear grips markets globally, SOL is caught in the crossfire. Risk management matters now more than ever.
SOLANA SOLANA weekly chart shows lack of interest on the crypto project, with price resting on weekly demand floor awaiting a clear directional bias. If they break and close off that level then solusdt will be trading below 100$ and it will call for bearish reinforcement attracting quick take profit booking from bears.
place your buy order on demand floor @59.59-61
Risk management is key and critical for long term traders
GOODLUCK ON FREE CHART IDEA

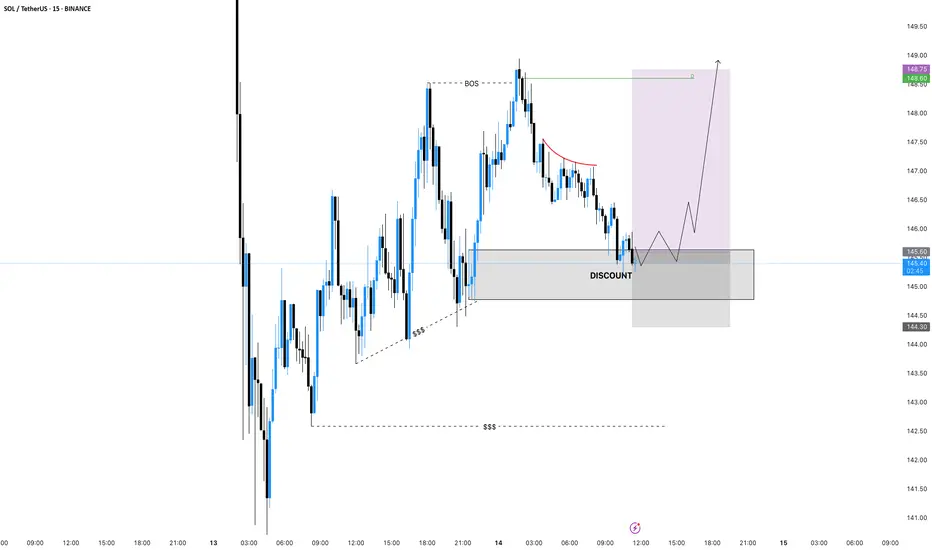
SOL ( Probably)SOLUSDT
The structure gave BOS up. Now the price has returned to the discount zone, from where we can see the reaction.
If we work out the demand zone and break the local structure on M15, I'll go long.
The goal is to update the high.
We are watching.
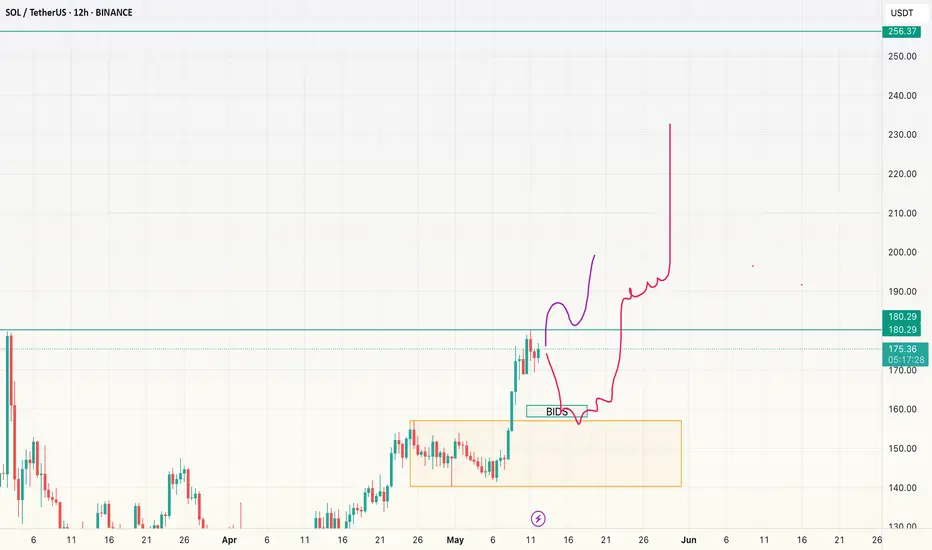
SOL-Long planCurrently at S/R ~180. Either we break past today or post-CPI or we get a little whipsaw around CPI for which setting bids at 12H OB marked (yellow box) is a good idea. Either way, midterm target remains at $256, hopefully sometime in June.
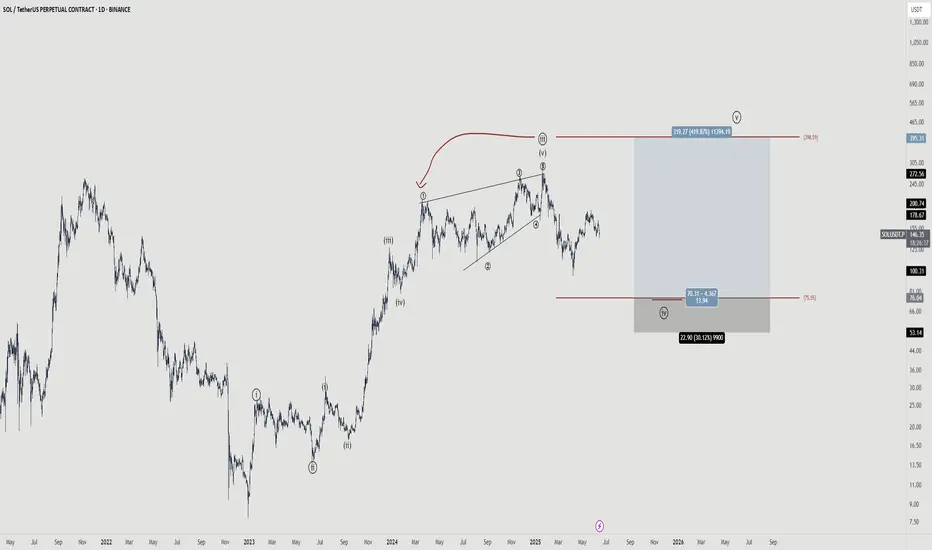
Solana - Your chance to be a millionaireThere is a 50/50 chance that we have topped...
The wave structure is very indicative of a completed impulse. However, i'm betting that we are just in a complex wave 4 and if this is the case, we should see a wave 5 taking out the high.
The risk to reward is pretty nice and playing spot will pay off.
SoL for SOUL - A small scalp!!Scalps are always the best to take easy money, as precendted this is the thing to lookout for!
Solana bottom and mid range pullback before new highs?SPX likely to go for new highs, BTC and crypto will follow, Solana is ready to outperform

sol easy tradeThe targets are clear in the picture and I think they will be touched soon due to buyer pressure. Follow for more analysis.
SOL (Weekly timeframe): Trend structure Price is approaching a key macro support zone. However, as long as it remains below the $148 level, I cannot rule out the possibility of one more corrective leg toward the $76–$55 range before a medium-term bottom is established and a potential resumption of the broader uptrend begins.
A breakout and sustained close above the $148 level would serve as the first technical signal that either:
- a corrective wave B (preceding a deeper correction toward the macro support zone) is unfolding, or
- a new long-term bullish trend aiming for all-time highs is beginning.
Monthly outlook:
My previous idea from November 2024 has fully realized its structure:
Thanks for reading and wishing you successful trading and investing decision!

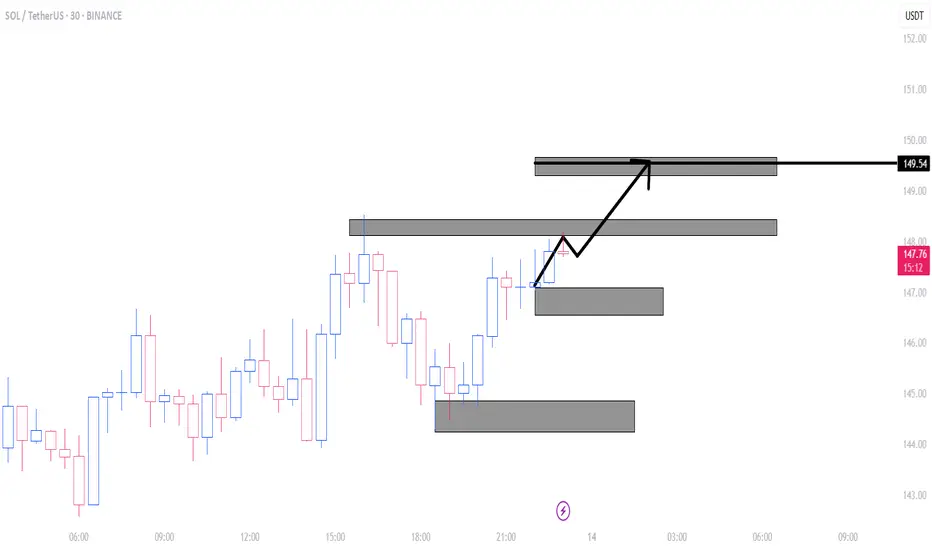
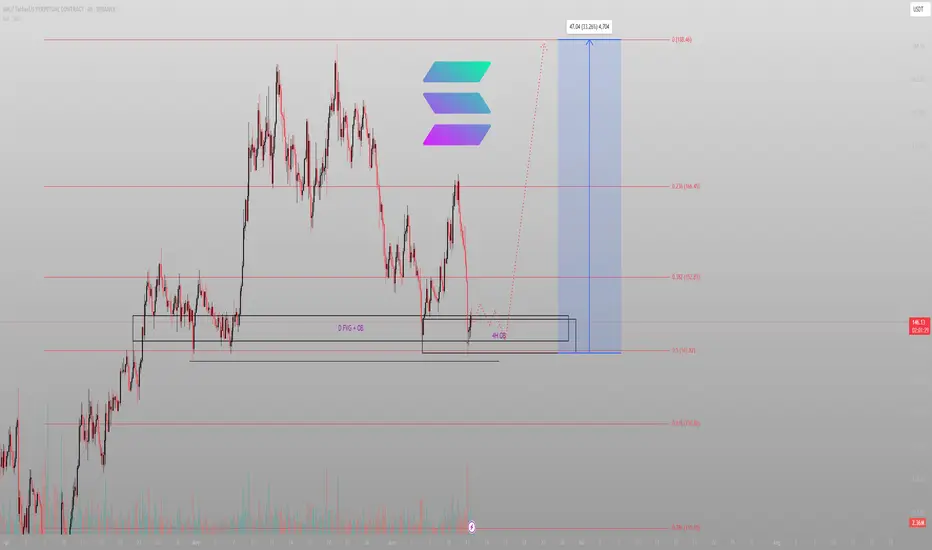
Price returned. I was already waitingThis wasn’t a pullback — it was a reset. And Smart Money doesn’t chase price. It sets traps. This is one of them.
Breakdown:
SOL delivered into a confluence zone where multiple models align:
Daily FVG overlaps perfectly with a 4H Order Block
0.5 fib retracement (141.82) tagging the midpoint of the prior expansion leg
Volatility spike? Engineered. Not reactive.
Retail is shaken. I’m composed. This is the zone you mark before price even gets there — because when it does, you don’t hesitate.
Trade logic:
Entry: 141.8–146.0 (inside D FVG + 4H OB)
SL: Below the 0.618 fib / 130.8 invalidation
TP1: 152.8 (0.382)
TP2: 166.4 (0.236)
Final draw: 188.4 — full inefficiency fill and premium rebalance
This isn’t about hitting every level. It’s about understanding why these levels matter. Structure tells the story. The fib just refines the sentence.
Final words:
“Smart Money doesn’t trade the reaction. It trades the setup that creates it.”
HolderStat┆SOLUSD exit from the formationBINANCE:SOLUSDT
→ Bounce off 150 trend-line fuels channel grind
↳ Reclaim 163–165 then pierce 180 cup-rim
⇢ Targets 190–195 upper rail, even 205+
⤴ Slip < 157 reroutes to 150 demand, < 148 turns bearish
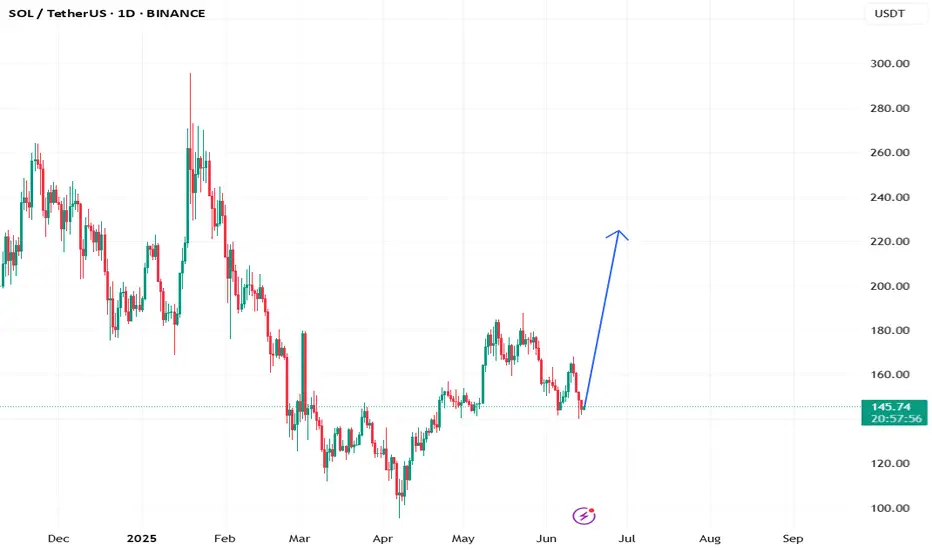
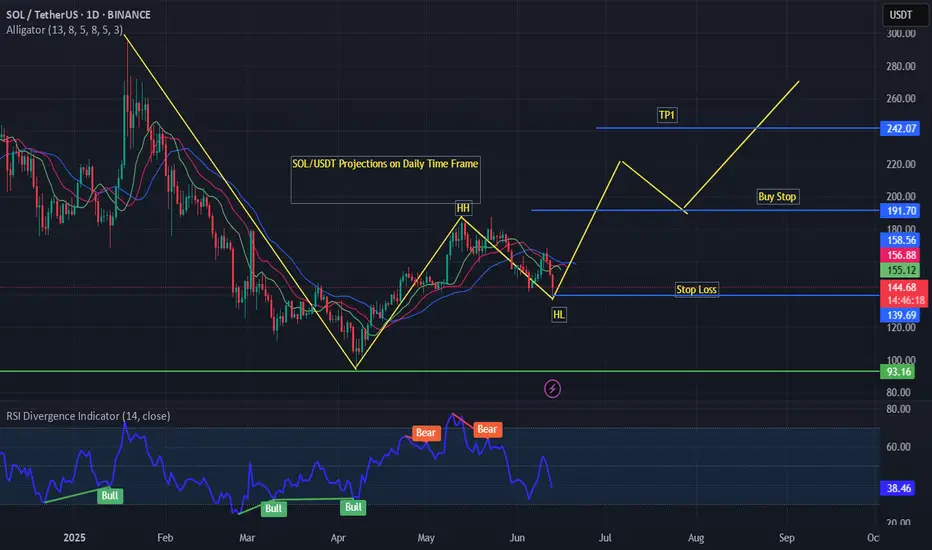
SOL/USDT (Daily Chart), ProjectionsTechnical Analysis – SOL/USDT (Daily Chart)
Projection Pattern: Higher Highs (HH) and Higher Lows (HL)
Indicators: RSI Divergence, Alligator, Support/Resistance Levels
Solana (SOL) is currently in the early phase of a bullish structure, characterized by a Higher High (HH) and Higher Low (HL) sequence. This indicates a potential trend reversal from the previous bearish cycle to a bullish trend.
Key Observations:
HH-HL Structure:
The market printed a Higher High followed by a Higher Low, indicating buyers are gradually gaining control. The current price action suggests a probable continuation to the upside if the next impulse breaks above recent highs.
Buy Stop:
A breakout trade is anticipated if SOL breaks above the Buy Stop level (approximately $156–158), aligned with Alligator indicator resistance and horizontal resistance.
Stop Loss:
Positioned just below the HL zone near $144, offering protection if the bullish breakout fails.
Take Profit (TP1):
The first target is projected near $187.71, which aligns with a historical resistance zone and the next significant swing high.
Indicators:
RSI (Relative Strength Index):
The RSI is currently at 38.05, recovering from a previously oversold region. There are several bullish divergences marked earlier in the year, which preceded major upswings. The latest bullish setup may follow suit if the RSI continues upward.
Alligator Indicator:
The Alligator lines are converging, suggesting a potential breakout phase as market momentum consolidates. A clear expansion of the green (lips), red (teeth), and blue (jaw) lines will confirm trend direction.
Conclusion:
The chart sets up a bullish continuation scenario, contingent on a breakout above the buy stop zone (~$158). If confirmed, the price may rally toward the $187 level. However, a close below $144 would invalidate this setup, suggesting a reevaluation of market sentiment.
$sol long 🧠 Trade Thesis
SOL has pulled back into a key demand zone around the $144–$145 range, forming a potential bullish reversal setup after a steep drop. This level coincides with previous structure support and could act as a springboard for a bullish bounce targeting higher resistance levels.
🎯 Trade Setup
Entry: $145.06 (current price)
Stop Loss: $139.21
Take Profit Targets:
TP1: $160.65 (recent structure high)
TP2: $168.22 (local resistance)
TP3: $179.32 (supply zone)

SOLUSDT | Short-Term Target = $185Today, we got reports that the SEC requested SOL ETF issuers to update their filings which ignited the rally past $165. This boosts investor confidence- we should see good bullish volume in the near term, targeting $185.
US-China talks have also came back positive, awaiting both presidents' approval.
The first hurdle, still, is the 200SMA. Ideally, we want to see a bullish close above $168. This should be easily taken this week, if not today. From there, we aim for the near term high of $185 before zooming out to aim for $250.