Another formation of head and shoulderSolano possibly forming a head and shoulder weekly pattern. Watching the support is critical which confirms the head and shoulder pattern and a reversal opportunity to a lower target such as the trendline support or even lower. An invalidation of the left shoulder open opportunity to break out the ATH and target higher. The weekly moving average holding a support at the moment and price didn't dip lower. Keeping major economics in mind the higher highs and expectation of cutting interest rate could invalidate the head and shoulder pattern.
SOLUST trade ideas

my emotion ruin my tradei understand the market after 3 years watching learning thinking i reach a level i could predict the future price in 70 % come true but my emotion destroy every think i analized my fear my greed make my patient low i dont know what should i do ?a lot of adrenalin come to my body fear greed if you see my post please help me to do some thing next post i talk about trend

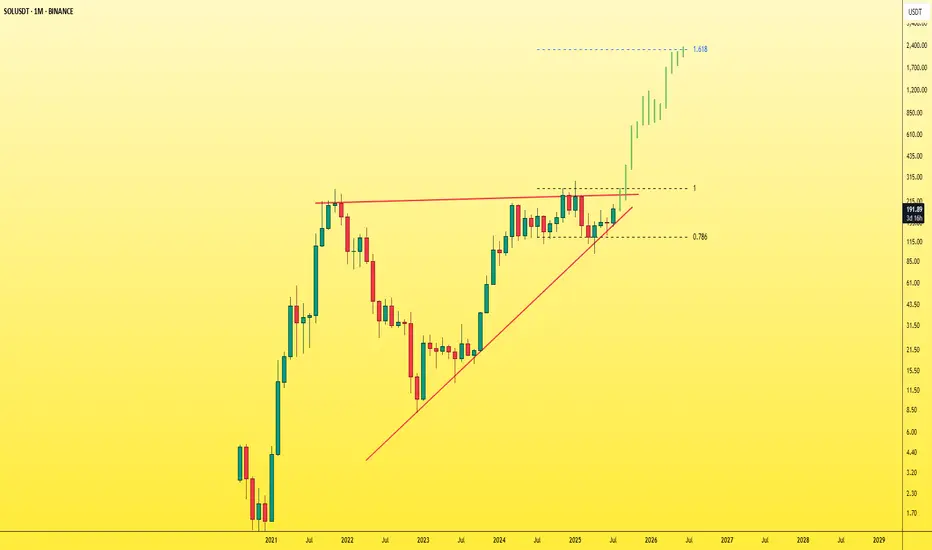
SOL - Don't miss the breakout before it's too late!The symmetrical triangle pattern on the monthly timeframe is showing signs of weakening after multiple failed breakout attempts — and now, a breakout seems highly likely.
Once SOL breaks out of this triangle, it will enter price discovery mode , opening the door to a massive bullish move. At that point, most traders will start saying “it’s too late”, while SOL keeps rallying aggressively — fueled by FOMO and liquidity traps.
You'll see:
- People outside the market waiting for a pullback that never comes.
- Traders inside the move getting shaken out by small dips and volatility.
Right now, SOL is still in a fair trading zone and available at a reasonable price .
Don’t wait for it to explode and then chase. Get in before the breakout .
Best Regards:
Ceciliones🎯
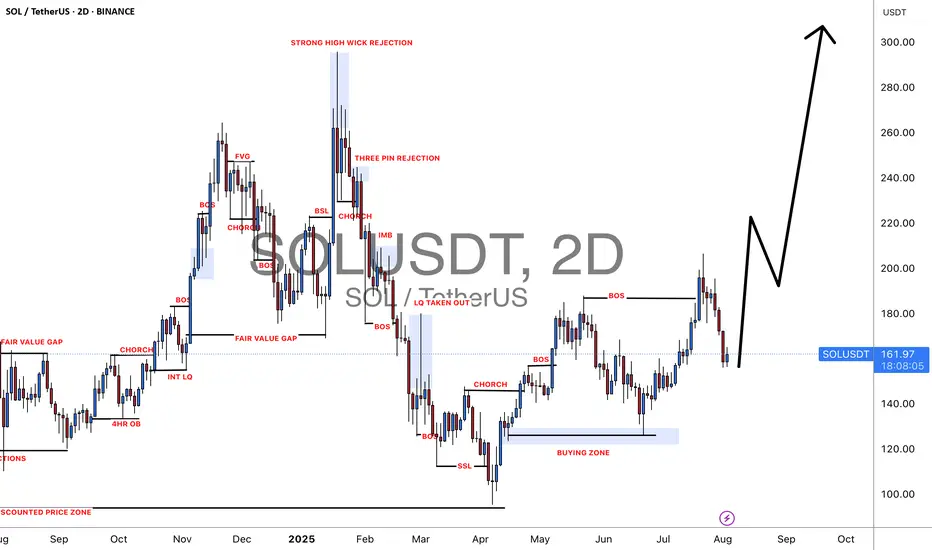
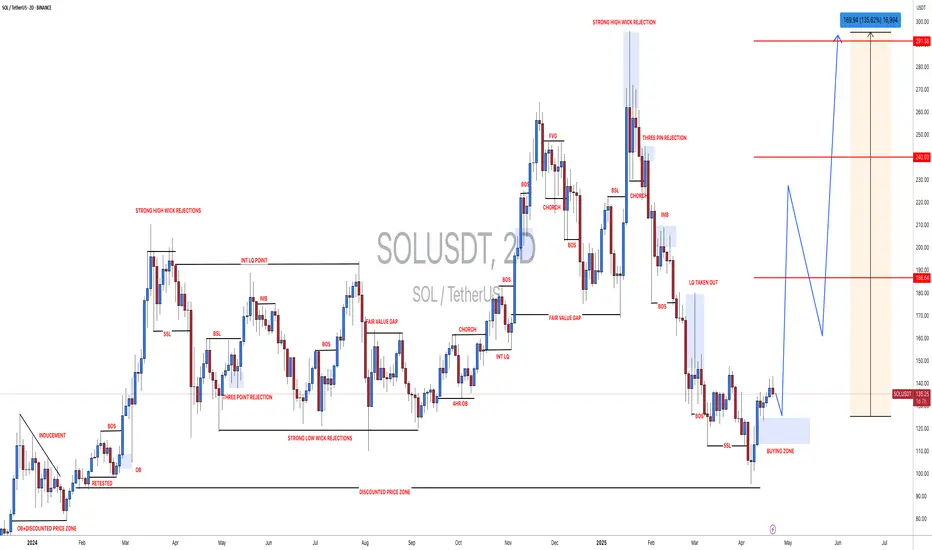
Short-Term "Counter-Short" Position A "counter-short" strategy, Short-Term "Counter-Short" Position
A "counter-short" strategy, also known as counter-trend trading, involves taking a short position against the prevailing short-term trend, anticipating a temporary reversal or correction. This is generally a high-risk, high-reward strategy that requires precise timing and strong risk management.
Long-term long positions on SOL/USDT with a cup and handle pattern aim for substantial gains after a period of consolidation. This strategy relies on identifying a well-formed bullish continuation pattern on higher timeframes, confirmed by volume, to indicate a strong upward trajectory for Solana. till previous ATH
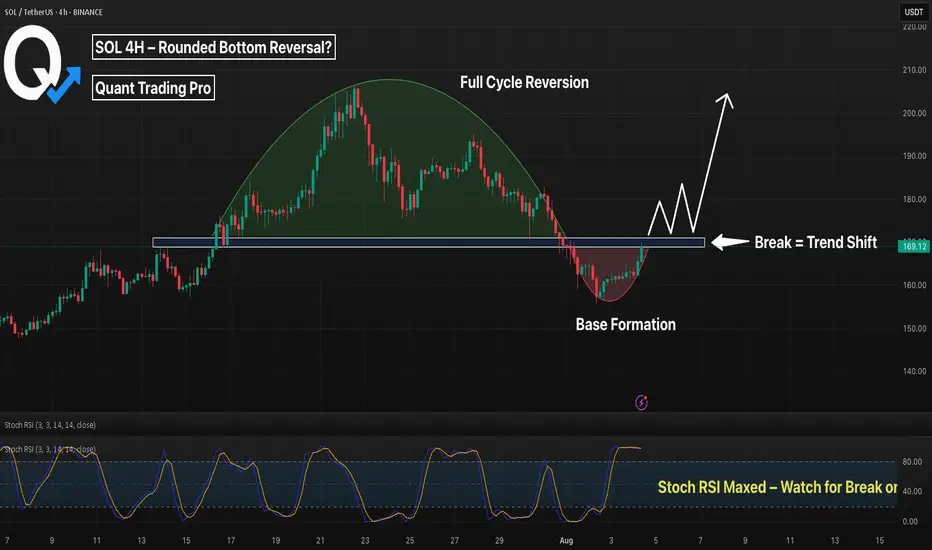
SOL 4H – Rounded Bottom Forming, But Will It Break the Neckline?Solana may be completing a rounded bottom formation on the 4H chart — a classic reversal pattern that often signals a shift from distribution to accumulation. After a deep pullback from July highs, SOL has carved out a smooth base with clear curvature, now pressing into the neckline resistance around $169–$171.
The structure resembles a full cycle: a rounded top leading into a rounded bottom — a potential "cup" formation. With Stochastic RSI pushing into overbought territory, we’re approaching a key decision point.
🔍 Key Factors:
– Rounded bottom structure shows controlled re-accumulation
– Neckline acting as current resistance (watch for breakout)
– Break + retest could trigger the next leg toward $185–$190
– Failure to break may lead to chop or retrace toward $158–$160
This pattern often precedes explosive continuation if volume confirms the breakout.
Will SOL confirm the reversal — or is this just another trap?
👇 Comment your thoughts below.
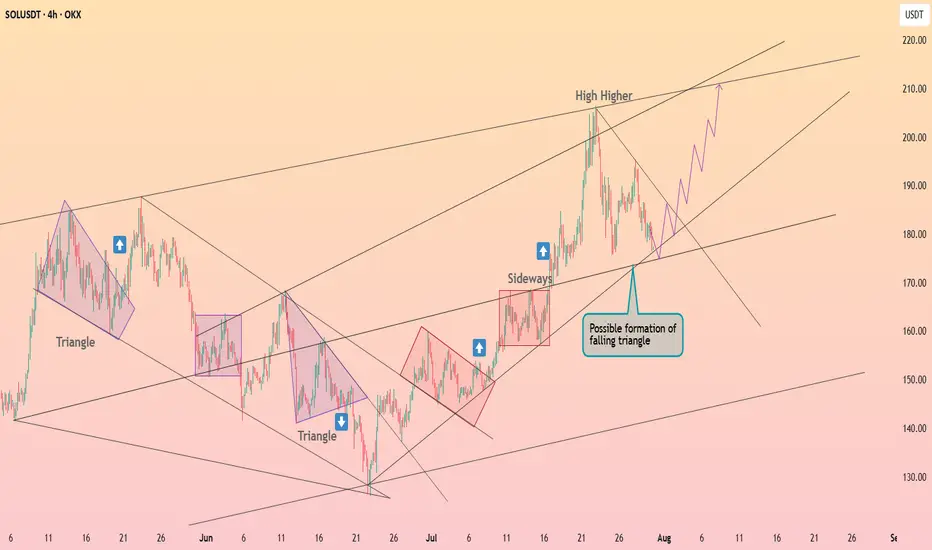
Solana is forming the falling triangle ┆ HolderStatOKX:SOLUSDT is compressing into a possible falling triangle, with support around 180–185 and upward projections pointing toward 210+. The chart has repeatedly shown triangle breakouts into strong rallies. As long as the lower trendline holds, the upside setup remains valid.
SolanaZol usdt daily analysis
Time frame daily
Position long
Target 219$
Risk rewards ratio >4 👌👈
Red box on the cart is the good erea to entrance long position
Orange uptrend line is a very strong support lines
I guess in this turn of upcoming, solana will reach my target

SOL gives a SOUL!SoL just has happened as I told and mentioned earlier, this range looks very lucrative as of now and can turn things in a good manner! Observe where it goes

#SOLUSDT: A Big Move In Making Crypto Market Is BullishCrypto market remain bullish and as for the SOLANA we remain quite optimistic; currently price is trading at critical level and waiting for liquidity to emerge. We need strong volume for big price movement. Follow a strict risk management while trading crypto market.
Good luck and trade safe.
Team Setupsfx
#SOLUSDT: Price to turn extreme bullish! Get ReadyHey there everyone! 👋
I’ve got some updates on the BINANCE:SOLUSDT price. It’s been testing a crucial level, and it’s showing some really strong bullish signs and patterns. But here’s the thing, we’re starting to think there might be a possible reversal coming up in the next few days. If we’re right, the price could hit all three targets we’ve been tracking.
Remember, though, that this is just our analysis, and it’s always a good idea to use accurate risk management when you’re trading.
Thanks for your support! 😊
If you want to help us out, here are a few things you can do:
- Like our ideas
- Comment on our ideas
- Share our ideas
Team Setupsfx_
SOL - YOUR Choice of SOUL! LOLSOL as usual, pretty straight forward, short on the red, buy on the green, lines abbreviated for you to understand where
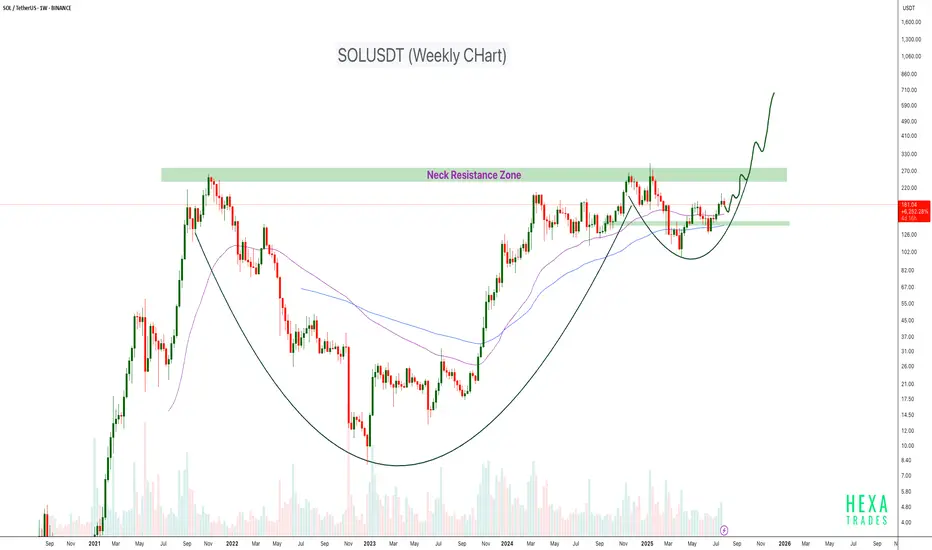
SOLUSDT Cup & Handle Formation CRYPTOCAP:SOL is forming a large Cup and Handle pattern on the weekly timeframe, a classic bullish continuation structure. Price is currently approaching the neckline resistance zone around the $250–$280 level. This area has acted as a major barrier in the past, rejecting the price multiple times, but the structure suggests it's now being retested with greater momentum.
If the neckline breaks cleanly with strong volume, the projected target could push SOL into the $600–$700+ range over the coming months.
Cheers
Hexa
BINANCE:SOLUSDT COINBASE:SOLUSD
due to rsi divergence and fib zone long sol nowdue to rsi divergence and fib zone long sol now
fib golden zone triggered
demand zone triggred
rsi divergence and many other +ve sentiments
so we longged
its infinit market idea may be wrong so use sl 155$
#dyor too, im not financial advisor

Soul for souls Our BTC target was on spot and exceeded our expectations
Alts will follow and now everything looks set and more clear could be the real alt season,
Anyhow my target for soulusdt and I was being conservative I do expect it to go higher but that down to preference
Enjoy

Possible Double bullish flag for #SOLThere is a world where SOL is confirming this double bullish flag setup for New Higher Highs...Let's wait and see. It needs to hold the 179 -178 line and keep and eye on Volume for a healthy push until the next Fibo level around 220.
The only pb is August has always been a bad month for crypto in gnl. Trade carrefully ! Educational content only

SOL LONGFollowing a significant decline, the asset will take support and bounce back from this point.
Disclaimer: This is not financial advice.
This algorithm provides highly precise buy and sell signals with alerts:


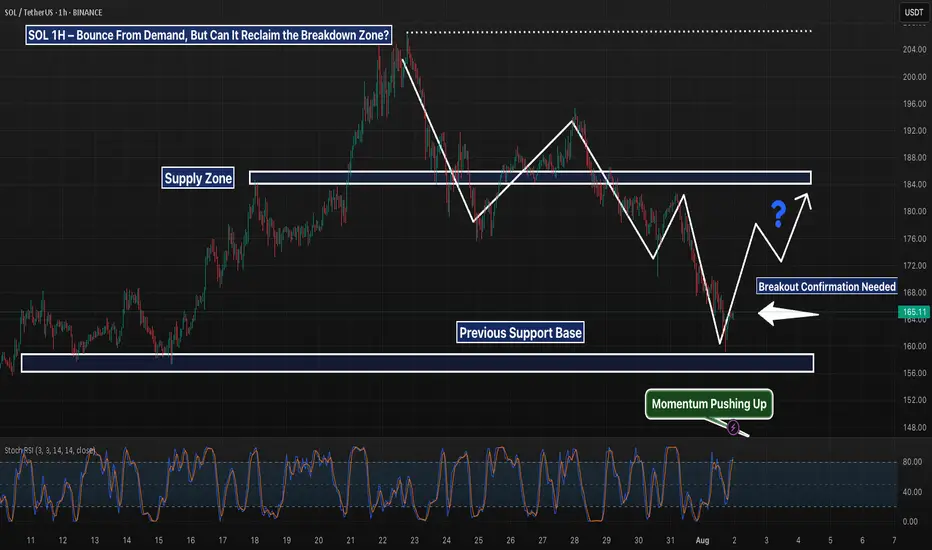
SOL 1H – Bounce From Demand, Can It Reclaim the Breakdown Zone?SOL tapped into the key demand zone near $157 and is now showing signs of a reaction bounce. Price is approaching the former support-turned-resistance zone around $184 — a critical level that marked the start of the previous breakdown.
A reclaim of that zone would suggest bulls are regaining control, opening up room toward the $190–$200 region. Until then, it remains a lower high attempt inside a bearish structure.
📌 Demand bounce
📌 Bearish market structure
📌 Key resistance at ~$184
No confirmed reversal yet — just a bounce until proven otherwise. Keep watching the structure evolve.

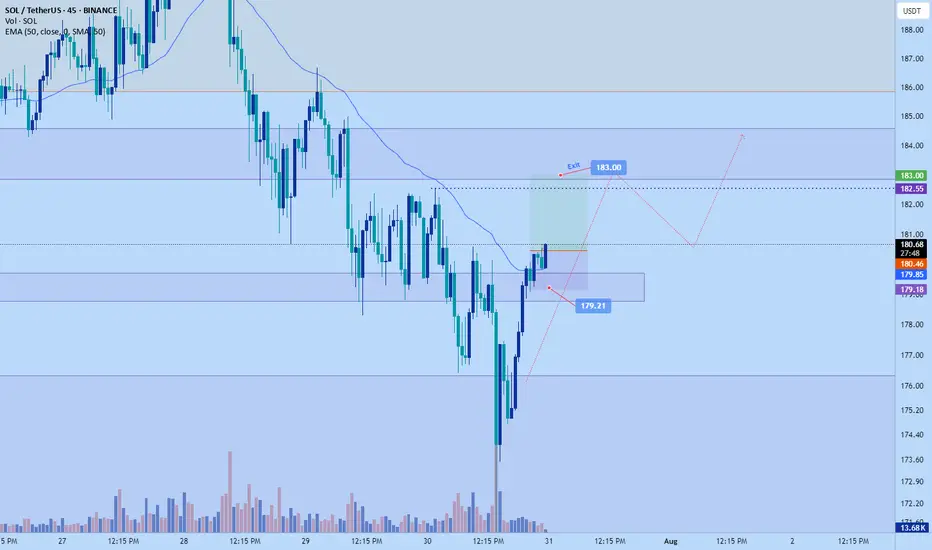
Solana scalp long to $183Just now opened a scalp long position on solana. Bulls are taking back control breaking resistance levels and no clear sign of exhaustion yet.
Sl: $179.21
Tp: $183
Roughly 2 RR
DTT strategy applied. - Direction , target and timing
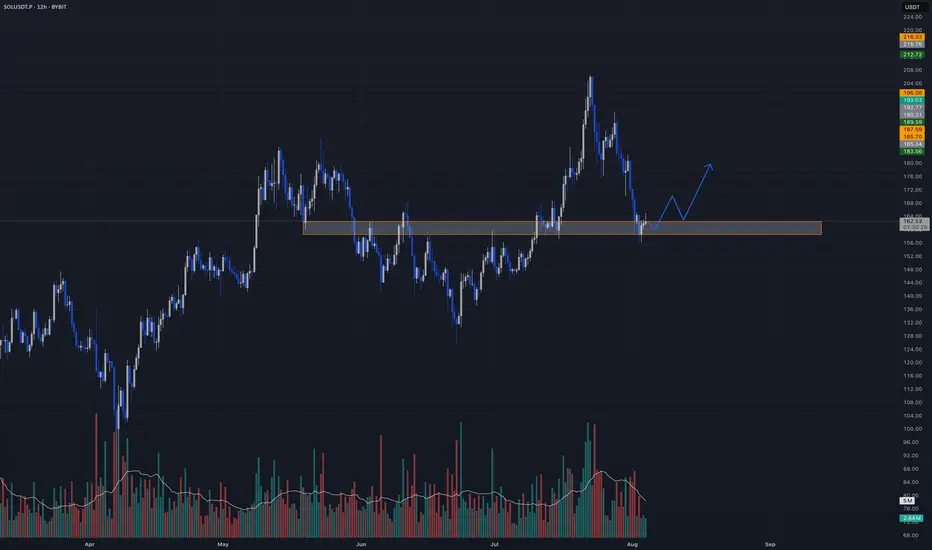
Smart Money Dip Buy Setup🚨 SOLUSDT – Smart Money Dip Buy Setup 🚨
Hey Candle Fam,
Solana just did what it does best — scared retail out of their positions, grabbed liquidity like it was on sale, and now it’s chilling in the weekly demand zone like nothing happened. Classic.
🎯 LONG Setup
Entry: $162.5–$158.5
Stop Loss: $155.0
Targets: $175 / $190 / $210
📊 Strategy: HTF Demand + Liquidity Grab
– Weekly: Still bullish — engulfing setup into strong OB zone ($160–$180)
– Daily: Healthy correction from $205 top; now testing major support
– 1H: Accumulation signs brewing (equal lows + seller fatigue)
– Footprint: Delta flipping, low-volume cluster forming around $160
⚠️ Below $155 = full structure break. No mercy.
This ain’t hopium — it’s planned structure.
Respect the zone. Let them overleverage.
We execute with patience and calm.
Candle Craft | Signal. Structure. Execution.
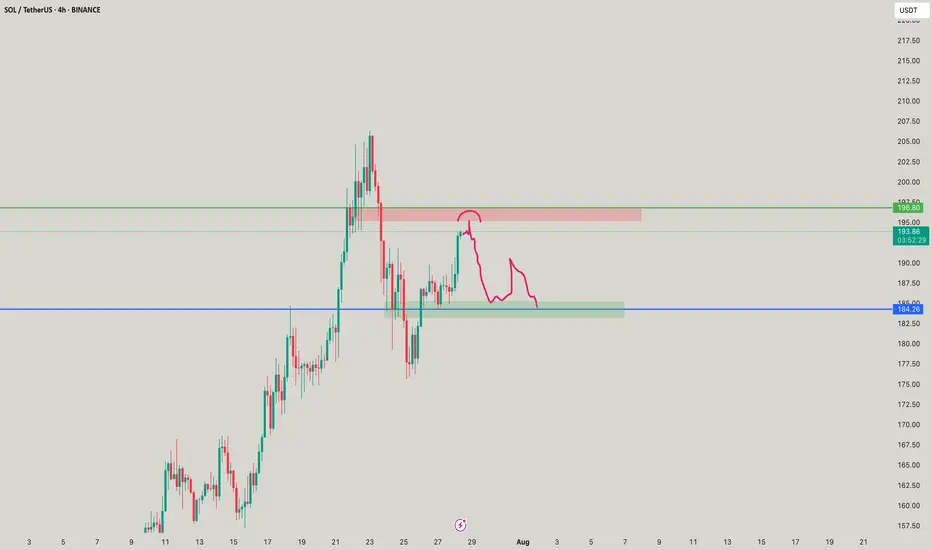
Break down before the run upSo i feel this will go to the 4 hr OB. My reasoning is there's very little buy volume, the OBV is very low even though the price climbed a bit, and the RSI is below 50 still, so still bearish imo. But the market has its own ideas so be wary and watch closely. Make money my friends!
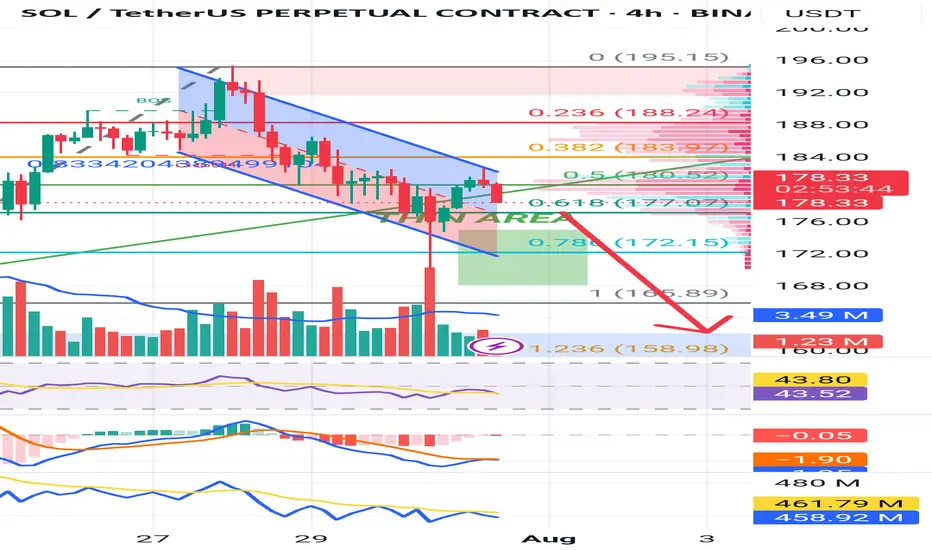
#SOL Update #7 – Aug 02, 2025#SOL Update #7 – Aug 02, 2025
Solana has broken below the low of its last impulsive move, forming a new, deeper bottom. The first area where it may find support is the $158 level. If this fails, the next support level lies at $147. At the moment, Solana is clearly in a downtrend on the 4-hour chart. For Solana to resume its upward movement and confirm a trend reversal, it needs to break above the $206 level with a strong, high-volume candle. Currently, Solana might be considered a cheap opportunity only for those looking to hold spot positions long-term. Otherwise, I don't see it as a suitable option for trading.
