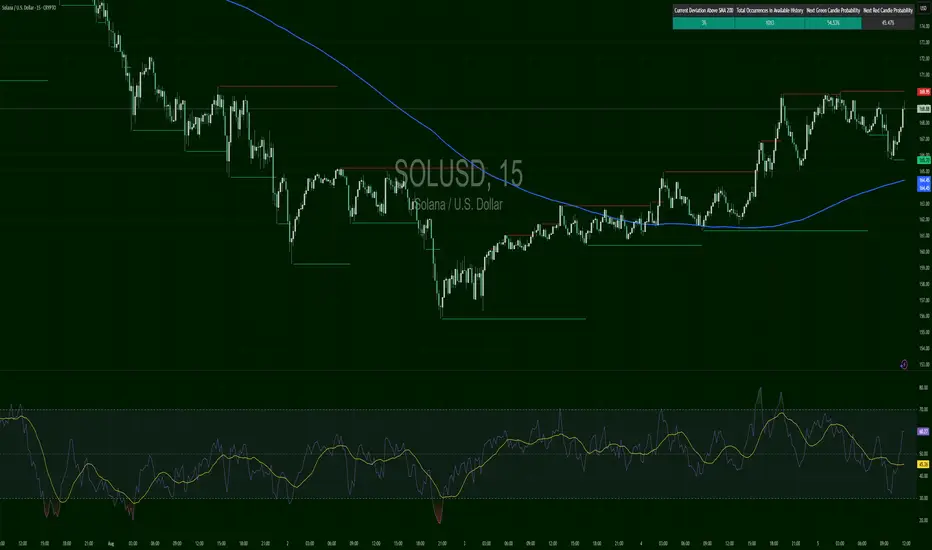
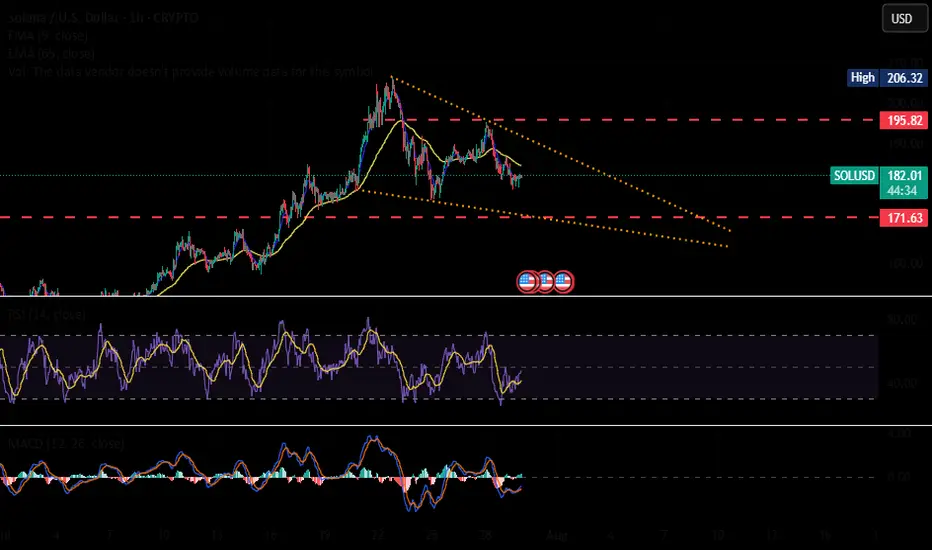
Solana definition of movementSOL is in a squeeze phase: the price is holding above $163, but meets resistance around $183-186. Indicators show neutral, slightly weak momentum. A break above $186 with increasing volumes will open up potential at $190+; a break below $178 will lead to a deeper correction to $171-170. Until then, it is worth watching the 20-d EMA hold and reactions to it.
SOLVVS_80FDCC.USD trade ideas

SOLUSD Sell Limit ordersHi everyone.
I've set 3 orders to go short on Solana.
Please consider That if the second order triggered, Risk free the first order and If the third order triggered so you need to risk free the second order too...
These TP levels are based on Fib Levels. But if you want you can set the first TPs at 1:1RR for each order.
Let's see what happen.
Good luck everyone.

SOLUSD- Has a long-term sport between 155 and 158Technical Analysis by AI
💵 Current Price & Market Context
• SOL trading around $158–$160, down about 2–3% today, still down ~14% from last week’s top near $180+.
🧭 Trend & Momentum
• RSI near 41–47 → not oversold but on the lower side.
• MACD still leaning bearish. Momentum: neutral to slightly bullish across indicators.
🛠️ Support & Resistance
• Immediate support at $160, stronger support at $154.
• Resistance at $172–$176, bigger barrier around $180–$190.
📈 Pattern Behavior
• Still holding an ascending channel, currently sitting near the lower band.
• Failed breakout at $180–$190 means that’s a hard ceiling unless broader market turns bullish.
⸻
✅ Trade Thoughts Based on This
Aspect
Bias Neutral to bearish short-term
Entry Zone Valid? Yes, $156–158 is still solid
Key Level to Watch
$154 — if breaks, downside likely
Upside Potential Target $172–176 short term
Breakout Ceiling $180+ tough without volume/sentiment
⸻
🧭 What You Should Do Now
• You’re in near $156–158 → good spot as long as $154 holds
• If price dips to $154 and bounces: still valid
• If breaks $154: prepare to cut, next support is ~$145
• If price moves above $170: momentum could take it to $176+
• Don’t chase anything. Wait for volume or bounce from support

SOLUSD BUYBUY @156.85
SL @155.55
TP @163.35
If SL hits by a candle sweep and closed above the entry level again buy....
And always risk 1%
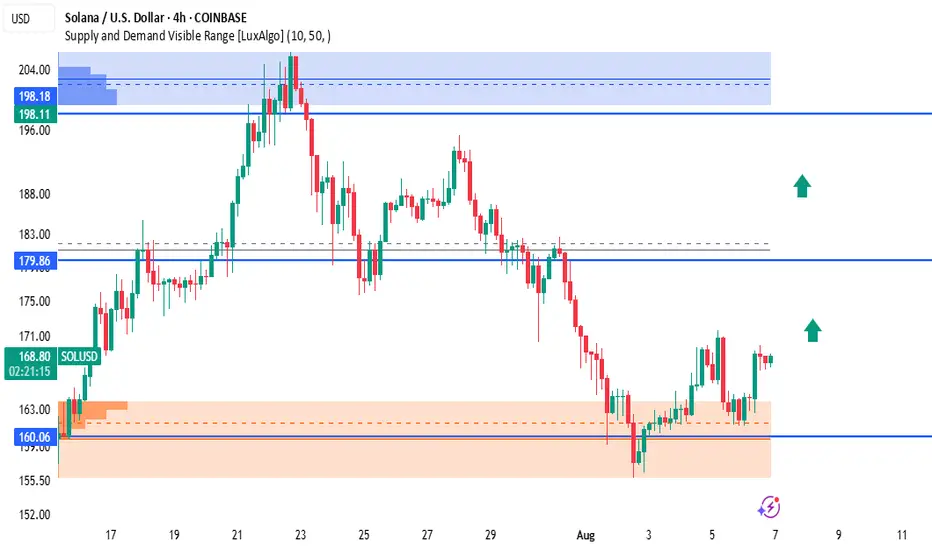
SOLUSD – Demand Zone Reversal in ProgressSolana is showing strong bullish signs after rejecting the demand zone around $160.06, forming a short-term higher low and beginning to climb. The current structure suggests momentum is shifting back to the upside, targeting key resistance levels.
🔹 Key Zones & Levels:
🟠 Demand Zone (Support): $157.00 – $160.06
🔵 Mid Resistance: $179.86 – Prior support turned resistance
🔵 Major Supply Zone: $198.11 – $198.18 (Previous peak area with strong sell pressure)
🟢 Bullish Outlook:
If SOLUSD maintains this upward momentum:
Target 1: $179.86
Target 2: $198.18
Green arrows on the chart highlight the expected bullish path as long as price holds above the demand zone.
📌 Trade Setup (Example):
Long Setup:
Entry: $165 – $169 (current zone)
SL: Below $159
TP1: $179.86
TP2: $198.18
⚠️ Risk Note:
A 4H close below $157 would invalidate this bullish bias.
Wait for strong bullish confirmation like a break and retest above $170 before going heavy.
💬 Follow for more Solana price action updates.
📊 #SOLUSD #Solana #CryptoAnalysis #DemandZone #PriceAction #SmartMoney #TradingView
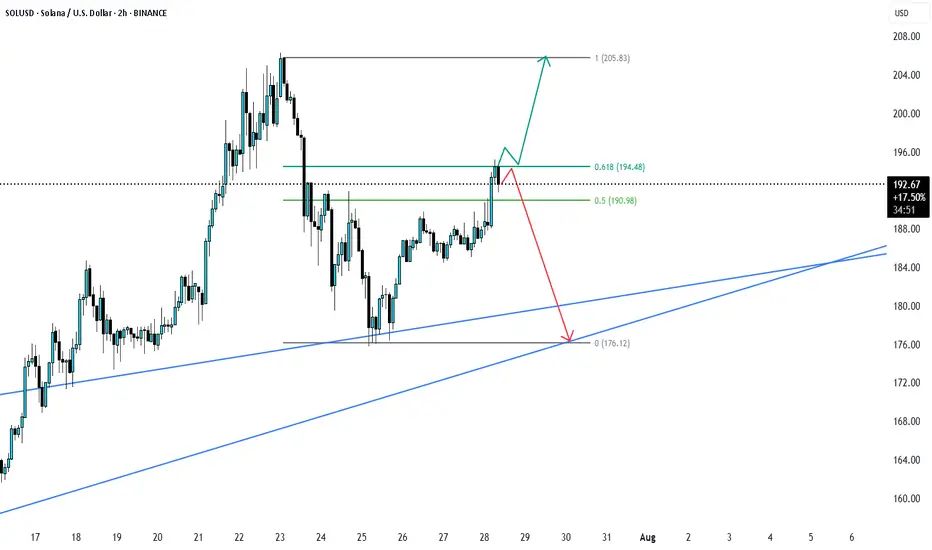
Solana to $260?SOL is testing previous resistance as support around $180.
Reclaiming $184 could signal a test of last week's highs around $206.
Claiming $206 as support could signal a push towards $260.
Losing $180 could signal a retracement towards $165 or 1D 200MA.

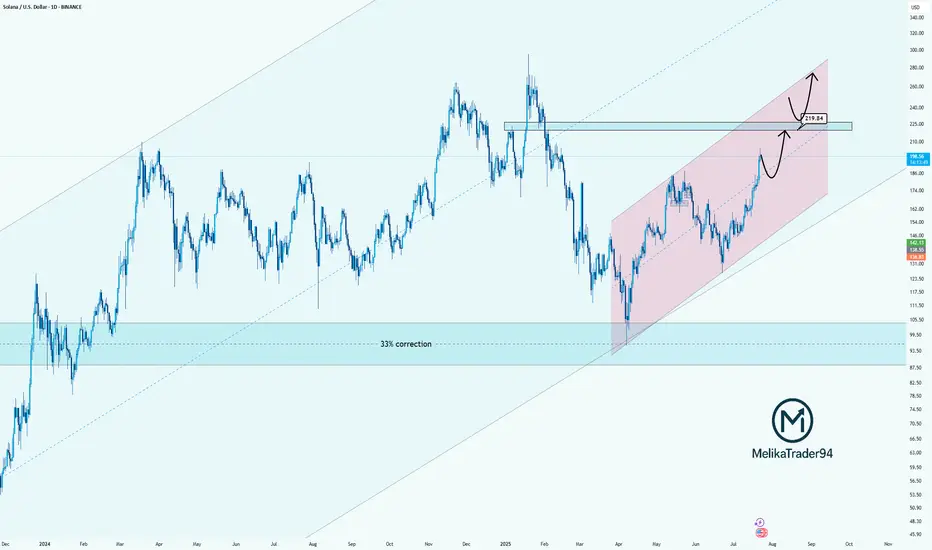
Solana Approaching Key Resistance: watch for $219Hello guys!
Solana has been trending strongly inside a rising parallel channel, recovering steadily after a significant 33% correction. The bullish momentum is clear, and the price is now approaching a key resistance zone near $219.84, which previously acted as a major turning point.
Here’s what I’m watching:
Strong uptrend within the pink channel shows controlled and healthy growth.
$219.84 is a critical decision zone. Price could:
React with a pullback before pushing higher,
Or break through it and flip the level into support for the next bullish leg.
The reaction in this zone will determine the next structure.
Whether we see a temporary correction or continuation to new highs.
$SOL🚨 CRYPTOCAP:SOL Bullish Flag Forming 🚨
Solana is currently setting up a clean bullish flag pattern. We’re watching the $195 level closely a breakout above that zone could confirm a continuation to the upside.
However, confirmation is key we’ll need to see strong momentum and volume to validate the move.
👀 On the downside, there's liquidity building around $171. If price dips into that zone, we might see buyer activity spike possibly creating a new wave of volatility.
SOLUSD possible scenario reached 0.618 fib levelSOLUSD has reached 0.618 Fib leve of recent swings and if breaks this Fib0.618 is likely to go up if not then can go down. let us see.
BULLISH MOVESolana has on the WEEKLY chart shows a clear W formation, on the DAILY chart there is a retest forming a small W formation and on the H4 there is w that later forms an IH&S pattern.
All those patterns indicate a move upwards,ideally to complete the bigger picture that is the W.

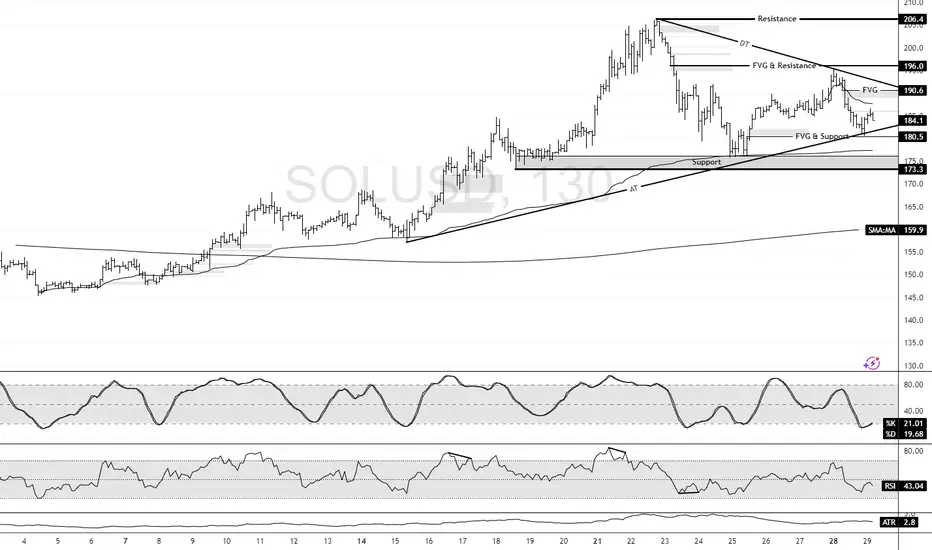
Solana Holds Firm Above VWAP and TrendlineFenzoFx—Solana remained above the ascending trendline and the monthly VWAP, currently trading sideways inside the wedge.
Critical support is at $173.3, and the market outlook remains bullish above this level. If this demand level holds, we expect Solana to resume its bullish trajectory and target the recent highs at $206.4.
Opened longI opened a long position.
Ideally it is safe to wait for EMAs to line up for the bull trend (EMA21 > 55> 200) in the Daily chart. However, there are many indications that the price will start to move to the upside and the upside move might be quite aggressive. So I decided to open a long position with a small position size.
The reasons for opening a long position:
Daily:
Bull candle has closed above EMA21 for a few times.
RSI lines have crossed and entered the bull zone.
MACD lines are about to enter the bull zone.
Stochastic lines are above to cross and move up.
The price has been staying above Fib 0.236 level for about 10 days.
The price has broke and closed above the descending parallel channel.
4H:
All momentum indicators are in the bull zone.
EMA21 is above EMA 55.
The price has closed above EMA200.
The price is consolidating above the top descending parallel channel.
It is not the perfect bull trend set up, however, there are enough confluences for the price to start to move to the upside.
Entry price: $142.59 (blue horizontal line in 4H chart)
Stop Loss: $130.40 (red horizontal line in 4H chart)
Target: $195 (green horizontal line: Fib 0.5 level in Daily chart and fair value gap zone)
$178 is a strong support and resistance area, so if it starts to stall, I might take a partial profit.
Fingers crossed.

SOL TO THE MOONthe solana has urged a retracement , going back to its key zone, the next bullrun will explode the price of solana, make sure you have enough sol in your wallet

Double bottomDouble bottom with RSI regular divergency. It seems that buyers a willing to buy at this level again.

SOLUSD – Recovery Faces Wall at $193SOL broke below $198, hitting a low near $179, confirming the short trigger from the last setup. Since then, it’s building a grind-recovery, reclaiming $189 but stalling at a confluence zone ($191.84 resistance and SMA200 near $193.11). RSI at 59.41 still favors buyers — but SOL needs a clean break above $193+ to shift back into bullish territory.

SOLUSD at Strong SUPPORT SOLUSD was trading down trend the and is current at the support which was its resistance earlier and this is a strong support and expect further growth or up movement of for SOL. 2010-215.

Solana - Current Technical LandscapeCurrent Technical Landscape
Key Support Zone - 20-day EMA (~$178.25): SOL is trading around $180, and a break below this level could lead to a decline towards $171.78. On the other hand, a bounce back would open the way to the $186.40 and $190.47 areas.
Short-Term Weakness and Cooling Activity: Despite growing by over 40% in July, there is now a decline in on-chain activity:
Active Addresses Down 16%
DeFi TVL Down 8%
This could increase bearish pressure in the short term.
Resistance on the 4-hour chart: According to Seeking Alpha, SOL faces strong resistance at the 20-EMA (~$164.78) and below the 50/100-EMA zones (between $170.73 and $174.14), while the downtrend remains dominant.
Structure overview and signals
TipRanks indicators:
General recommendation: Sell
RSI (~43.05): Neutral
MACD: Buy
Stochastic RSI, Williams %R, CCI: Buy
MA 20/50/200: mostly Sell, except MA100 (was Buy)
TipRanks
Support and resistance by Pivot (TipRanks):
Pivot: $166.49
Support: $163.12, $158.24, $154.87
Resistance: $171.38, $174.74, $179.6
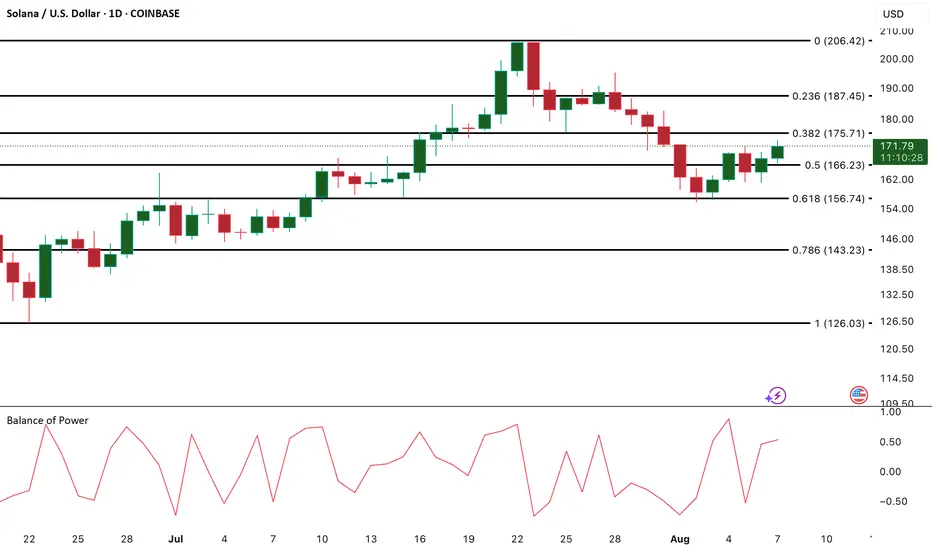
SOL/USD – Bullish Momentum Reemerges as Buyers Take ControlSolana (SOL) is showing signs of renewed bullish strength on the one-day chart, with momentum gradually shifting in favor of the bulls. A key indicator confirming this sentiment is the Balance of Power (BoP), which currently reads 0.57 – a positive figure suggesting that buyers are dominating price action.
The BoP, which ranges between -1 and +1, helps traders gauge the tug-of-war between buyers and sellers during a trading session. SOL’s positive BoP reading implies that price is consistently closing near the upper end of its daily range, a classic signal that buyers are asserting control.
With bulls regaining momentum and SOL continuing its upward trend, this recovery phase could evolve into a stronger rally if market conditions hold. Traders may want to monitor price action closely for confirmation of a sustained breakout.
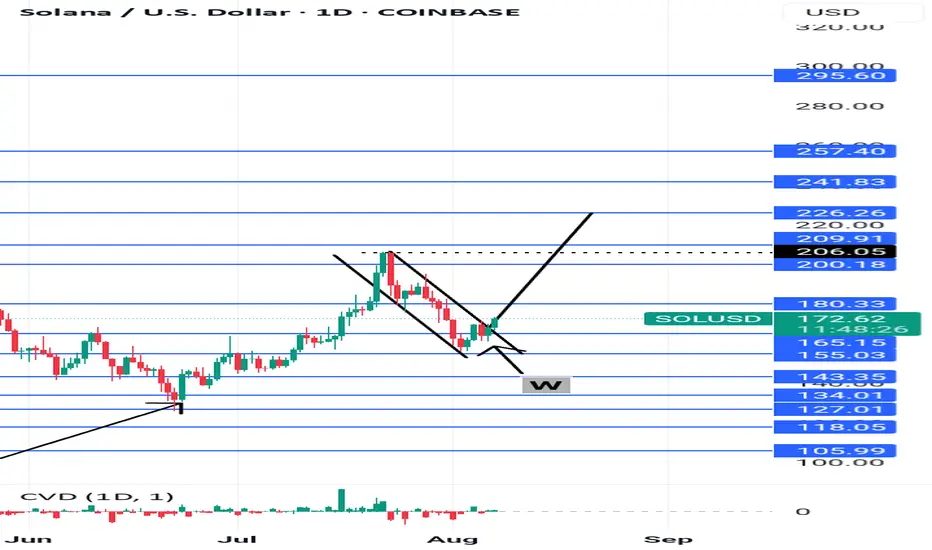
BUYSolana moved downwards within a descending channel, a short formed W was created and has started moving upwards with a clear retest.
The safest TP would be 206.05(TP1) and 226.26(TP2).
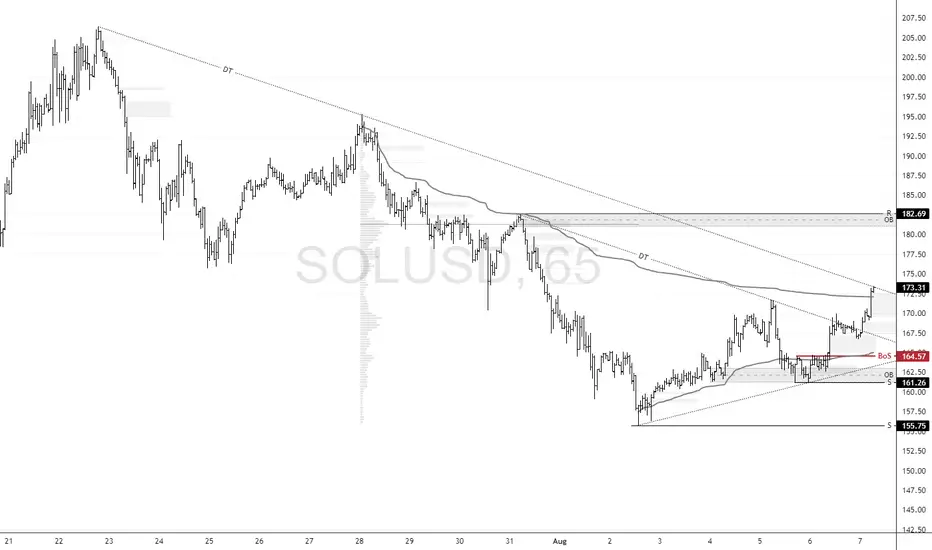
Solana Surges, Yet Still Lags Behind LTCFenzoFx—Solana targeted the primary descending trendline after it broke the structure by closing above $164.5. While LTC, which is a cryptocurrency like Solana with a price range between $100.0 and $200.0, reached its previous monthly highs, Solana still lags behind.
Currently, SOL is testing the average volume weight at approximately $173.0, in conjunction with the primary descending trendline.
Forecast : With the primary support at $161.2, we expect SOL/USD to resume its uptick momentum. In this scenario, the price should target the order block with peak resistance at $182.6.
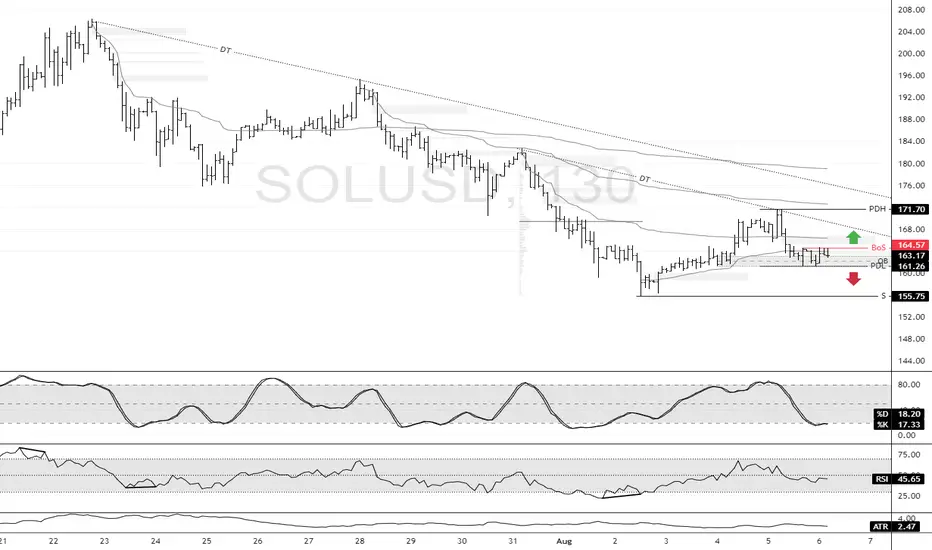
Solana Lags While LTC SurgesFenzoFx—Solan trades sideways, slightly above the previous day's high. Sol's price did not rise while other cryptocurrencies, such as LTC, had a significant surge in price this week. Therefore, we expect the price to rise, and we will be bullish on this cryptocurrency.
The immediate resistance is at $167.5. From a technical perspective, we expect a bullish move toward the previous day's high at $171.7 if this level breaks. If this scenario unfolds, we can market this level as a break of structure.
Please note that the bullish outlook should be invalidated if Solana falls below the previous day's low. If this scenario unfolds, the current bearish momentum will likely target $155.7.
Bullish but not bullish enough yet for a tradeMy overall bias for Solana is bullish. Currently I only own the underlying asset, but I have been waiting for the right set up to arrive to open a leveraged long position.
The way I am looking at the market right now:
Monthly chart:
In the last crypto cycle, Solana reached ATH in Nov 2021 and started to enter the macro bear trend. The price dropped sharply from $260 to $75 in the matter of three months. The price temporarily bounced up to $125 approx. (Red horizontal line in the chart) but it was a dead cat bounce. It failed to move above it and it was the beginning of the official bear market.
When you look at the price action of the last 18 months in a monthly chart, the price has been mostly moving between $125 and $205. However, the price wicked down to $96 in April this year. Since then the price is forming higher high higher low despite messy price action.
Both RSI and MACD are in the bull territory but they are slowly rolling to the downside. Stochastic on the other hand reached oversold territory and is now moving to the upside.
As long as RSI and MACD stay in the bull zone, the current price move is a corrective one.
Currently the price is sitting in the middle of the range bound of the last 18th months.
Weekly chart:
Price is trapped in the range bound and also is the ascending parallel channel.
EMA21 and 55 are bunched up together and running horizontally.
RSI is trapped in the 40-60 range and sliding across.
MACD is tilting to the upside but failed to enter the bull zone.
Stochastic is showing bearish negative divergence.
Base on all the indicators and price action in the weekly chart tell me the price is in a slow decline, but it is more like a tight sideway consolidation.
Daily chart:
EMA21> EMA 55> EMA200 - bullish but not perfect
EMA 200 is dead horizontal and a today's daily candle is sitting on EMA200.
MACD is entering the bear zone. MACD line is about to enter the bear zone. But the stochastic reached oversold territory and now is moving to the upside.
Conclusion:
My number one rule of trading is I stay away from trading when EMA200 is dead flat and the price is oscillating around it. I have lost money numerous times by trying to guess which way the price will move. No point of front running when EMA200 is flat. The price will break out eventually but I need to wait for a clear direction to emerge.
As I wrote in my previous articles. I think the current price move is a corrective one. The price will eventually move to the upside but I have no idea when. What I am focusing on now is to watch where the price will retrace to before it takes off in the daily chart. It may not take off, so I just want to wait and see.
There are a few fair value gap in the Fib 0.618 and 0.786 zone (blue rectangular box) and it is also where the ascending trendline intersects. So it is possible for the price to move further down to that area.
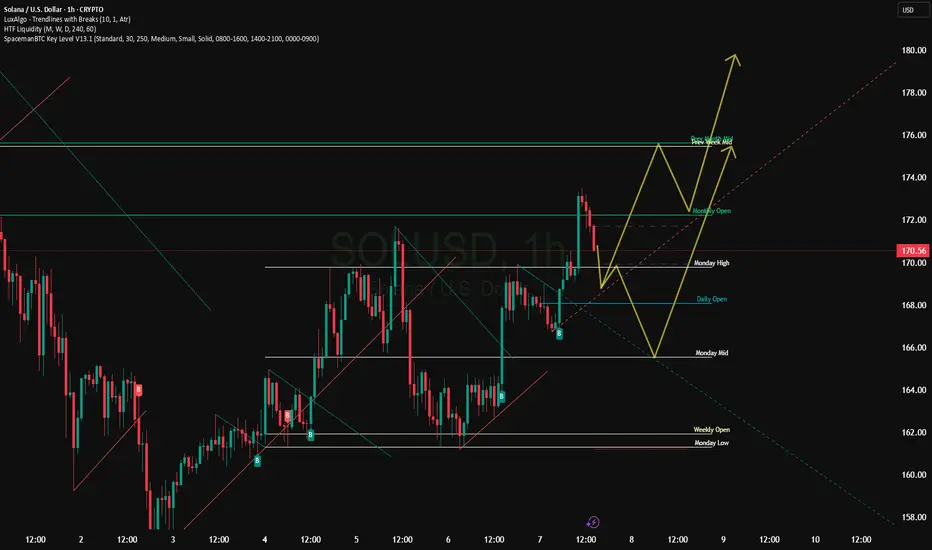
SOLUSD – Volatility Coil UnleashedSOL bounced cleanly from SMA 200 at $164.45 and is now attempting to flip $169.95. Structure favors bulls. If it holds $166–$167 on pullbacks, upside continuation is probable.