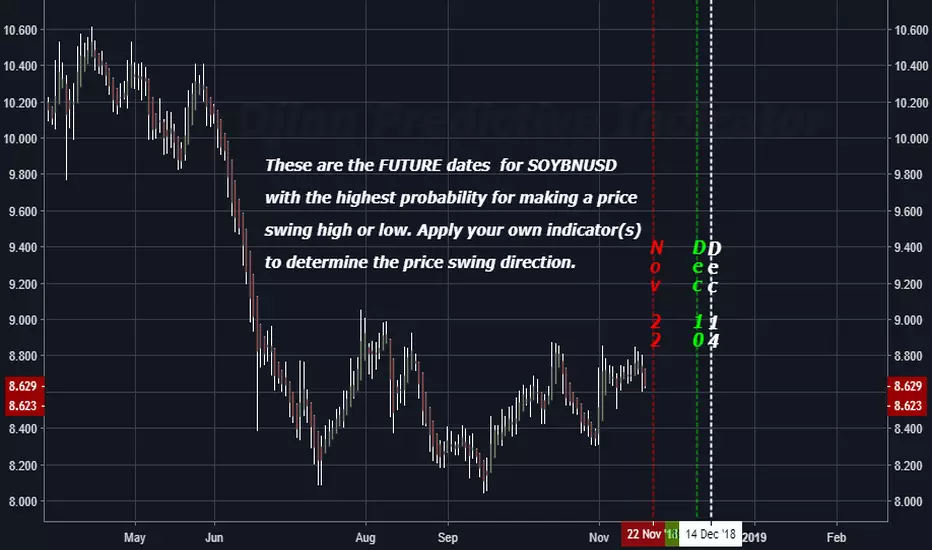
The FUTURE High / Low price swing dates for SOYBNUSDThese are the FUTURE dates for SOYBNUSD (Soybeans) with the highest probability for making a price swing high or low. Apply your own indicator(s) to determine the price swing direction.
As mentioned in other posts, The Djinn Predictive Indicator is for SALE.
Equations for all time frames are included , with the exceptions of the 1 minute time frame and the 5 minute time frame. These time frames will not be included in the sale.
The price is 10,000,000 XRP. I will accept Monero. However, if you pay in Monero the price will be twice the price of XRP at the time of purchase.
SOYBEAN trade ideas
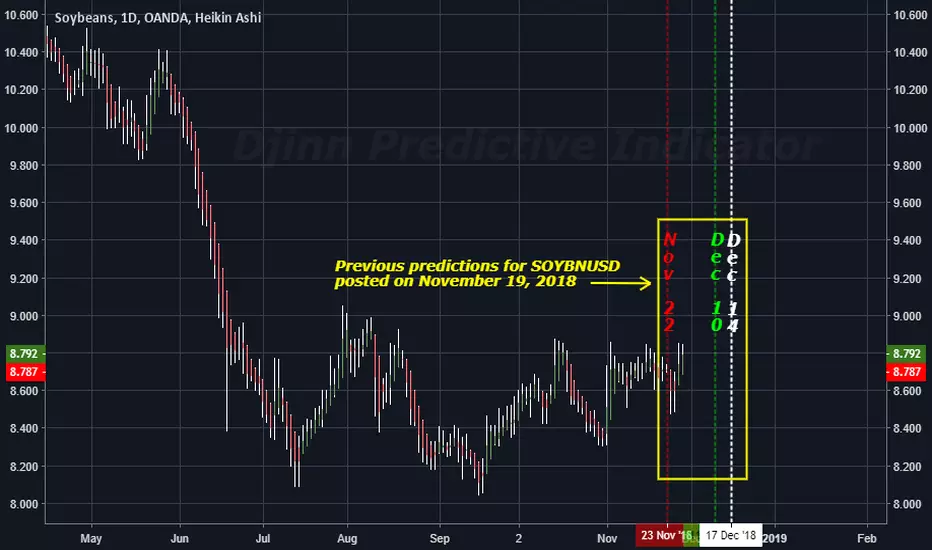
The FUTURE High / Low price swing dates for SOYBNUSD These are the FUTURE dates for SOYBNUSD with the highest probability for making a price
swing high or low. Apply your own indicator(s) to determine the price swing direction.
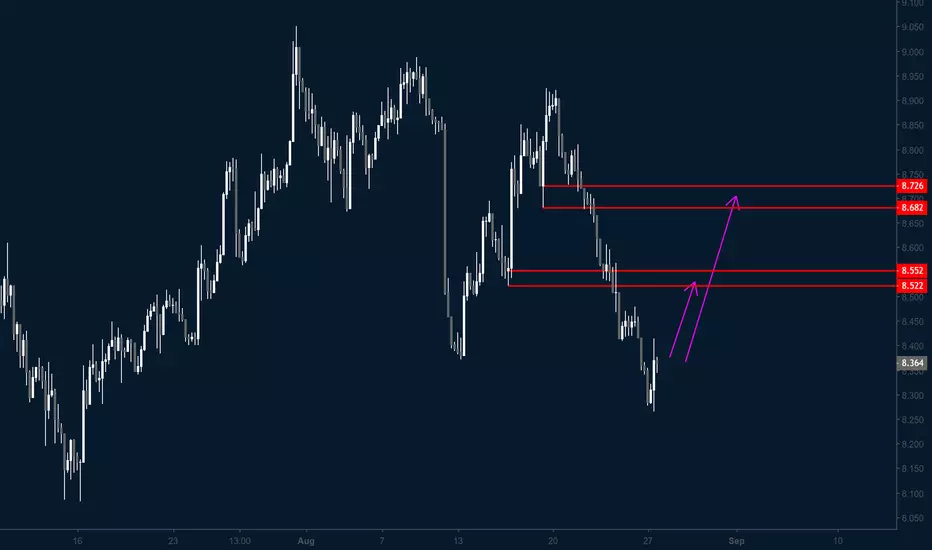
SOYBEANS BUY (SOYBEANS – US DOLLAR)Hi there. Price is forming a continuation pattern to the upside. Wait for the price to hit the bottom of the pattern and watch strong price action for buy.

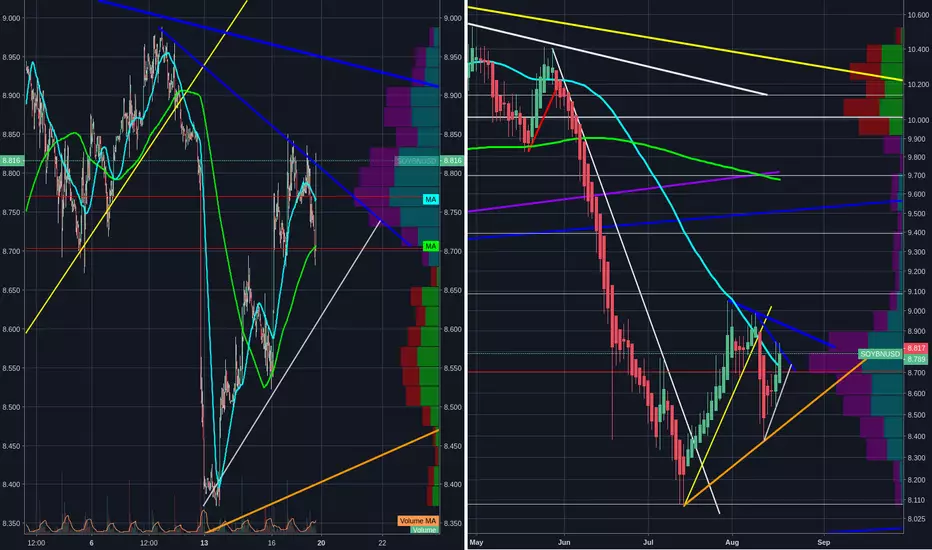
Soybean (SOYBNUSD) is ready for a break out of the wedgeAfter showing a sharp movement, SOYBNUSD is accumulating at the top of the wedge and ready for a break out. Watch it tightly to catch a next movement.
Ideal entry at 8.8, short term target at 9.3, stop loss at 8.6


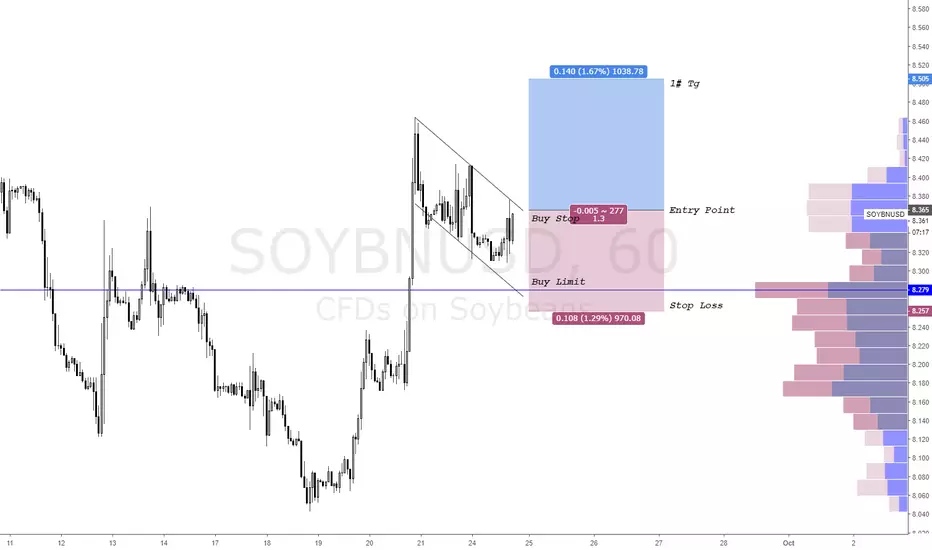
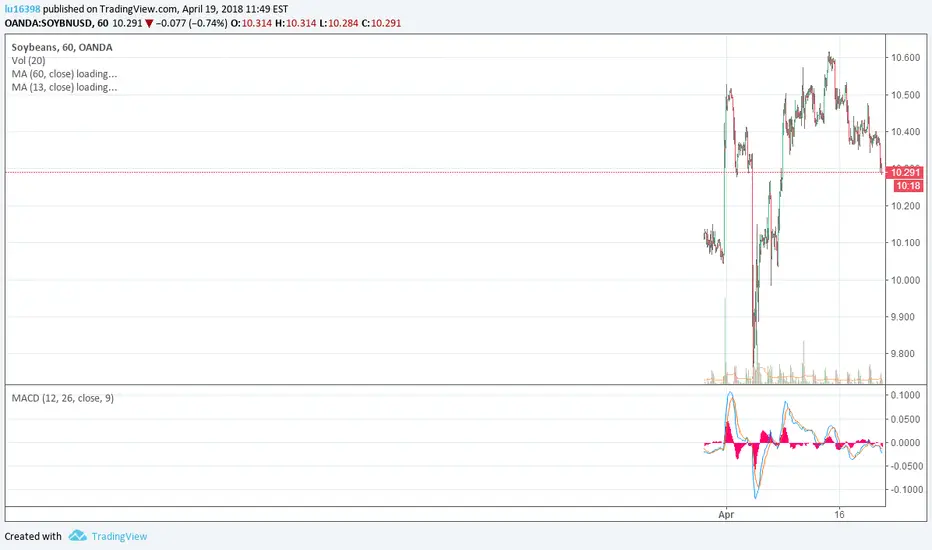
CFD SOYBNUSD Pending Buy OrderCFD SOYBNUSD Pending BUY order
A BULL FLAG pattern is formed by the consolidation.
Focus on trading upside breakout . I place Two Pending Order's!!!!!
Good luck!!!!!!!!

Soybeans head and shoulders break and retestSoybeans broke the head and shoulders, then promptly re-tested the break level.
$SOYBNUSDwww.wsj.com
Record supply with lower demand... what do you expect?
manage your risk
gl hf
xoxo
snoop
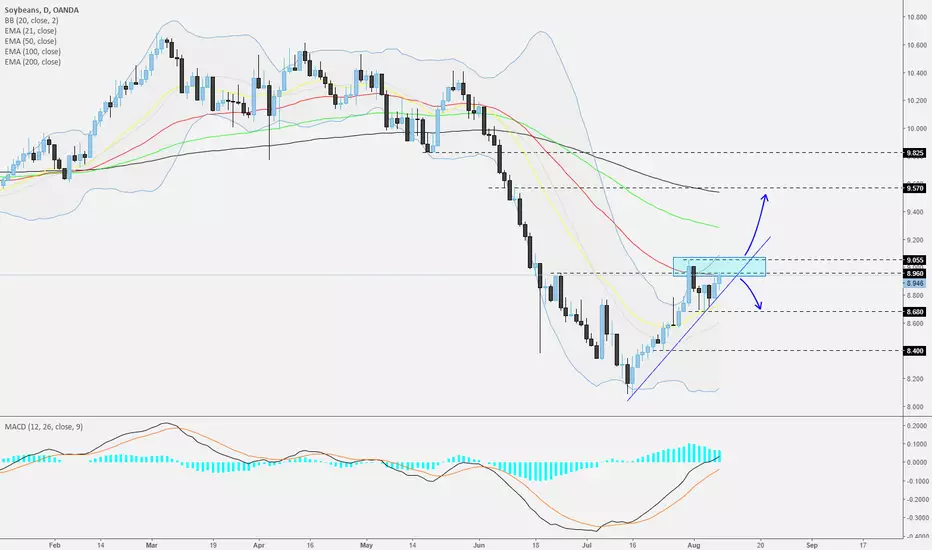
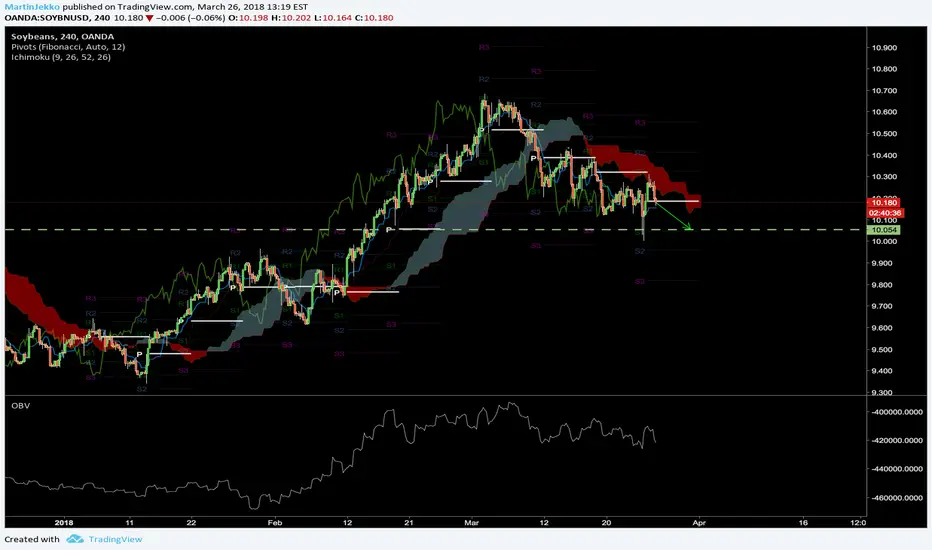
Soybean - Daily - Near the strong area of resistance.Trade Alert
This is something for those, who likes to trade commodities.
Soybeans are near their key area of resistance between 8.960 and 9.055. For us to take the side of the bulls, we would need to see a strong move above 9.055, in order to position ourselves for higher levels. The next longer-term potential area of resistance could be around 9.570, which is also not far from the 200 EMA. The area could prove itself as good resistance that could the price down for a bit.
Alternatively, a break below the short-term upside support line could invite more bears to the table, where the move could lead to a test of the 8.680 zone, marked by the low of the 3rd of August. A break below that level could set the stage for the 8.400, which was the low of the 24th of July.
Don't forget your SL !
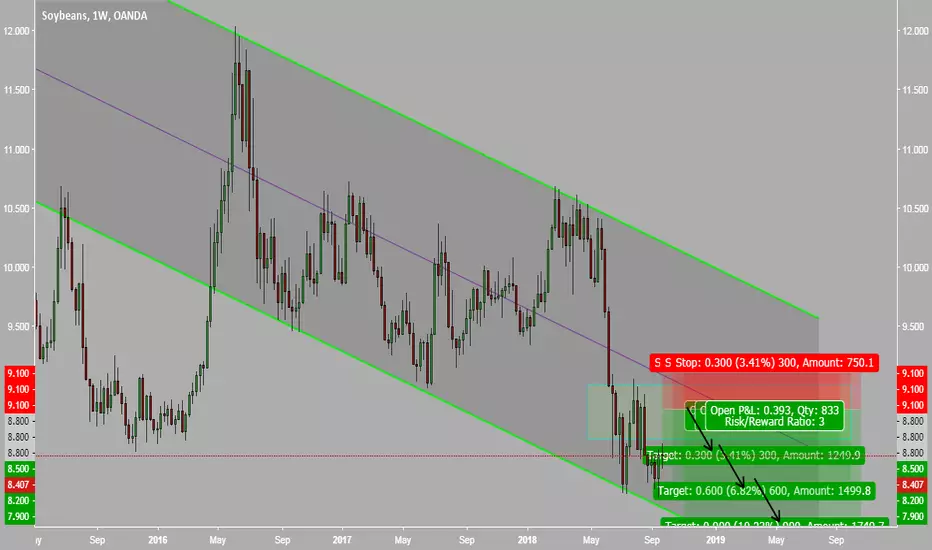
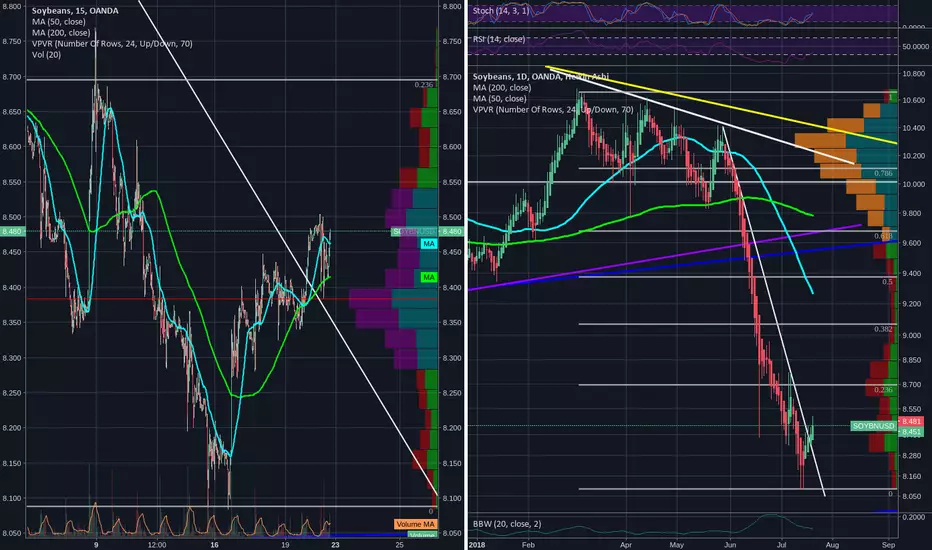
Soy LongAs I said above with regards to a possible Retracement of this move.
- has broken a downtrend
- this could be a short squeeze?
- Volume profile suggests support building between 8.7 and 8.32(refer to RHS - 1Day chart)
- I will keep and eye on DXY TVC:DXY for weakness in the coming week to make a decision
- yes yes, trade wars this... and trade war that...*internet sarcasm* please refer to Macroeconomics - Terms of Trade and not noise :)
5 Day returns(last week): - we can see that Soy, Wheat and Corn did quite well
1 Month returns:
6 Month returns:
YTD return:
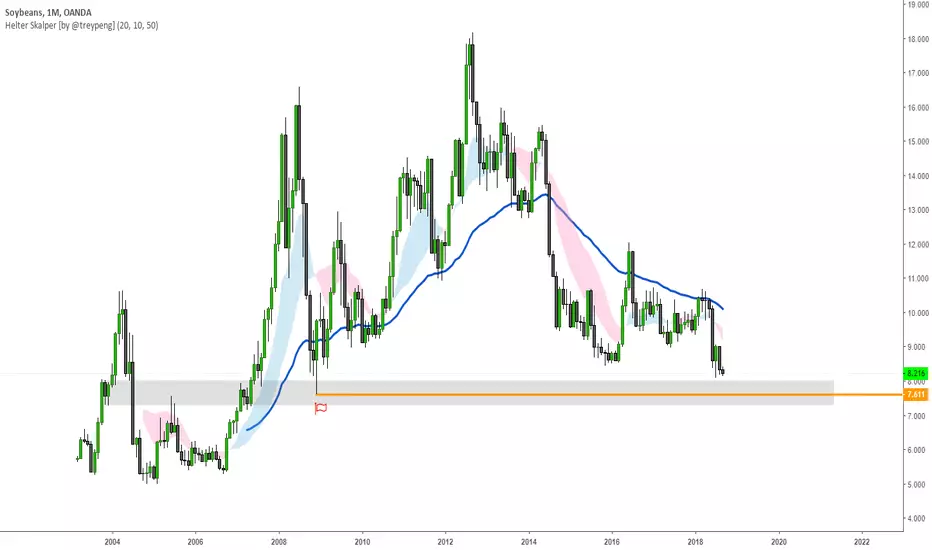
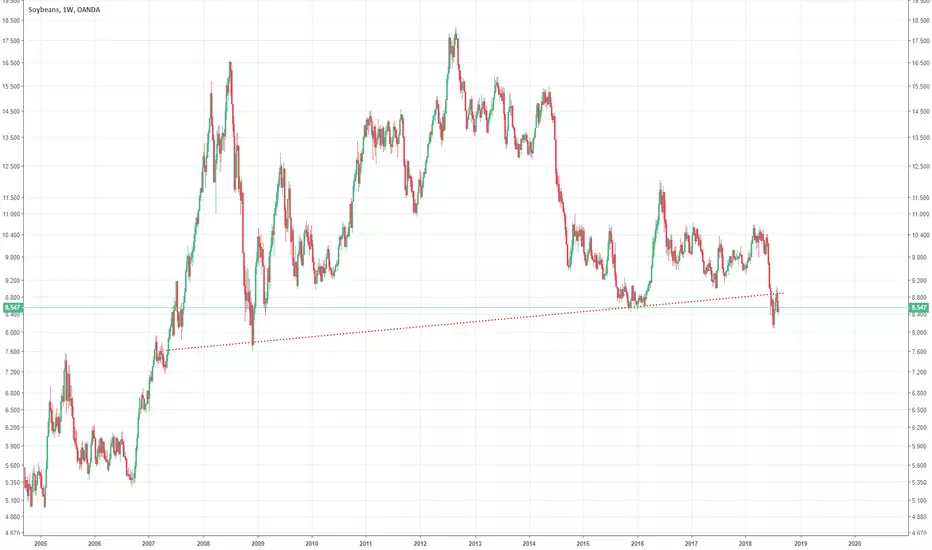
SoyI found looking at a the last 15 years of data rather revealing.
Why?
-in this time there have been 3 major Drawdowns >50%
-each of these was followed by Drawdowns <33%
-vast majority of exchange is done at prices between 11 and 8.5 a Retracement may be in order?
-Might get ugly if it breaks the 2005 Trendline (lowest blue-line)
-Not sure what that equates to, interesting Rytthem of the cycle nevertheless.

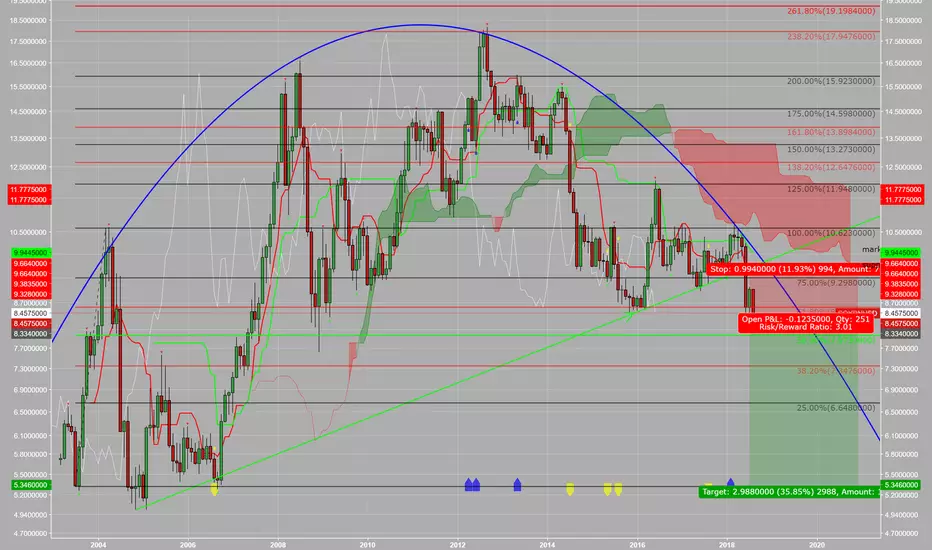
Soybeans Pending LongLooking to load up around -50%/-61.8% incase we break that swing low of 2008 LOL.

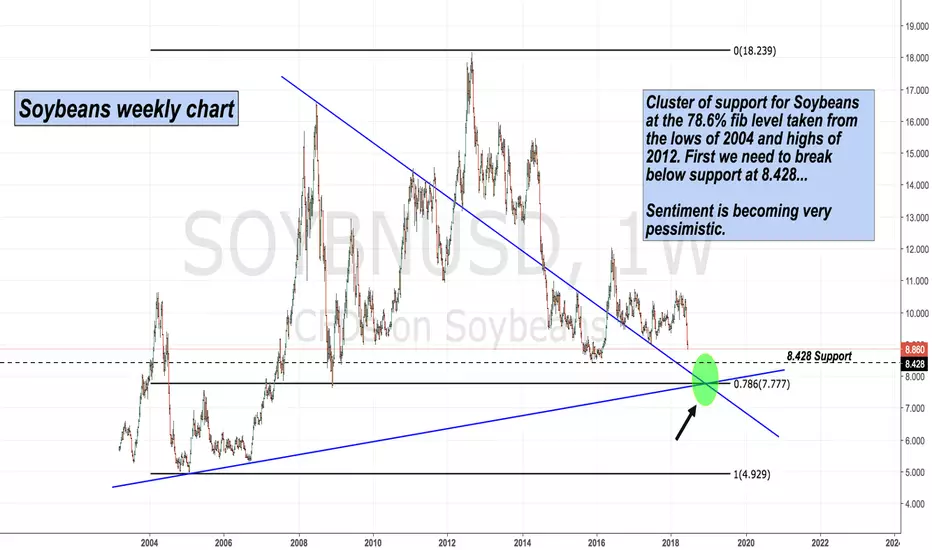
Support for Soybeans ! Concerns regarding trade flows have been the catalyst for this commodity dropping a whopping 13% this month !!
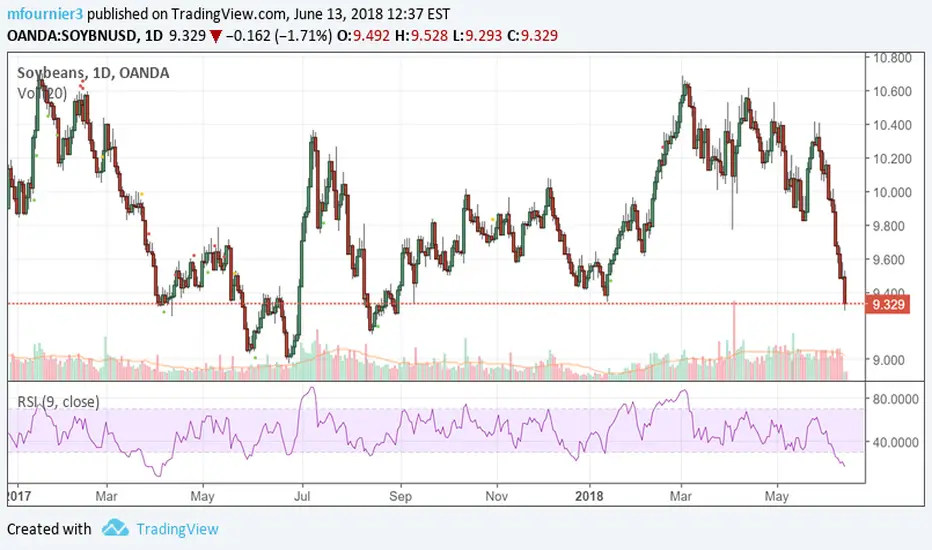
SOYBEANS ...huge selloff since third week of maya buying opportunity will soon come.. selloff not over yet, China is obviously cooking something
just to get your attention on this one,
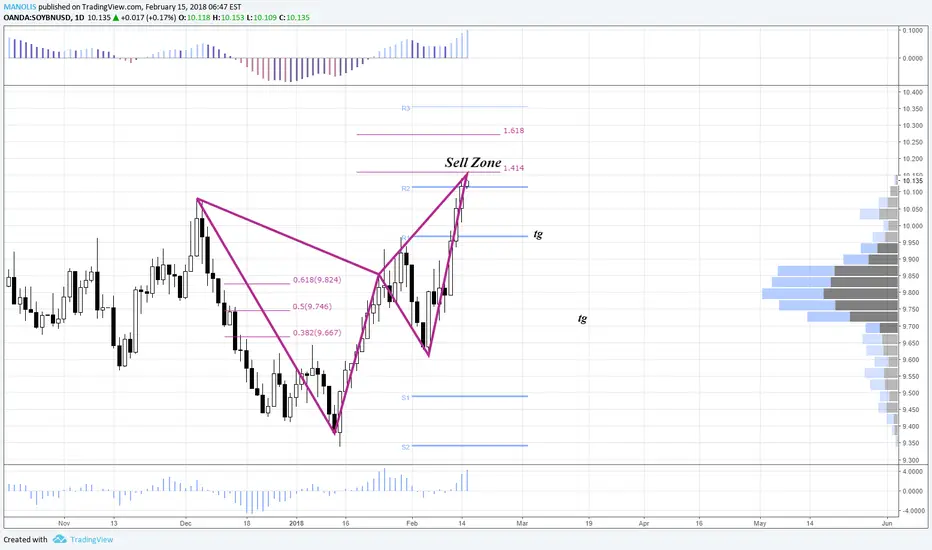
SOYBEANS Short to 10.00It hit once 10.00 I am assuming it will happen again. If brakes below 10.00 next level is 9.75
#SOYBNUSD Pending Sell Option #SOYBNUSD Pending Sell Order.
Waiting for a price action confirmation signal!
Good Luck