SPX: Good push at EOD 4/30, but…Possible H&S? Hear me outGood push at end of day on 4/30 at close.
Zooming out, it’s starting look like it’s forming a H&S. I’m starting to see a lot of people flipping bearish as well. But, also near close today, volume was not promising, declining at the close.
I swung short-term puts on SPY, I like SPX puts for a day trade due to this formation but this H&S can possibly out within the end of week with more data and uncertainty or the following week.
I’m short at the touch of the light red line: 5655.79 to the downside.
Gaps below 5354.76, 5206.44
Would say by EOW to next week, if we pull back, may form/complete the right shoulder.
Do your DD!
Let me know your thoughts! #NFA
SP500 trade ideas

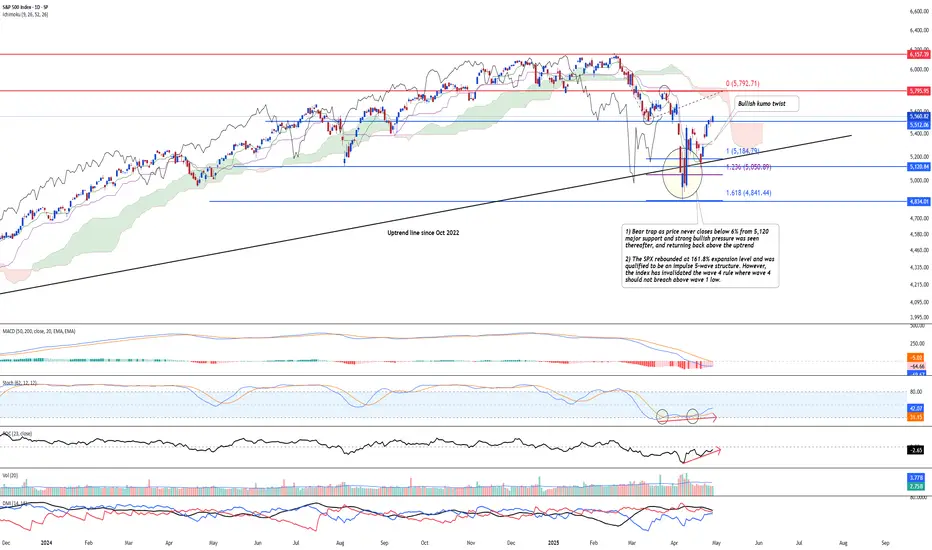
SPX is entering into a new phase of complex corrective waveThe SPX downside is likely to be over after the index was seen invalidating the wave-4 rule of the 5-wave impulse Elliott wave structure. Furthermore, theres a bear trap as price never closes below 6% from 5,120 major support and strong bullish pressure was seen thereafter, and returning back above the uptrend with strong bullish pressure was seen as a strong upside.
Stochastic Oscillator has confirmed the oversold signal.
Target is likely to see 5,792 as the next immediate target. But we do not foresee a new high yet. We think that the correction is likely to unfold in a three wave manner.
S&P 500 index Wave Analysis – 29 April 2025
- S&P 500 index broke key resistance level 5500.00
- Likely to rise to resistance level 5700.00
S&P 500 index recently broke the key resistance level 5500.00 (former support from March, which also stopped A-wave of the active ABC correction B from the start of April).
The breakout of the resistance level 5500.00 coincided with the breakout of the 50% Fibonacci correction of the downward impulse from February.
S&P 500 index can be expected to rise toward the next resistance level 5700.00, target price for the completion of the active impulse wave C.

SPX - LONGprice is moving well with trade talks easing and agreements potentially coming into place. I believe price will continue this bullish momentum
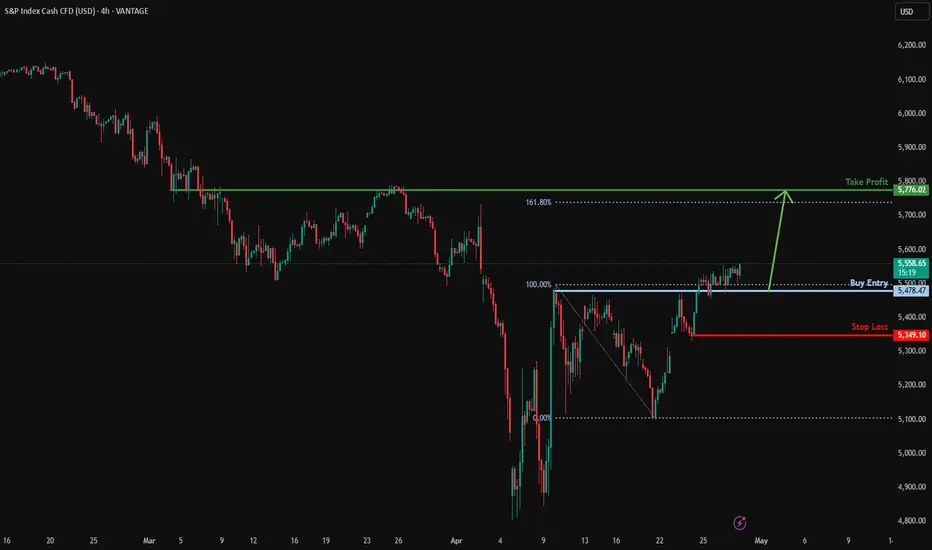
Bullish rise off pullback support?S&P500 has reacted off the support level which is a pullback support and could potentially rise from this level to our take profit.
Entry: 5,478.47
Why we like it:
There is a pullback support level.
Stop loss: 5,349.10
Why we like it:
There is a pullback support level;
Take profit: 5,776.02
Why we like it:
There is a pullback resistance level that is slightly above the 161.8% Fibonacci extension.
Enjoying your TradingView experience? Review us!
Please be advised that the information presented on TradingView is provided to Vantage (‘Vantage Global Limited’, ‘we’) by a third-party provider (‘Everest Fortune Group’). Please be reminded that you are solely responsible for the trading decisions on your account. There is a very high degree of risk involved in trading. Any information and/or content is intended entirely for research, educational and informational purposes only and does not constitute investment or consultation advice or investment strategy. The information is not tailored to the investment needs of any specific person and therefore does not involve a consideration of any of the investment objectives, financial situation or needs of any viewer that may receive it. Kindly also note that past performance is not a reliable indicator of future results. Actual results may differ materially from those anticipated in forward-looking or past performance statements. We assume no liability as to the accuracy or completeness of any of the information and/or content provided herein and the Company cannot be held responsible for any omission, mistake nor for any loss or damage including without limitation to any loss of profit which may arise from reliance on any information supplied by Everest Fortune Group.
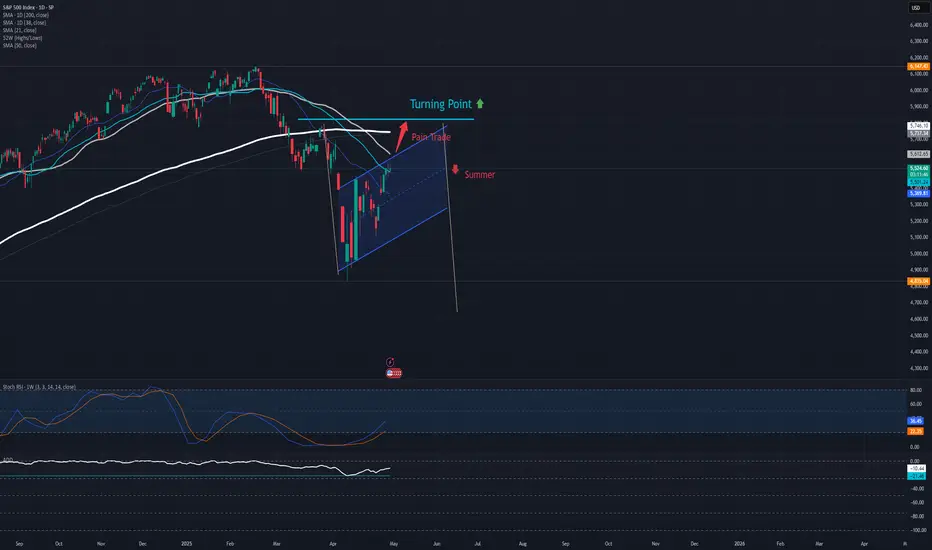
S&P 500 unlikely to return to up trendThe implemented tariff policy of the Trump Administration is expected to hit its fallout on the market by Q3 2025, consequentially the earnings of companies. If the SPX is to have a chance to return to the uptrend this year, it has to confirm two days closings above the turning point before summer.
The inverse effect of tariffs is that it soars with the price: any attempt to adapt on the net price point levers the total price; it's not a fixed number. This leverage applies also to inflation, resulting in consumer sentiment to sour. There is a natural time gap between the implementation of tariffs and the return of industry expected by the Trump Administration - the tariffs have been falling like a chainsaw on international business and supply relations, but rebuilding factories requires time and investment. In this gap the required investments will add pressure to companies' earnings...
These news and outlook brings out funds managers to sell America 'bigly' and to re-evaluate their diversification, bringing down stock prices eventually. The tariff-rebuild-gap is expected to set in by summer, but it is unclear when it would end: so far it is uncertain how much of the industry would return to America to produce and circumvent tariffs. A few big companies announced to build manufactories in the USA, but mostly they plan for only one factory and it still requires building. The Midterm Elections could set the Republican super-majority in both houses to fall and, by extension, have Congress retake the right to set and lift tariffs from the White House. However, it is unclear whether they would use their retaken privilege, as one truth about tariffs, like about all taxes: they're easily introduced, but can take generations to go away again.
All this forms a painstaking 2H scenario for 2025, its rock-bottom too early to call.
MACD says a little higher for a little longerAs per the individual stocks I cover that have not yet reached their ideal retracement areas I am looking for the SPX to get higher into my target box. In any event it's reasonable for me to say we're in a B wave and therefore our pattern can develop into something more complex. Nonetheless, I am mainly looking for MACD to reach the zero line at the very minimum.
The take-a-way from this update is I am looking slightly higher in the markets for slightly longer...before our minor C wave takes hold of the market.
Best to all.
Chris

Grab Some Points To Upside In SPX/USD $$$Hey fellow traders and followers!
How go's the profits so far? Market movin & groovin to the beat of the Orange drum.
I'm here to help if you are having any troubles or confusion with SPX. Let's have a quick look.
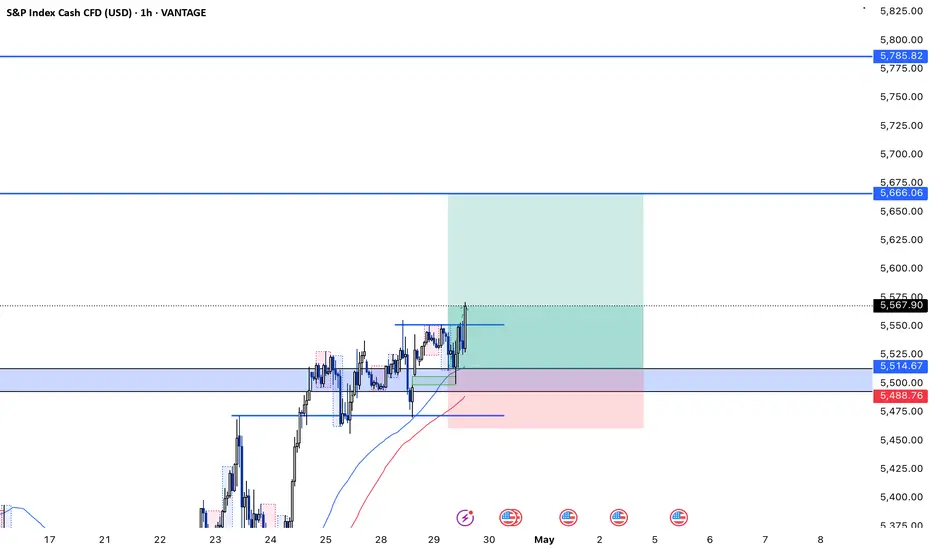
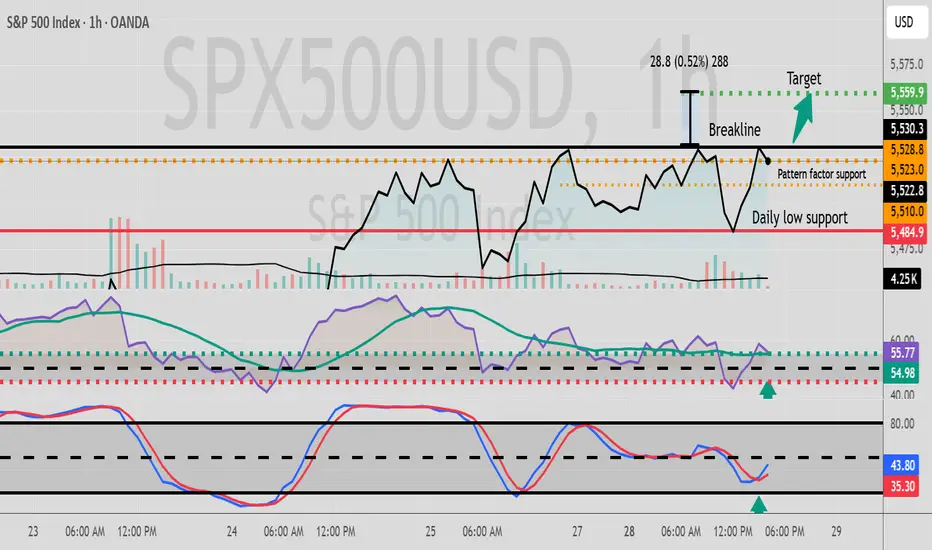
We have a V pattern in the 1hr chart so let's trade this baby!
Breakline is 5530.3 so we wait to see a break above before getting long. Pattern support is around 5510, a break below that price area would likely cancel out the bullishness of this pattern so keep eyes on that. Daily low support sits around 5484.9. A break below that support spells a short down for 29 points. A break above the breakline is a long good for around 29 points. RSI is 55.77 (Bulla). Easy money if the V gets flyin $$$.
Don't listen to any news or rumors, listen to your charts. Wait! Did you hear that? Your 1hr chart is whispering something about easy money if you pay close attention to the numbers and the rules laid out within.
Hey! best of luck in all your trades people ! Wishing all of you prosperous trades. $$$
Believe or Not- Blue SeasonBefore Donald Trump gets credit based on tariff's or anything like that I wanted to share the future of SPX 500 with everyone. It's definitely about to explode to a new all time high. Watch and learn. Market 101- Let's go USA!
Getting closeWe're getting close to a top, but I still think 5600 will likely be attempted today or tomorrow. I will change my mind if they start getting under 5450. Vix broke out of a wedge, which is bullish for the vix but I don't think it runs up right away. I will change my mind if they get the vix over 28 again.

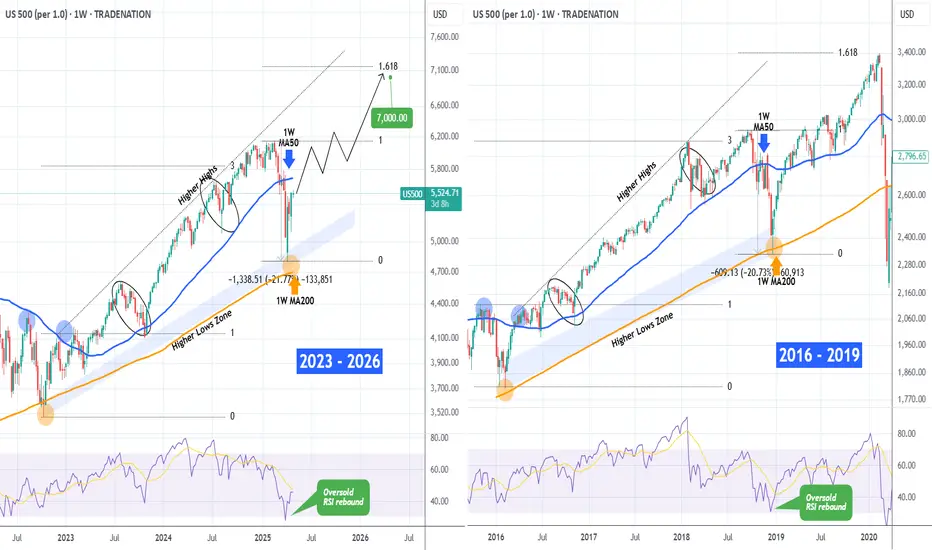
S&P500 repeating the 2019 recovery-Can hit 7000.The S&P500 index (SPX) is making a remarkable recovery as it completed yet another strong 1W green candle last week following the rebound on its Higher Lows Zone, near the 1W MA200 (orange trend-line).
This is a mirror price action with the last 1W MA200 rebound of the 2016 - 2019 Bullish Megaphone pattern, which not only recovered its previous All Time High (ATH) but also peaked on the 1.618 Fibonacci extension before the eventual 2020 COVID crash.
As a result, we believe that a 7000 Target is a very plausible one on the long-term.
-------------------------------------------------------------------------------
** Please LIKE 👍, FOLLOW ✅, SHARE 🙌 and COMMENT ✍ if you enjoy this idea! Also share your ideas and charts in the comments section below! This is best way to keep it relevant, support us, keep the content here free and allow the idea to reach as many people as possible. **
-------------------------------------------------------------------------------
Disclosure: I am part of Trade Nation's Influencer program and receive a monthly fee for using their TradingView charts in my analysis.
💸💸💸💸💸💸
👇 👇 👇 👇 👇 👇
SPX500: Short Setup Brewing!SPX500 is currently consolidating above the key volume node at 5,480.85, showing resilience after a sharp pullback last week. Price action remains inside a rising channel, but the steeper trendline has been broken, hinting at possible loss of momentum.
🔹 Key Observations:
Price is testing the lower trendline support—a breakdown here could trigger a move toward 5,400.
Volume profile shows heavy interest at 5,480, with a potential volume gap below that could accelerate downside.
VWAP support is intact for now, supporting a neutral-to-bullish bias.
A breakout above 5,530 would confirm bullish continuation and likely test 5,560+.
📈 Bias: Neutral to Bullish
📉 Breakdown Trigger: Below 5,480
📊 Probability Estimates:
Bullish breakout: 55%
Bearish breakdown: 45%
Watching closely for resolution at this inflection point. Patience until direction confirms.
💬 What’s your bias—bulls or bears?
#SPX500 #ES1 #S&P500 #VolumeProfile #TechnicalAnalysis #FOMC #VWAP #TrendlineBreak

S&P500 INTRADAY resistance at 5510Earnings season heats up with major companies like Visa, Coca-Cola, Starbucks, UPS, and Pfizer reporting results. In Europe, HSBC announced a $3 billion share buyback, while BP shares dropped due to weaker cash flow.
In Canada, the Liberal Party is set to win a fourth term, but likely without a majority, which could lead to a coalition-style government.
Meanwhile, the Trump administration plans to ease auto tariffs on foreign parts used in U.S.-made vehicles, boosting Ford and GM shares in premarket trading.
Market Impact:
Watch for shifts in trade-sensitive sectors, supply chain plays (especially in tech), and defense stocks as geopolitical risk evolves.
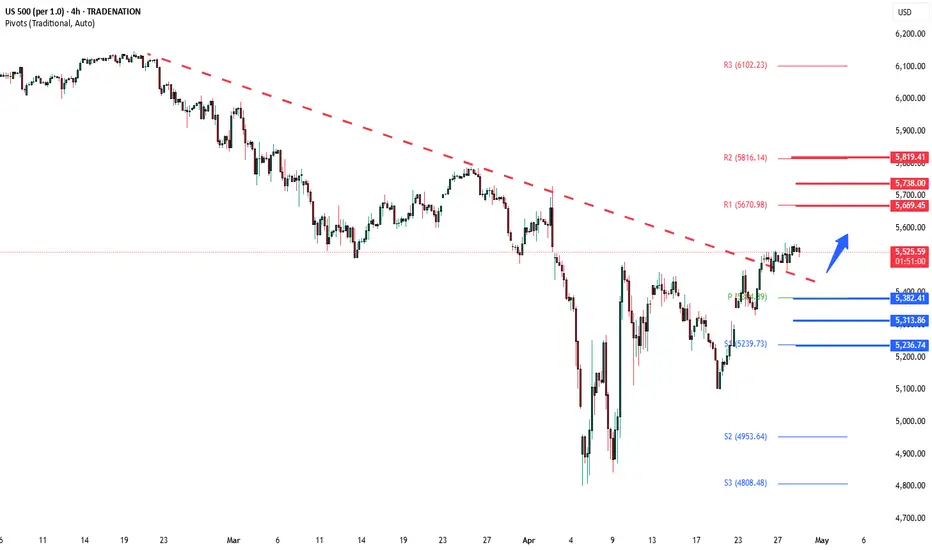
Key Support and Resistance Levels
Resistance Level 1: 5670
Resistance Level 2: 5740
Resistance Level 3: 5820
Support Level 1: 5380
Support Level 2: 5310
Support Level 3: 5236
This communication is for informational purposes only and should not be viewed as any form of recommendation as to a particular course of action or as investment advice. It is not intended as an offer or solicitation for the purchase or sale of any financial instrument or as an official confirmation of any transaction. Opinions, estimates and assumptions expressed herein are made as of the date of this communication and are subject to change without notice. This communication has been prepared based upon information, including market prices, data and other information, believed to be reliable; however, Trade Nation does not warrant its completeness or accuracy. All market prices and market data contained in or attached to this communication are indicative and subject to change without notice.
SPX500 (4H) LONG POSITIONGreeting there traders this is my idea on SP500 and it is Long.
We can clearly see a recovery from the “Support Area” (yellow zone), after a wave formation (probably a completed Elliott Wave correction).
You are currently in a very impulsive uptrend.
Momentum looks strong, with no major retracements — meaning that buyers would currently be in a dominating position.
Key Levels
Support Level (red): 5.019 – 5.091
This is the “ultima ratio” zone where the price made a strong rebound.
Softer Support: 5.276 – 5.282 (where you are now)
This is the zone of possible correction, as you marked.
Resistance/Target: 6.150 – 6.156
If the current trend holds and there is no major retracement below 5,250, it is very likely that we will test the 6,000–6,150 level in the coming days.
The price is currently in a “blast-off” phase — if volume remains strong, you can hit the TP as early as late April or early May.
I predict that we have started an uptrend towards a new ATH. I believe that the market will start to "fly" already on Monday or Tuesday. Possible catalysts: Trump strikes a deal with China, announces a pause in the trade war, or Powell responds with an emergency rate cut.
My goal is mid $6,000 to low $7,000 by July 4th (maybe sooner). After that I expect a 60-70% drop.

SPX500 H4 | Potential bullish bounceSPX500 could fall towards an overlap support and potentially bounce off this level to climb higher.
Buy entry is at 5,546.94 which is an overlap support.
Stop loss is at 5,440.00 which is a level that lies underneath an overlap support.
Take profit is at 5,789.71 which is a swing-high resistance.
High Risk Investment Warning
Trading Forex/CFDs on margin carries a high level of risk and may not be suitable for all investors. Leverage can work against you.
Stratos Markets Limited (tradu.com):
CFDs are complex instruments and come with a high risk of losing money rapidly due to leverage. 63% of retail investor accounts lose money when trading CFDs with this provider. You should consider whether you understand how CFDs work and whether you can afford to take the high risk of losing your money.
Stratos Europe Ltd (tradu.com):
CFDs are complex instruments and come with a high risk of losing money rapidly due to leverage. 63% of retail investor accounts lose money when trading CFDs with this provider. You should consider whether you understand how CFDs work and whether you can afford to take the high risk of losing your money.
Stratos Global LLC (tradu.com):
Losses can exceed deposits.
Please be advised that the information presented on TradingView is provided to Tradu (‘Company’, ‘we’) by a third-party provider (‘TFA Global Pte Ltd’). Please be reminded that you are solely responsible for the trading decisions on your account. There is a very high degree of risk involved in trading. Any information and/or content is intended entirely for research, educational and informational purposes only and does not constitute investment or consultation advice or investment strategy. The information is not tailored to the investment needs of any specific person and therefore does not involve a consideration of any of the investment objectives, financial situation or needs of any viewer that may receive it. Kindly also note that past performance is not a reliable indicator of future results. Actual results may differ materially from those anticipated in forward-looking or past performance statements. We assume no liability as to the accuracy or completeness of any of the information and/or content provided herein and the Company cannot be held responsible for any omission, mistake nor for any loss or damage including without limitation to any loss of profit which may arise from reliance on any information supplied by TFA Global Pte Ltd.
The speaker(s) is neither an employee, agent nor representative of Tradu and is therefore acting independently. The opinions given are their own, constitute general market commentary, and do not constitute the opinion or advice of Tradu or any form of personal or investment advice. Tradu neither endorses nor guarantees offerings of third-party speakers, nor is Tradu responsible for the content, veracity or opinions of third-party speakers, presenters or participants.

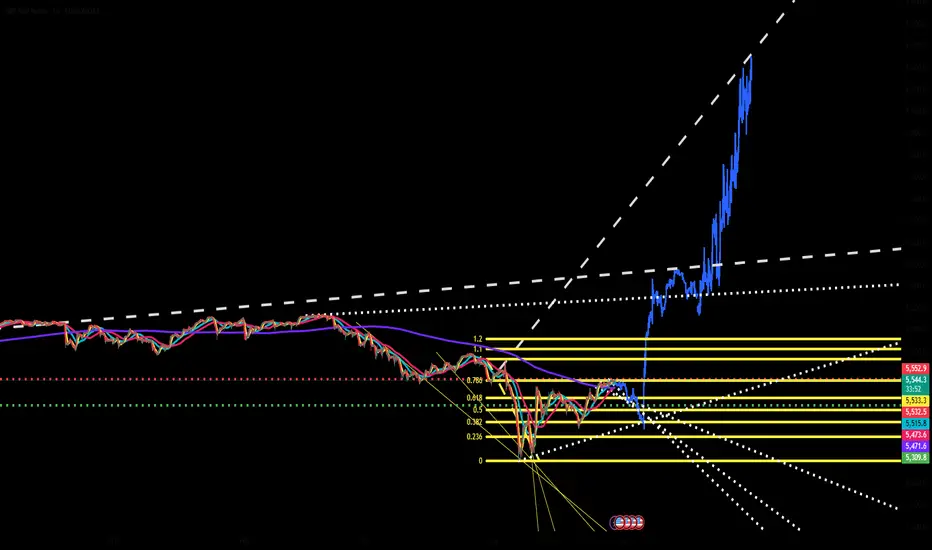
Trading the Impulse Rally Retracement — Price and Time Symmetry Fundamental —
Trend is observed from an impulse run’s lowest/highest point and projected outwards in symmetrical fibonacci retracement via price/time from the first reversal candle to the end of the rally, creating crosshairs. These ‘crosshairs’ visually represent the trending ‘price distribution projection’ in price/time symmetry.
Using this concept, I draw a ‘projection trend line’ from the bottom or top of the impulse run thru the projected 78.6% price/time retracement value, to identify the price distribution structure in a linear form.
Now to introduce my STOP LOSS TRIANGLE.
This is a concept of decaying price and time as an underlying move towards our theoretical projection, where if the underlying enters our built faded cross-section, the SL is triggered to avoid sideways consolidation and decaying contract premiums.
This ‘right’ triangle that is ‘sclene’ by nature is created by taking the furthest projection in price/time symmetry (78.6%) and drawing a vertically placed straight line to the highest/lowest point in the rally previously identified. Here, I create a ‘right triangle’ by turning 90 degrees towards my final point, which is made by the nearest projection in price/time symmetry (38.2%). In its entirety, this forms the stop loss triangle
