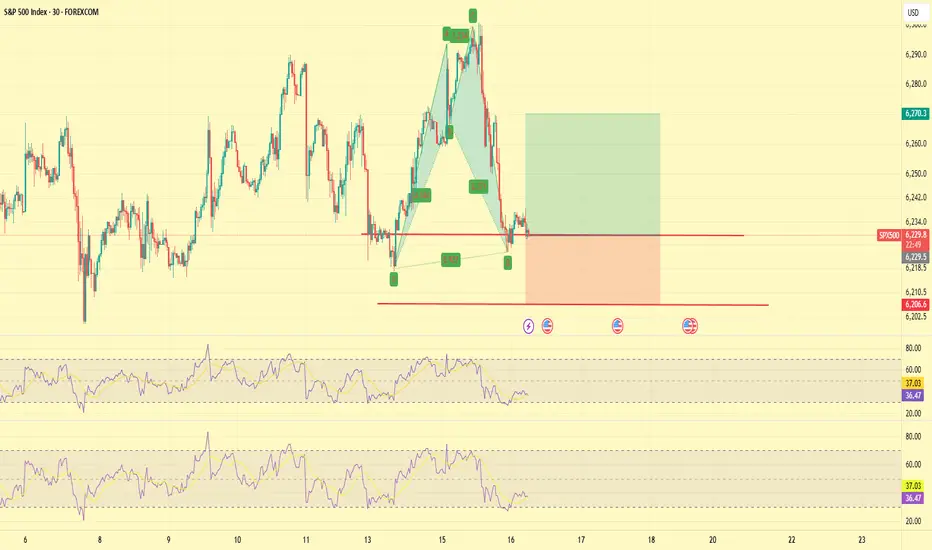
SPX500 LongThere is a lot of support at this level
There is a shark pattern on M15 and M30
All timeframes are oversold and there are multiple bottoms with divergence
This trade is with the trend
25 Pip stop loss
SP500FT trade ideas
S&P 500 H4 | Approaching a multi-swing-low supportThe S&P 500 (SPX500) is falling towards multi-swing-low support and could potentially bounce off this level to climb higher.
Buy entry is at 6,220.89 which is multi-swing-low support that aligns with the 23.6% Fibonacci retracement.
Stop loss is at 6,170.00 which is a level that lies underneath a multi-swing-low support.
Take profit is at 6,299.72 which is a swing-high resistance.
High Risk Investment Warning
Trading Forex/CFDs on margin carries a high level of risk and may not be suitable for all investors. Leverage can work against you.
Stratos Markets Limited (tradu.com ):
CFDs are complex instruments and come with a high risk of losing money rapidly due to leverage. 63% of retail investor accounts lose money when trading CFDs with this provider. You should consider whether you understand how CFDs work and whether you can afford to take the high risk of losing your money.
Stratos Europe Ltd (tradu.com ):
CFDs are complex instruments and come with a high risk of losing money rapidly due to leverage. 63% of retail investor accounts lose money when trading CFDs with this provider. You should consider whether you understand how CFDs work and whether you can afford to take the high risk of losing your money.
Stratos Global LLC (tradu.com ):
Losses can exceed deposits.
Please be advised that the information presented on TradingView is provided to Tradu (‘Company’, ‘we’) by a third-party provider (‘TFA Global Pte Ltd’). Please be reminded that you are solely responsible for the trading decisions on your account. There is a very high degree of risk involved in trading. Any information and/or content is intended entirely for research, educational and informational purposes only and does not constitute investment or consultation advice or investment strategy. The information is not tailored to the investment needs of any specific person and therefore does not involve a consideration of any of the investment objectives, financial situation or needs of any viewer that may receive it. Kindly also note that past performance is not a reliable indicator of future results. Actual results may differ materially from those anticipated in forward-looking or past performance statements. We assume no liability as to the accuracy or completeness of any of the information and/or content provided herein and the Company cannot be held responsible for any omission, mistake nor for any loss or damage including without limitation to any loss of profit which may arise from reliance on any information supplied by TFA Global Pte Ltd.
The speaker(s) is neither an employee, agent nor representative of Tradu and is therefore acting independently. The opinions given are their own, constitute general market commentary, and do not constitute the opinion or advice of Tradu or any form of personal or investment advice. Tradu neither endorses nor guarantees offerings of third-party speakers, nor is Tradu responsible for the content, veracity or opinions of third-party speakers, presenters or participants.

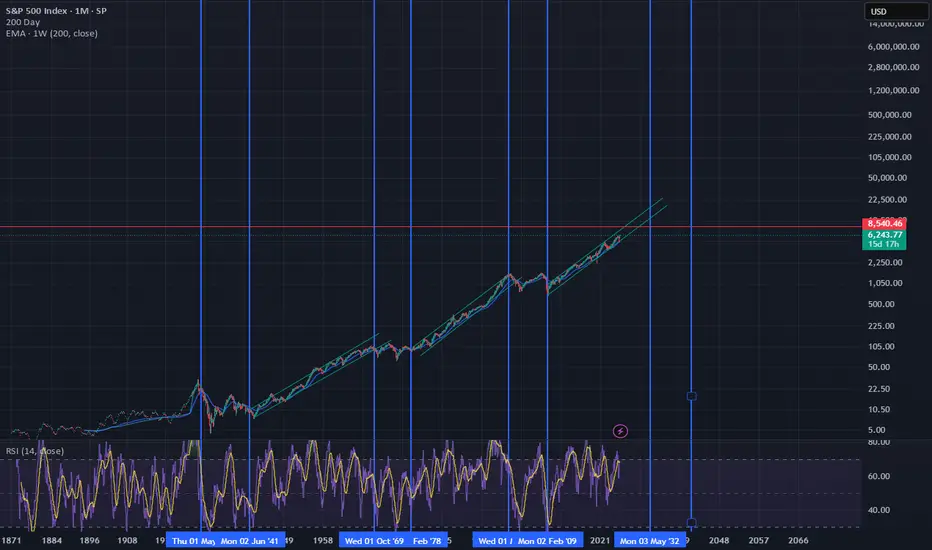
A steady move up for the next 3 yearsYou can clearly see the pattern. The boom/bust cycle, and inflation. Don't expect my lines to be exact. Imagine bitcoin if we hit the upper trend line.
Bullish for the next 3-5 years and another crisis. (2030)
They should teach this in school.
This is just my Elliott Wave Analysis not financial Advice. $SPThis is just my Elliott Wave Analysis not financial Advice. SP:SPX #SPX SP:SPX
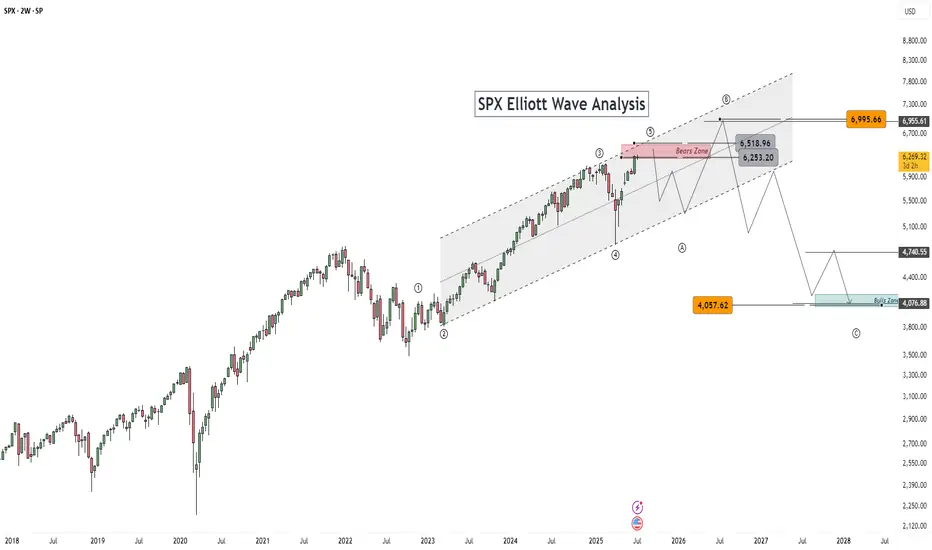
S&P 500 and the Elliott Wave TheoryThis is a continuation of a Weekly chart that I had previously posted. Our Wave 2(Red) was a Zigzag and the expectation is a Flat for Wave 4(Red) which we see occurred. Since Wave 4(Red) completed, a Wave 5(Red) was triggered. We can expect our Wave 5 to express itself in 5 Waves just like any other Wave. We can observe that our Wave 2(Green) was a Flat and we can expect our Wave 4(Green) to be a Zigzag. Wave 3(Green) was a strong upward move and a confirmation at its current price would trigger a Zigzag correction. This would be our Wave 4(Green) and would set the stage for the last wave before a major correction.
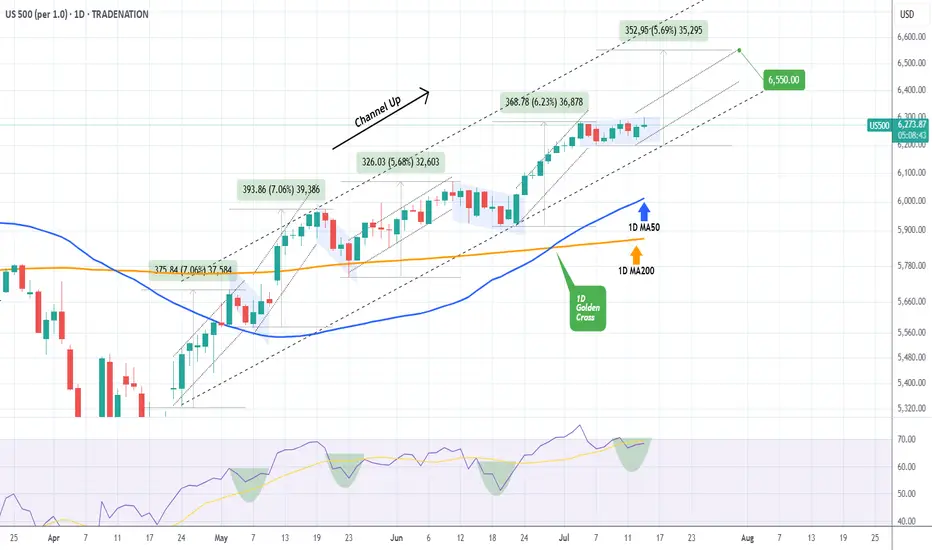
S&P500 Accumulation almost over. New rally begins.The S&P500 index (SPX) has been trading within a 3-month Channel Up pattern, within which, it's been replicating almost the same structure. This involves an aggressive Bullish Leg Phase (dotted Channel Up), followed by a correction/ Accumulation Phase (blue Channels), which eventually leads to the new Bullish Leg.
The 1D RSI fractals among those patterns are similar and right now it seems that we are about to complete the latest Accumulation Phase. Having completed a 1D Golden Cross 2 weeks ago, the time-frame looks more bullish than ever and as long as the 1D MA50 (blue trend-line) holds, we expect at least a +5.68% rise (the minimum of the previous Bullish Legs), targeting 6550.
-------------------------------------------------------------------------------
** Please LIKE 👍, FOLLOW ✅, SHARE 🙌 and COMMENT ✍ if you enjoy this idea! Also share your ideas and charts in the comments section below! This is best way to keep it relevant, support us, keep the content here free and allow the idea to reach as many people as possible. **
-------------------------------------------------------------------------------
Disclosure: I am part of Trade Nation's Influencer program and receive a monthly fee for using their TradingView charts in my analysis.
💸💸💸💸💸💸
👇 👇 👇 👇 👇 👇
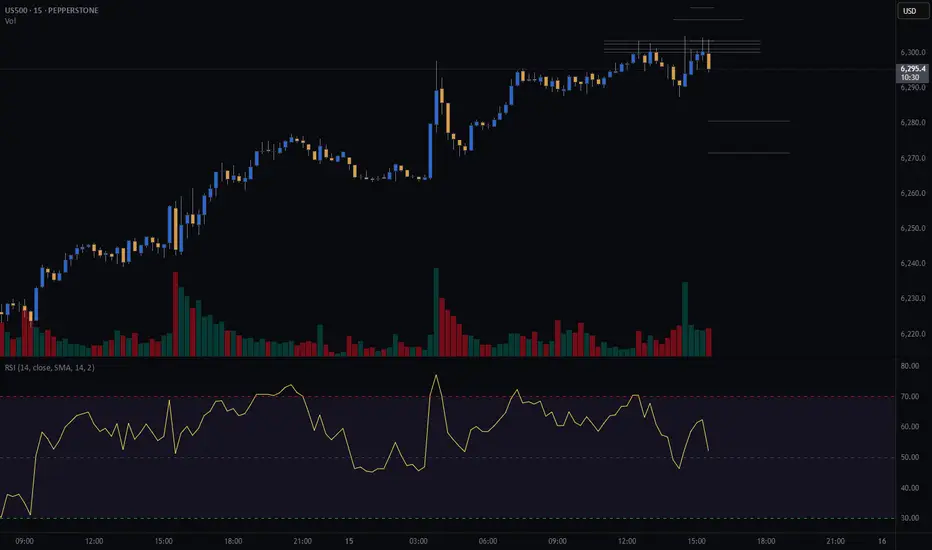
S&P500 (CASh500) Short - double top 15minEntry = 6303.4
SL = 6312.8
Take profit level 1 = 6280.7
Take profit level 2 = 6271.6
Bulls and Bears zone for 07-15-2025ETH session market is trading higher and expected to Open gap up.
Would traders be able to keep that momentum going rest of the RTH session.
Level to watch: 6328 --- 6330
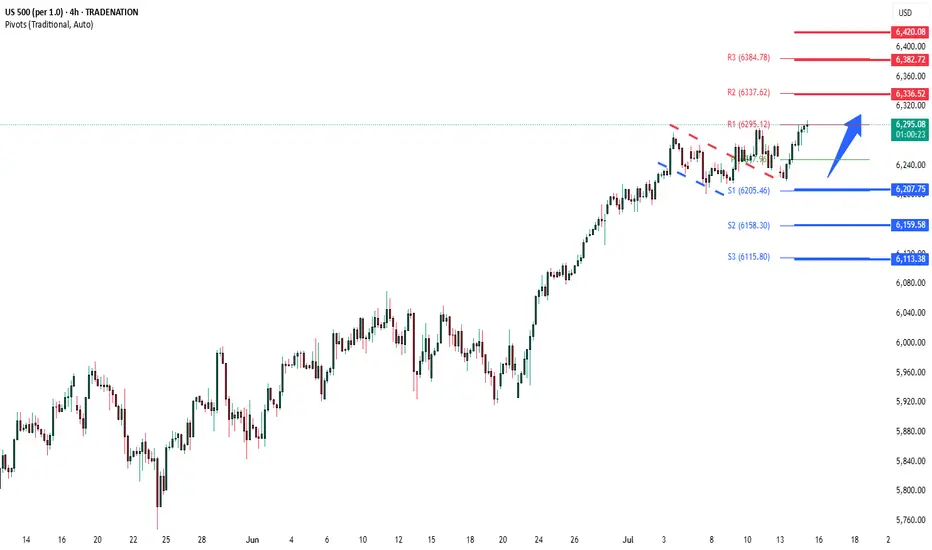
S&P500 Bullish breakout supported at 6207Trump’s $3.4 Trillion Tax Plan
Favors wealthy investors: Tax burden shifts based on how you earn, not how much.
Winners: Business owners, investors, high-income earners.
Losers: Immigrants, elite universities.
Trade Tensions
EU Tariffs: Brussels targets $72B in US goods (e.g., Boeing, cars, bourbon) in response to Trump’s tariff threats.
Impact: Risk to transatlantic trade; US open to talks.
US-China Tech Relations
Nvidia: Resumes H20 AI chip sales to China after US approval—boosted chip stocks.
Trump: To announce $70B in AI & energy investments today in Pennsylvania.
Trend: Signs of easing tensions between US and China.
Earnings Focus: Big US Banks
Q2 results (JPM, Citi, WFC, BNY Mellon, BlackRock) will highlight:
Net interest income: How rate levels affect profits
Loan growth & credit quality: Signs of lending strength or weakness
Capital markets activity: Trading & investment banking trends
Key Support and Resistance Levels
Resistance Level 1: 6335
Resistance Level 2: 6380
Resistance Level 3: 6420
Support Level 1: 6207
Support Level 2: 6160
Support Level 3: 6115
This communication is for informational purposes only and should not be viewed as any form of recommendation as to a particular course of action or as investment advice. It is not intended as an offer or solicitation for the purchase or sale of any financial instrument or as an official confirmation of any transaction. Opinions, estimates and assumptions expressed herein are made as of the date of this communication and are subject to change without notice. This communication has been prepared based upon information, including market prices, data and other information, believed to be reliable; however, Trade Nation does not warrant its completeness or accuracy. All market prices and market data contained in or attached to this communication are indicative and subject to change without notice.
S&P 500 consolidating at all-time highsOf late, we have seen price action on the S&P 500 consolidate around all-time highs of 6,290 and is on track to form a small ascending triangle. The nearest support to note resides at the 1W level of 6,121, closely shadowed by a 1M support from 6,040.
Based on the current technical picture, this clearly remains a buyers’ market.
- FP Markets Research Team

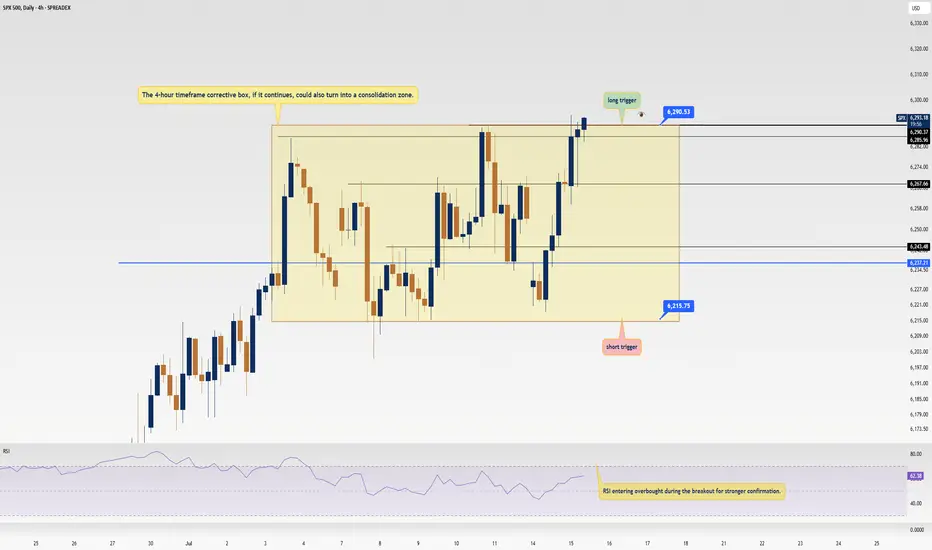
SPX500 Update: Monster Trigger Ready to Launch!Welcome back, traders, it’s Skeptic from Skeptic Lab! 😎 With news of the unemployment rate rising, stock and crypto markets have been surging hard, and right now, we’ve got a killer trigger on SPX500 you don’t want to miss. Its breakout could spark the next major bullish leg. Let’s dive into the Daily and 4-hour timeframes to unpack this setup. here’s the play:
✔️ Daily Timeframe:
After a strong rally, SPX500 hit an all-time high (ATH) at 5,249.14 before entering a deep correction. Here’s what many traders miss: support/resistance levels aren’t static—they shift over time. The resistance that was at 6,146.89 has now climbed to 6,290. Breaking 6,290 signals the start of a major bullish trend after 146 days of correction. This is our primary long trigger.
📊 4-Hour Timeframe (Futures Triggers):
Long Trigger: After a solid uptrend with strong momentum, we entered a time-based correction within a box pattern. Breaking the box ceiling at 6,290 is the long trigger, aligning with the Daily breakout.
Short Trigger: Breaking the box floor would trigger a short, but this goes against the trend, so stop-loss risk is higher, and your win rate could take a hit—stay cautious.
📉 Key Insight: The 6,290 breakout is the big move to watch, fueled by market momentum from the unemployment news. Shorts are riskier due to the bullish trend, so prioritize longs with volume confirmation.
🔔 Confirmation: For longs, confirm the 6,290 break with RSI entering overbought.Risk management is critical—cap risk at 1%–2% per trade to survive the market’s swings.
🔼 I’ll update if the structure shifts! Thanks for vibing with this analysis! <3
💬 Let’s Talk!
Which SPX500 trigger are you locked on? Hit the comments, and let’s crush it together! 😊 If this update lit your fire, smash that boost—it fuels my mission! ✌️
Equity Markets Ahead of the US Inflation ReportEquity Markets Ahead of the US Inflation Report
Today at 15:30 GMT+3, the US inflation report (Consumer Price Index, or CPI) is scheduled for release. According to ForexFactory, analysts expect the inflation rate to rise from 2.4% to 2.6%.
The actual figures will provide market participants with grounds to debate not only the likelihood of a Federal Reserve rate cut, but also the evolving tensions between Donald Trump and Jerome Powell.
Should the report deliver any surprises, it will almost certainly trigger heightened volatility across the equity markets. For now, however, investors are seemingly optimistic about the upcoming fundamental data — especially given the commencement of Q2 earnings season, which lends additional weight to today’s macroeconomic indicators.
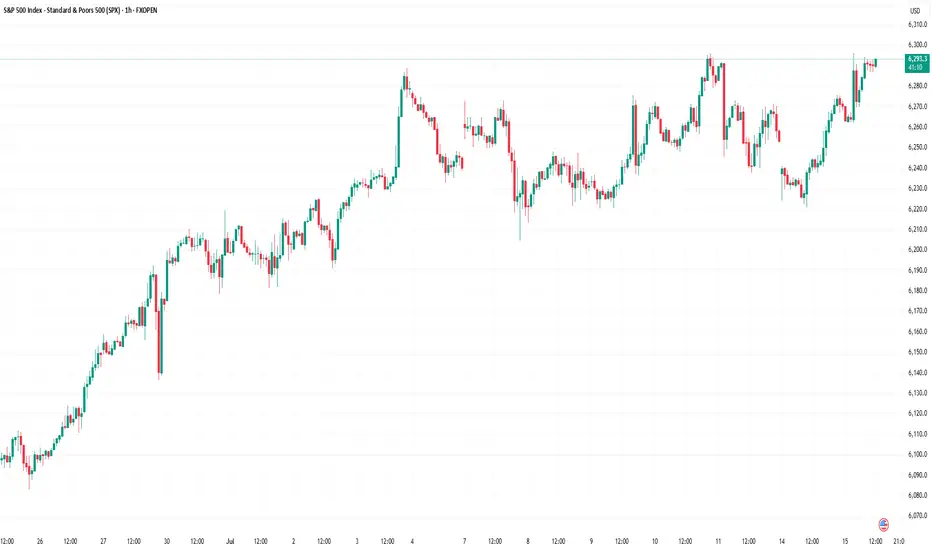
Technical Analysis of the S&P 500 Chart
The S&P 500 chart (US SPX 500 mini on FXOpen) shows the index fluctuating within a range defined by support at 6,222 and resistance at 6,290.
The upward impulses (as indicated by arrows) suggest that:
→ current market optimism, combined with the CPI release, may lead to a bullish breakout above resistance and the establishment of a new all-time high;
→ in a broader context, such a breakout could be interpreted as a continuation of the rally that began in April, following a period of consolidation between the aforementioned levels.
This article represents the opinion of the Companies operating under the FXOpen brand only. It is not to be construed as an offer, solicitation, or recommendation with respect to products and services provided by the Companies operating under the FXOpen brand, nor is it to be considered financial advice.
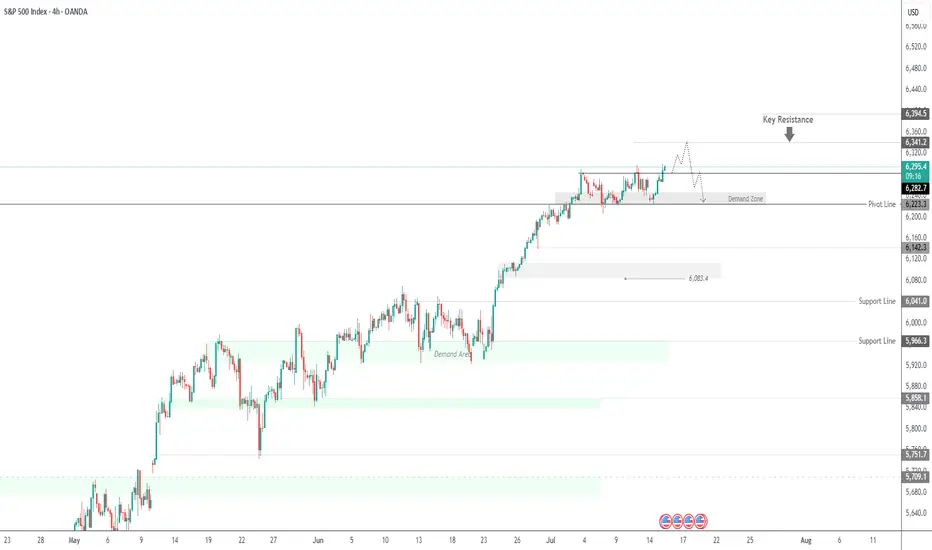
SPX500 Outlook – CPI Data in Focus, Key Pivot at 6282SPX500 – Market Outlook
U.S. futures are climbing as Nvidia plans to resume chip sales to China, fueling positive momentum across tech and growth sectors.
However, investor caution remains ahead of key events:
Major banks ( NYSE:JPM , NYSE:WFC Wells Fargo, NYSE:C Citigroup) will report earnings, offering insights into the financial sector.
All eyes are on the June CPI report, expected at 2.6%. A higher reading could reinforce bearish pressure, while a softer print would support continued bullish momentum.
Technical Outlook:
SPX500 has bounced from the demand zone and is now trading above the pivot at 6282, which keeps the bullish trend in play.
As long as the price holds above this level, we expect continuation toward 6341, and if broken, extended upside toward 6394.
To shift bearish, price must break and close below 6223, which would open the path toward 6142.
Pivot: 6282
Resistance: 6341 – 6394
Support: 6225 – 6191 – 6142
Event Watch : CPI data release today – anything above 2.6% may trigger downside; below 2.6% could support further upside.
Previous idea:
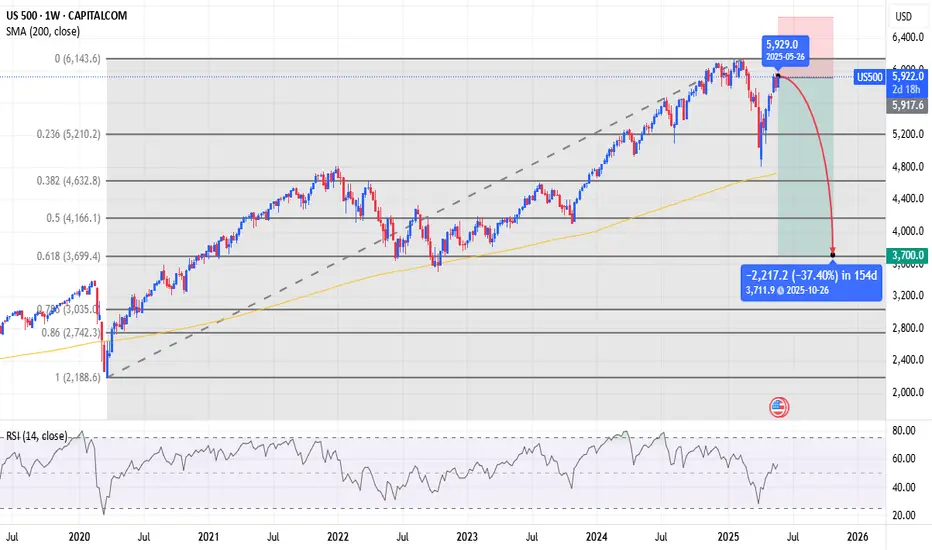
Major LowI'm buying puts expiring on October 31st, All Hallow's Eve.
I'll give price room to keep melting up to 666 at the farthest, that is my stop level. If we breach that price, then just know that tech is unstoppable and Artificial Intelligence is the Mark of the Beast.
If the market doesn't drop here, then the sky is the limit.
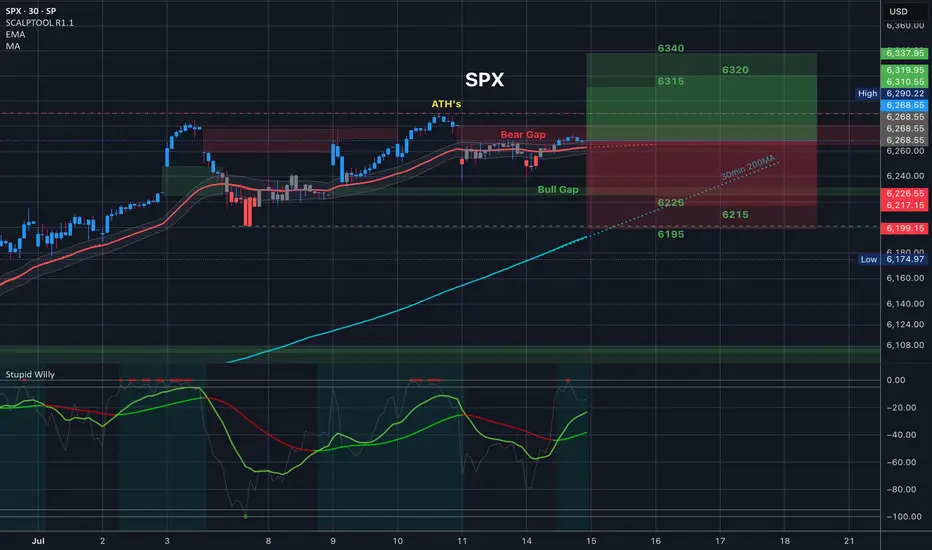
$SPX Trading Range for 7.15.25 and everything in it for CPI
Tomorrow’s Trading range and everything in it. How are you playing it?
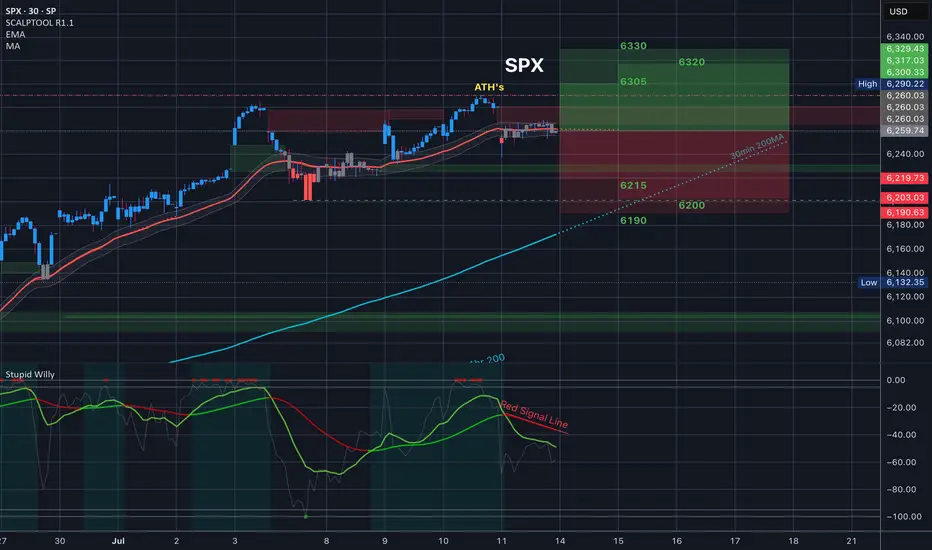
$SPX Tomorrow’s Trading Range and everything in it /// 7.14.25Tomorrow’s Trading range and everything in it. How are you playing it?
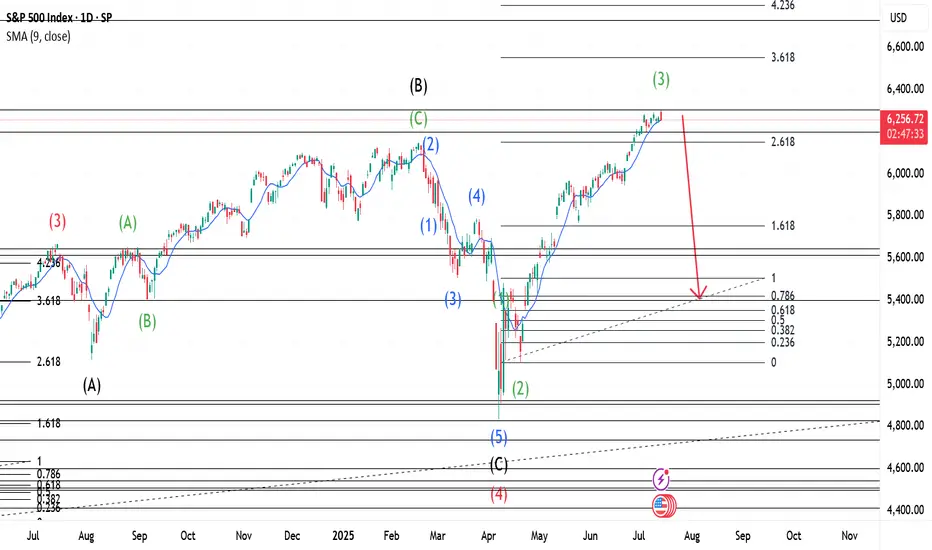
US500 evening analysisMy primary count of bullish price action since 7 April 2025 low sees regular flat (regular flat A, zigzag B, impulse C), impulse C with ending diagonal 5 of (5).
Median line (red line) of pitchfork was never tagged, implies price action eventually returning to origin (5098.6).
Ending diagonal invalid above 6307.2, bears with high reward, low risk opportunity.

SPX 6300 Highs to 6200 Lows - Watch Key LevelsThis week earnings season kicks off
-Notables include JPM, GS, BAC, WFC, NFLX, KMI, PEP and others
US Inflation (CPI and PPI) this week
-forecasts are showing HIGHER inflation
-consumers care, but markets may not
6300-6350 key resistance area for SPX
6200 key support area for SPX
If we break the 6200 floor, there's room to fall to 6000-5700 to find stronger support
I discuss the 50 day moving averarages on the S&P and Nasdaq as levels to watch
For the remainder of the month...
7/18 July Monthly Expiration
7/30 US FOMC (with Press Conference)
8/1 US Non-Farm
8/1 US Tariff Deadline (per Trump)
Markets will have to really love a slew of good earnings and good news to see more highs and melt-ups through this typically bumpy season (Aug-Sep)
Thanks for watching!!!

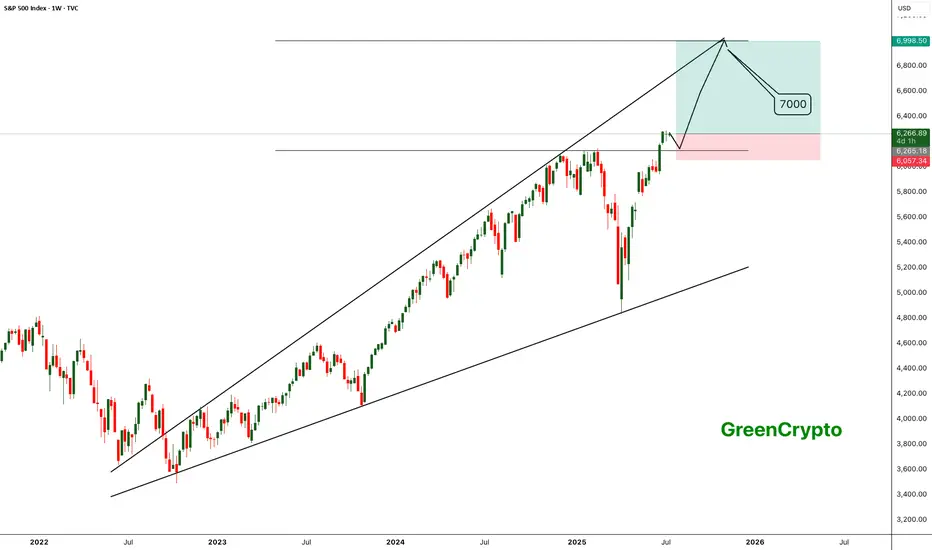
SPX - Next Target is 7000- SPX is currently trading around 6200 after breakout previous all time high.
- Price has formed a nice broadening wedge pattern and currently heading towards the next resistance line.
- We can expect a slight correction upt o 6100, and reversal towards 7000.
- I'm expecting SPX to hit 7000 target by Q1 of 2026.
Trade Opportunity
Entry: 6200
TP1: 6400
TP2: 6600
TP3: 6800
TP4: 7000
SL at: 6057
Stay tuned frequent updates
Cheers
GreenCrypto
SPX looking brittleSPX seems to showing signs of cooling, noting by the 50/200 SMA lines clearly show this. Also, lower highs. Don't wait until you're in the red to sell! Remember that retailers have been buying and institutions have been offloading stocks. Someone will be holding the bag!

S&P 500: Defying Tariff Headwinds, Breaking RecordsThe S&P 500 has staged a remarkable rally in 2025, shattering all-time highs and capturing global attention. This surge has unfolded despite the negative economic overhang of renewed tariff threats and ongoing trade tensions, raising critical questions for investors: How did the market overcome such headwinds, and what lies ahead for both the short and long term?
The Rally Against the Odds
Tariff Turbulence: Earlier this year, President Trump announced sweeping new tariffs, sparking fears of supply chain disruptions and higher costs for American companies. Historically, such moves have triggered volatility and corrections.
Market Resilience: Despite these concerns, the S&P 500 not only recovered losses from the spring but surged to new record highs, with the index climbing over 23% since April’s lows. Major tech companies, especially those leading in AI and innovation, have been at the forefront of this advance.
Investor Sentiment: The rally has been fueled by optimism around potential Federal Reserve rate cuts, robust corporate earnings, and expectations of long-term economic growth—even as the immediate impact of tariffs remains uncertain.
Short-Term Correction: A Healthy Pause?
While the long-term outlook remains bullish, several indicators suggest the market may be due for a short-term correction:
Narrow Market Breadth: The current rally has been driven by a handful of mega-cap stocks, leaving the median S&P 500 stock well below its own 52-week high. Historically, such narrow leadership often precedes periods of consolidation or pullbacks.
Valuation Concerns: Stock valuations are at elevated levels, and some analysts warn that earnings growth could slow as companies adapt to higher input costs and shifting trade policies.
Correction Forecasts: Some strategists predict the S&P 500 could correct to around 5,250 by the third quarter of 2025, citing factors like slowing consumer spending and persistent policy uncertainty.
Long-Term Outlook: Higher Highs Ahead
Despite the potential for near-term volatility, the long-term trajectory for the S&P 500 remains positive:
Fed Policy Tailwinds: Anticipated rate cuts and lower bond yields are expected to provide further support for equities, encouraging risk-taking and higher valuations.
Corporate Adaptation: Companies are actively offsetting tariff impacts through cost savings, supply chain adjustments, and strategic pricing.
Growth Sectors: Innovation in technology, productivity gains, and deregulation are setting the stage for sustained profit growth, especially in sectors like AI, robotics, and defense.
Key Takeaways for Investors
Stay Disciplined: While a short-term correction is possible, history shows that markets often rebound strongly after periods of volatility.
Diversify Exposure: With market gains concentrated in a few names, diversification and active stock selection are more important than ever.
Focus on Fundamentals: Long-term investors should look beyond headlines and focus on companies with resilient earnings and adaptive business models.
The S&P 500’s ability to break records in the face of tariff headwinds is a testament to the underlying strength and adaptability of the U.S. economy. While short-term bumps are likely, the path ahead still points toward new highs for those with patience and perspective.
This article is for informational purposes only and does not constitute investment advice. Always consult with a financial advisor before making investment decisions.
#spx500 #stockmarket #analysis #economy #us #nasdaq #fed #bonds #rates #trading

S&P500 Slips Ahead of CPI & Earnings SeasonEquities began the week under pressure, with the S&P 500 dropping 0.5%, slipping below the 6,230-resistance area. Although the Fed minutes released last week indicate that most members are open to cutting rates this year, inflation data and second-quarter earnings could change that trajectory.
Upcoming Events to Watch:
• CPI Release (Tuesday 14:30 SAST): A cooler-than-expected print would support a breakout in risk assets. A hot reading could shift expectations toward policy tightening, weighing on equities.
• Q2 Earnings Season: Major banks including JPMorgan Chase, Wells Fargo, and Citigroup will report this week. Strong earnings may cushion the market, while any weakness could exacerbate volatility.
S&P500 Technical View:
• Immediate Resistance: 6,230
• Potential Upside: A cooler CPI could see the index rally toward 6,290.
• Support Levels: Should inflation surprise to the upside, the index may slide to 6,190, or even 6,150 in extended selling.
