US 500 – A New Record Peak or Reversal in the Week AheadSo far in July, the US 500 has recorded multiple all-time highs on its way to an eventual peak of 6294 on Thursday (July 10th), from which it finally succumbed to some profit taking into the weekend, leading to a small Friday sell off to close at 6255 (-0.4%).
Along the way traders have ignored mixed US economic data, and more importantly they have, for the most part, shrugged off President Trump’s increasingly aggressive approach to tariffs, choosing instead to focus on economic resilience, renewed AI optimism and an improving outlook for the Q2 corporate earnings season that kicks fully into gear in the coming days.
In terms of tariffs, the fact that there is now a new August 1st deadline to concentrate on may be taking away some of the immediate urgency for the announcement of trade deals, although these issues still remain important and on-going, highlighted by President Trump's weekend social media announcement of 30% tariffs on the EU and Mexico, if a better deal cant be reached in the next 3 weeks.
With regard to corporate earnings, the major US banks like JP Morgan (Tuesday before the open) and Bank of America (Wednesday before the open) report this week. Both company’s share prices have seen strong gains since the April lows, so traders will be eagerly awaiting their actual numbers. They will also be keen to hear the thoughts of the bank CEOs on future earnings, bad debt provisions and the potential impact of Trump’s tariffs on the US economy moving forward. Only last week, Jamie Dimon, CEO of JP Morgan, warned market complacency towards potential tariff risks.
In terms of scheduled economic data. Tuesday’s US CPI (1330 BST) and Wednesday’s PPI release (1330 BST) stand out. Traders are sensitive to US inflation updates and have been watching over the last several months for signs that tariffs are pushing up prices. So far this hasn’t been the case but these new releases may tell a different story.
All of these issues could impact risk sentiment and the direction of the US 500 index in the next 5 trading days. Certainly, the early open has been impacted by President Trump's weekend tariff announcement, with the US 500 currently down 0.46% at 6227 (0800 BST).
The technical outlook could also be an important factor in determining price moves.
Technical Update: Assessing the Move to A New Record High
Last week appears to have seen a slowing in the speed of the recent price strength, but a new all-time high was still posted at 6294 on Thursday. It could be argued that this activity maintains what is still a more constructive pattern of higher price highs and higher price lows that have materialised since the April 7th downside extreme of 4799.
However, there is no guarantee this price activity will continue to see new all-time highs posted, so we need to be aware of potential support and resistance levels that may influence price activity.
Possible Support Levels:
If last week’s possible slowing in upside price momentum develops into a new phase of price weakness, a support level that traders might now be watching could be 6148.
This 6148 level is equal to both the 38.2% Fibonacci retracement of June 23rd to July 10th strength and the current level of the rising Bollinger mid-average. Closes below 6148 might suggest a more extended phase of weakness back to 6058, the lower 61.8% Fibonacci retracement, possibly further if this in turn gives way.
Possible Resistance Levels:
Having been capped by the 6294 all-time high last week, sellers may continue to be found at this level, so this might prove to be the first potential resistance if fresh attempts at price strength over the coming week develop.
Closing defence of 6294 may need to be watched if challenged, as successful breaks above this level might suggest an extension of the uptrend pattern currently evident in price activity. Such closing breaks higher may well suggest price strength towards 6418, the 200% Fibonacci extension level of the recent price decline.
The material provided here has not been prepared accordance with legal requirements designed to promote the independence of investment research and as such is considered to be a marketing communication. Whilst it is not subject to any prohibition on dealing ahead of the dissemination of investment research, we will not seek to take any advantage before providing it to our clients.
Pepperstone doesn’t represent that the material provided here is accurate, current or complete, and therefore shouldn’t be relied upon as such. The information, whether from a third party or not, isn’t to be considered as a recommendation; or an offer to buy or sell; or the solicitation of an offer to buy or sell any security, financial product or instrument; or to participate in any particular trading strategy. It does not take into account readers’ financial situation or investment objectives. We advise any readers of this content to seek their own advice. Without the approval of Pepperstone, reproduction or redistribution of this information isn’t permitted.
SP500FT trade ideas

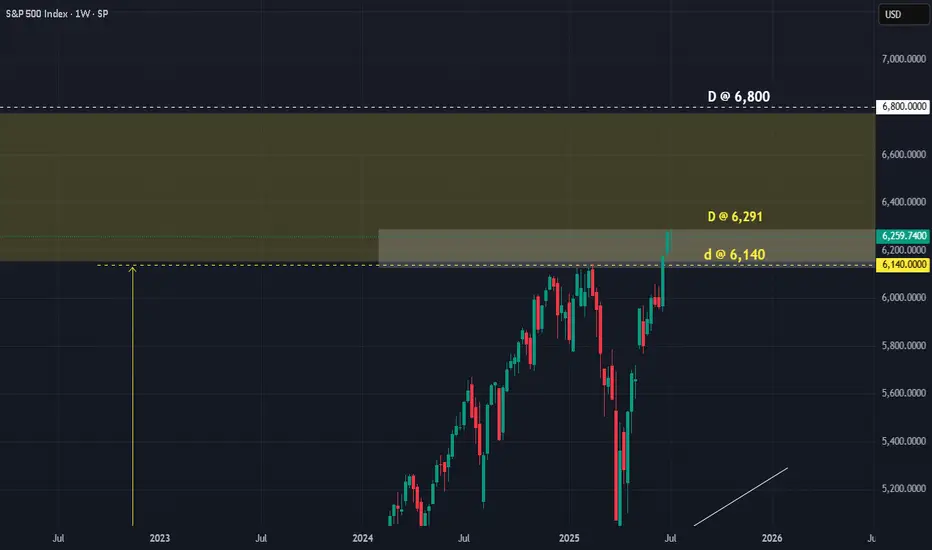
SPX : How to play this DPrice has now reached our target as anticipated. The question is, when do we SELL?
Anyway, for those who follow the D, I am sure it has saved you guys a lot of trouble. At least you know where/when to start SELLING. Many others who started selling EARLy had all lost their money.
As we can see, there are 3 D's. Price can still move UP to 6,800. Bear that in mind. Or has already reached the max at 6,291!!!
Price is at where they are, there are 2 choices:
a) SELL now and SL @ 6,300
b) SELL when price touched the lower D @ 6,140 with SL @ 6,291
Whichever way, the R/R is still FANTASTIC.
It is true that MARKET MAKER might still take advantage and try to screw short sellers. But even they would find it hard at the D. For even they need to respect it a bit.
If you know your D, you trade safer.
Good luck.
SP500, above the GAP bullish, below the GAP…As simple as it can be. Below the GAP, very bearish.
Ideally, a sharp move down would confirm
My bias.

$SPXSP:SPX Update:
Rumors of Powell possibly resigning as Fed Chair have created uncertainty among buyers.
But if inflation stays low even with tariffs we might see longer holds.
If Powell does step down, markets could actually rally on hopes of upcoming rate cuts.
📉📈
Now we wait for the inflation report…

SPX: earnings sentiment aheadPrevious week was another optimistic week on financial markets. Regarding the approaching deadline for a delay in the application of trade tariffs set by the US Administration, which came due on July 9th, the market did not show much of a concern. The green trend line of the S&P 500 continued during the week, where the index managed to reach another new all time highest level on Thursday, at 6.290. During the previous week there has not been any currently important US macro data posted, in which sense, the market sentiment remained optimistic. However, Friday's news regarding trade tariffs spoiled a bit of an up-trend, so the index ended the week, just a bit lower from its ATH level, at 6.259.
Weekly tariffs news include a 35% imposed tariffs on imports from Canada, and 50% on goods imported from Brazil in the U.S. There are also some comments on a potential increased universal 10% tariff on the majority of other nations, noting 15% and 20%, as well as a 50% tariff on copper. Analysts are noting that the market is already adjusted to the comments regarding trade tariffs, in which sense, there are no more strong market reactions on any incoming news.
The week ahead brings some important US macro data, as well as gearing up for the earnings season, starting with major banks like JPMorgan. The June inflation data as well as PPI will be posted in the week ahead, closing with University of Michigan Consumer Sentiment. This data might bring back some volatility to the S&P 500, however, the general investors sentiment remains positive at this moment.
SP500 weekly balance?JUst some ideas while looking at weekly charts. We've put in a doji on the week - indecision. A pullback to 6100 would start raising flags about a possible false breakout from balance.

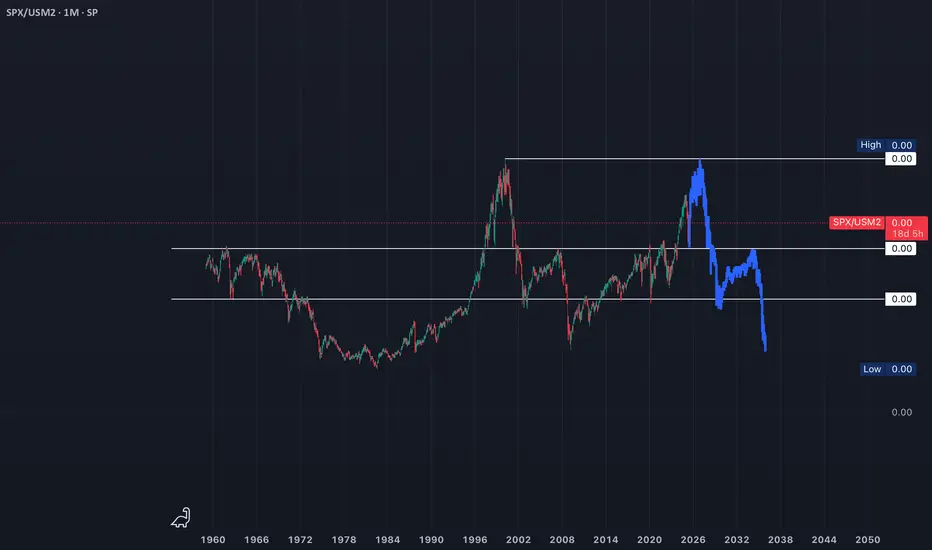
Is SP500 / US M2 Money Supply telling us a story?Historically this ratio has inflected from key levels. Last week the upper boundary of what 8 would call a normal range has acted as support. If history rhymes to dot com bubble, this AI bubble can bounce from these levels and see an increase until Q4 2026, then a sharp fall will follow. To the lower boundary of that normal range.
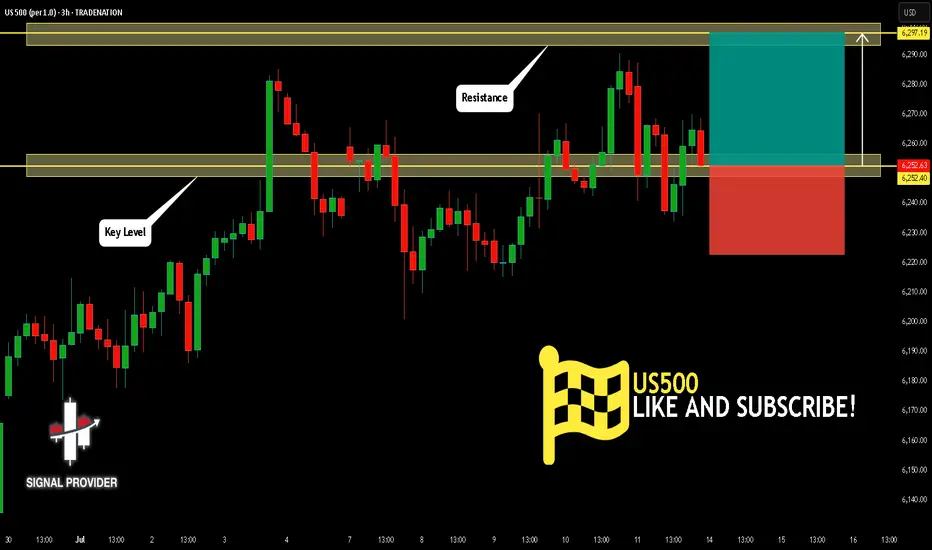
US500 Is Bullish! Long!
Here is our detailed technical review for US500.
Time Frame: 3h
Current Trend: Bullish
Sentiment: Oversold (based on 7-period RSI)
Forecast: Bullish
The market is trading around a solid horizontal structure 6,252.40.
The above observations make me that the market will inevitably achieve 6,297.19 level.
P.S
Overbought describes a period of time where there has been a significant and consistent upward move in price over a period of time without much pullback.
Disclosure: I am part of Trade Nation's Influencer program and receive a monthly fee for using their TradingView charts in my analysis.
Like and subscribe and comment my ideas if you enjoy them!
SPX500 in a Powerful Wave 3 Expansion – New Highs on the HorizonMarket Analysis – SPX500 (S&P 500 Index CFD)
The SPX500 is currently exhibiting a strong bullish structure, consistent with the characteristics of an Elliott Wave 3 extension. This wave phase is typically the most powerful and impulsive part of a bullish cycle, often driven by increasing market confidence, strong macroeconomic fundamentals, and institutional accumulation.
After completing a textbook corrective Wave 2, the index has broken key resistance levels with strong momentum, confirming the beginning of Wave 3. What sets this phase apart is its capacity to generate accelerated gains, often surpassing expectations and historical highs.
Key signs supporting the Wave 3 hypothesis:
High volume breakout from consolidation zones.
Higher highs and higher lows structure on multiple timeframes.
Confirmation from supporting indicators such as RSI holding above 50 and MACD showing strong upward momentum.
What’s next?
As long as market structure remains intact and no significant bearish divergence appears, we can expect multiple new all-time highs to be formed during this wave. Traders should look for retracement entries using Fibonacci levels (e.g., 38.2% or 50% pullbacks) to ride the trend while managing risk carefully.
Outlook:
Bullish bias remains strong. Strategic buying during minor corrections could offer favorable risk-reward setups throughout the progression of this wave.

SPX500 SPX appears to be running SSL. 4H levels identified. Looking for Break & retest. If support does not hold on to any level, expect the bulls to return and take over.

IS THE STOCK MARKET HEADING INTO DOT COM BUBBLE 2.0?In this video we look at the 3 month chart of SP:SPX using the traders dynamic index & Fibonacci retracement levels to put together a bullish case for the overall stock market to go on a monster rally over the next 7 years
We also theorize about how over the next 2 years the SP:SPX can indeed hit 7200+ by Q3 2026 and have pullbacks to 5800-6100, but how that could just be the "consolidation move in price" of the overall stock market before we get what could end up being the largest stock market rally we have ever seen in the 21st century

ASCENDING WEDGE ON WATCH - ELLIOTT WAVE 3 NEARLY COMPLETEThe WAVE 3 extension can go further but it seems likely that coinciding with earnings this month we will have the potential for the start of WAVE 4 retracement.
The possible resignation of Jerome Powell could further intensify the charts.
AlphaTrend is an advanced trading indicator that leverages proprietary tools, real-time data, and custom metrics to give traders a competitive edge. Designed for all experience levels, it works instantly—no advanced charting skills required.
ADVANCED and PRO versions are available. (See below)
🔍 How It Works
At the core of AlphaTrend is Dynamic Reversion Bands — a sophisticated real-time system that adapts to price action by automatically adjusting to evolving market conditions.
These bands act like a roadmap, helping traders identify:
Mean reversion trade opportunities
Trend strength
Emotion-driven market conditions (like FOMO)
The system is rooted in Mean Reversion Theory:
If an asset's price deviates significantly from its historical average, it tends to “revert” back to that average over time. Traders can use this behavior to spot potential buying or selling opportunities:
Overbought Conditions: If the price moves too far above the mean, it may signal a pullback—traders might sell or short.
Oversold Conditions: If the price drops well below the mean, it may be undervalued—traders might buy in anticipation of a bounce.
⚪🟡🔴🟡⚪ Dynamic DOTS
AlphaTrend visualizes market overextension through dynamic DOTS:
White DOTS = Average conditions
Yellow DOTS = Above average conditions
Red DOTS = Extreme conditions
The DOTS update in real time as the candle is forming—appearing, disappearing, and shifting color based on current intensity levels. Once the candle closes, however, the DOTS do not repaint. This ensures clarity and confidence in every signal.
This is crucial, as many indicators repaint and revise data after the fact, undermining traders’ trust. With AlphaTrend, once a candle closes, the data remains permanently fixed.
📊 Adaptability and Market Insight
AlphaTrend adapts to any timeframe, but performs best on longer-duration candles, where signals are fewer but more reliable. Multi-interval displays (e.g., 1hr, 4hr, Daily) are highly recommended. That being said it does tend to give strong signals on all time frames even down to 1 min candles.
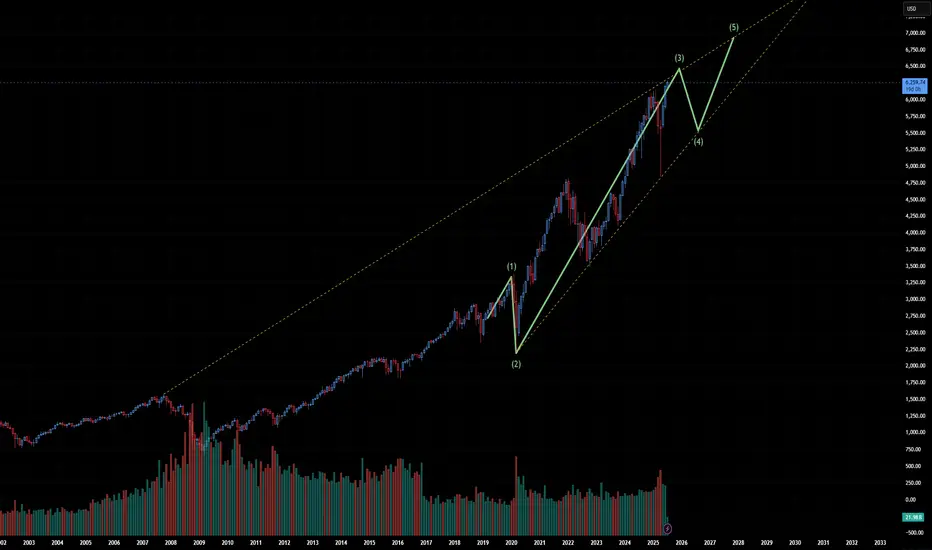
S&P 500 - Medium Timeframe AnalysisAs illustrated, we appear to be in the final wave to the upside. At this stage, I’m treating Wave 5 as a standard impulse. However, given that Wave 4 retraced deeply, nearly to the termination point of Wave 1, there remains a modest possibility that this higher-degree Wave 5 in gray, which began in 2020, could ultimately unfold as an ending diagonal. That said, this scenario remains highly unlikely, as the internal structure of the preceding waves does not exhibit the characteristics of corrective price action.

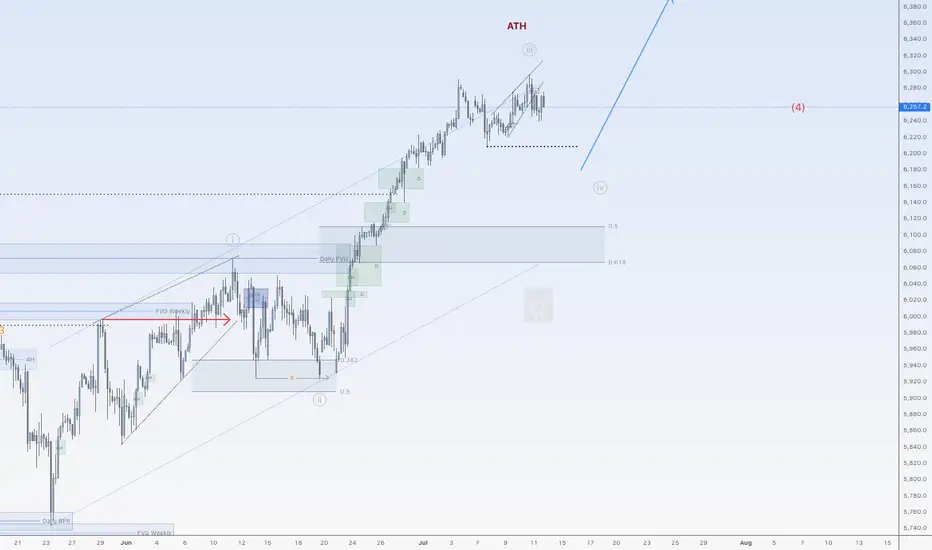
More upside after correction for SPX500USDHi traders,
Last week SPX500USD went a little more up (diagonal) just as I've said in my outlook.
Next week we could see the start of a bigger correction down (grey wave 4) and a break of the dotted trendline. Or the diagonal is a leading diagonal wave 1 and grey wave 3 extends more.
Let's see what the market does and react.
Trade idea: Wait to see if price breaks the dotted trend line (for shorts) or not (for longs).
If you want to learn more about trading FVG's & liquidity sweeps with Wave analysis, then please make sure to follow me.
This shared post is only my point of view on what could be the next move in this pair based on my technical analysis.
Don't be emotional, just trade your plan!
Eduwave
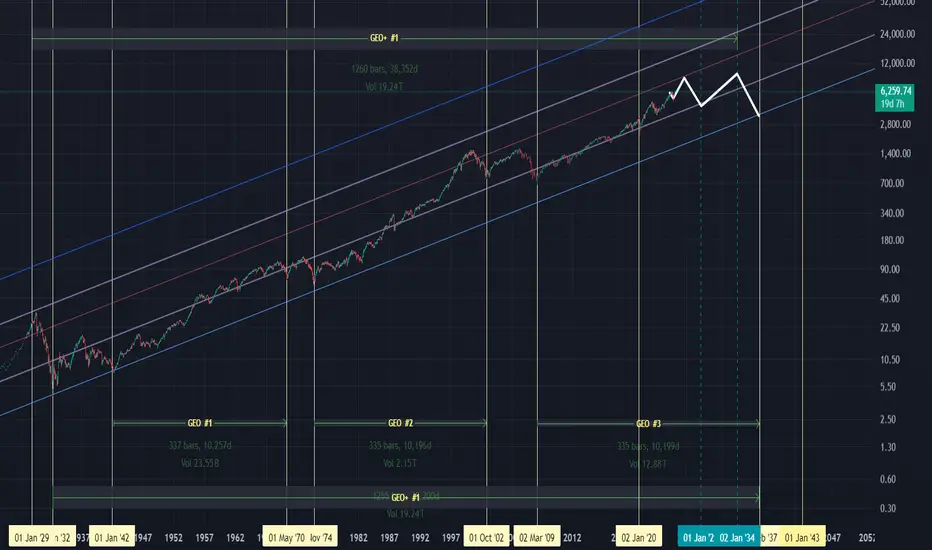
SPX GEO+ Cycle Update: "SPX: April Low Called, Target 8000+"SPX GEO+ Cycle Update: April Low Called Precisely (Next Target: 8000)
On January 5th, 2025, when SPX was trading at 5942, I published an analysis in Italian using my GEO+ Cycle methodology that made two specific projections:
📉 A low around 5000 in April 2025
📈 Then an advance targeting 8000 by 2026
Update: April delivered exactly as projected.
The geometric patterns suggested April would mark a significant turning point, and the market found strong support right in the anticipated zone and timeframe.
About GEO+ Cycles:
After 15 years studying market geometry, I've developed a framework that identifies multi-decade structural patterns. These aren't traditional technical indicators—they're mathematical relationships that help project major turning points with remarkable precision.
Current Phase:
We're now in the advancing phase of this cycle. Based on geometric projections, the target window for 8000 remains January 2026.
Important Context:
This represents cycle analysis for educational purposes, not trading advice. The methodology focuses on identifying major structural turning points rather than short-term movements.
What's Next:
I'll continue tracking this cycle's development and provide updates as we approach key geometric levels.
For those interested in learning more about geometric market analysis, feel free to follow for updates on this and other cycle progressions.
The mathematics of market geometry continue to unfold...
Note: Originally published in Italian, now sharing these insights with the global TradingView community.
Macroeconomic analysis of the American marketHello investor friends,
today I bring an update on the macro economic state of the American economy which generally moves markets around the world.
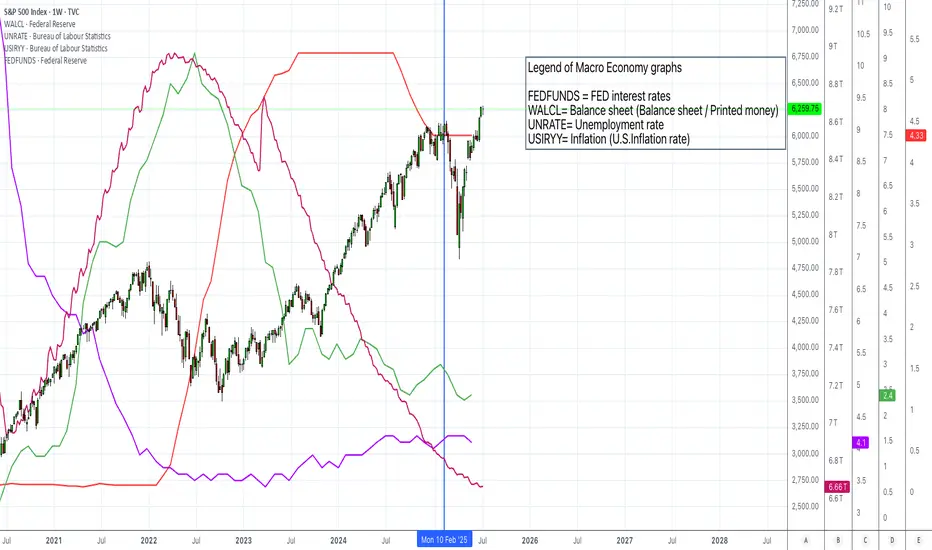
From the graph we can see the S&P 500 index on which 4 lines have been superimposed which coincide with:
- FED interest rate
- FED balance sheet
- US inflation rate
- US unemployment rate
The vertical line on the graph coincides with the date of the last update I made 5 months ago.
The central bank decides interest rates and the injection of money with the aim of keeping inflation low and avoiding too much unemployment.
At the moment we have:
- Unemployment rate at 4% (remained unchanged)
- Inflation at 2.4% (decreased compared to 5 months ago)
- The balance / release of printed money (continues to fall)
- The interest rate remained unchanged (current 4.33%)
Compared to 5 months ago the situation seems to have improved and is quite stable. The FED has decided to keep rates unchanged due to political issues as it would like to see clearly before making cuts.
In general we can say that the situation seems quite good as, unemployment is low, inflation is at optimal levels, we see that the budget/money injection is decreasing and therefore leads to maintaining regular inflation and finally the interest rates being stable maintain a low level of unemployment.
Given these factors we see that since the last update 5 months ago (i.e. in February), in the following weeks there was a collapse due to Trump's policies but that it was certainly an excellent opportunity to increase positions given that the macroeconomic situation was positive as it currently is.
From today we could certainly expect further declines due to other monetary policies or other news, but as long as the macro situation is positive we have no reason to worry.
👍 Like if you want more macro updates in the future
🙋♂️ Follow me so you don't miss my future analyses
⚠️ Disclaimer: This post is for informational purposes only and does not constitute financial advice. Always do your research before making investment decisions.
SP:SPX FRED:SP500 VANTAGE:SP500 AMEX:SPY VANTAGE:DJ30 AMEX:DIA CME_MINI:NQ1! FX:NAS100 NASDAQ:QQQ FX:EUSTX50 FOREXCOM:GER40 FX:AUS200
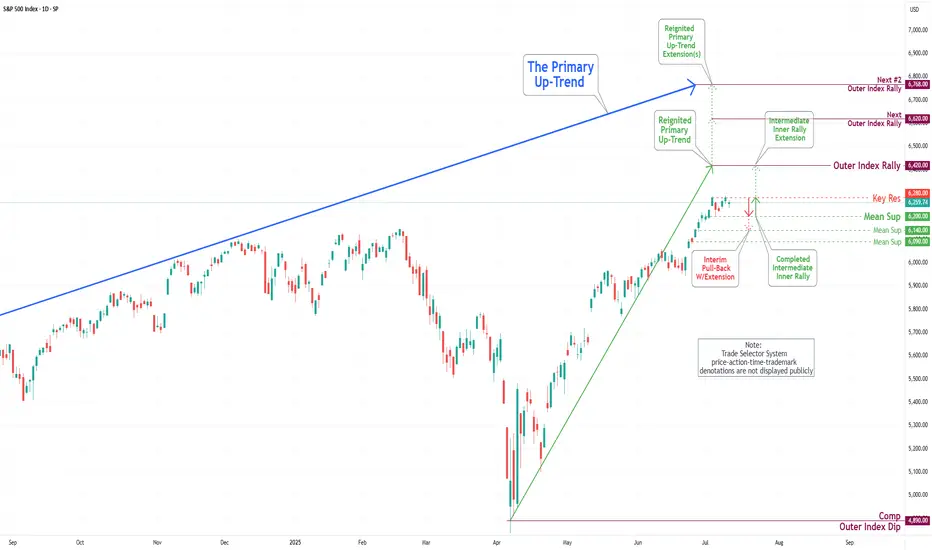
S&P 500 Daily Chart Analysis For Week of July 11, 2025Technical Analysis and Outlook:
During this trading week, the S&P 500 Index has shown a predominantly downward/upward course of action and created a new Key Resistance at 6280. Currently, the index exhibits a bullish bias, with the Outer Index Rally objective set at 6420. However, it is crucial to note that the current price action may cause prices to see in a new light from their current fluctuation to push toward the Mean Support at 6200 before resuming their upward movement.
Possible Wyckoff top on US500I'll be looking for this wyckoff formation on US500.
Of a new ATH is forming in the next few days and we have a stong sell off, I'll be taking the short on the Test of the Spring.

SP500 TECHNICAL ANALYSIS 30 MINUTE TIME FRAME 📊 Technical Analysis – SP500 CFD (30-Minute Chart)
✅ 1. Overall Market Trend:
The market is currently in a range-bound structure after a sharp upward move toward the 6,296 level.
Price entered a clear supply zone and reversed sharply.
Multiple BOS (Break of Structure) and CHoCH (Change of Character) events indicate clear shifts in price behavior.
📌 2. Key Structure Zones:
🟩 Demand Zones:
6,240–6,250: First active demand zone — could trigger bullish reactions.
6,180–6,200: Deeper liquidity zone within the Discount area, ideal for long setups if tested.
Price is approaching equilibrium and preparing for a potential reaction.
🟥 Supply Zones:
6,290–6,300: This premium zone caused the recent rejection and is currently acting as short-term resistance.
📈 3. Price Action & Candles:
Price created a rising wedge near the highs, which broke down.
Strong bearish candles followed, breaking key short-term structure levels.
Price is now heading into the equilibrium zone and testing demand.
📌 4. Possible Scenarios:
🔻 If Price Falls:
Watch for a reaction at the 6,240–6,250 demand zone.
If this area breaks, the next downside target is 6,180–6,200 — a high-probability liquidity zone.
🔺 If Price Rebounds:
A bullish reaction from the current zone could send price back toward 6,270+.
A confirmed break of 6,296 would open the door to higher highs.
🧠 Summary Table:
Condition Analysis
Current Status In corrective phase after bullish impulse
Short-Term Trend Bearish structure active (BOS, CHoCH present)
Key Support 6,245 → 6,180
Key Resistance 6,290–6,300
Buy Opportunity Bullish confirmation at demand zones
Sell Opportunity Weak reactions or breakdowns below BOS
⚠️ Disclaimer:
This analysis is for educational purposes only and does not constitute financial advice or a buy/sell signal.
Always trade based on your personal strategy and risk management plan.
VANTAGE:SP500

S&P 500 - Micro Count Ew AnalysisThis is my lower timeframe analysis. Price has now reached the ideal target area for Wave 3, suggesting that a corrective phase may soon follow. This potential retracement could also align with broader market reactions to a possible announcement from Trump regarding new tariffs on Russia this coming Monday.
P.S. The macro count and higher timeframe outlook will be shared later.

The S&P 500 Is Hitting New Highs, But Its Charts Look MixedThe S&P 500 SP:SPX has made a series of new all-time closing and intra-day highs in recent days as Wall Street staged a remarkable comeback from the April lows that followed President Donald Trump's announcement of "Liberation Day" tariffs. Does fundamental and technical analysis say the key index could go higher from here ... or pull back?
Let's check it out:
The S&P 500's Fundamental Analysis
The SPX fell more than 21% intraday in less than seven weeks between its Feb. 19 peak and its April 7 low as Trump rolled out his plan for big tariffs on foreign imports.
Many investors feared that high import duties -- coupled with foreign retaliatory tariffs on American exports -- would boost U.S. inflation and unemployment at the same time, creating "stagflation."
But about a week after Trump rolled out the "Liberation Day" tariffs on April 2, the president paused much of the plan for 90 days to allow for trade talks with other countries.
Risk-on assets quickly started to come back as Wall Street began to think deals with trading partners might blossom. So far, only the United Kingdom, China and Vietnam have played ball, but that's been good enough for many investors.
Meanwhile, consumer-level U.S. inflation has largely been beaten back (at least for now), and Trump has had other economic victories as well.
For example, his "Big, Beautiful Bill" of tax cuts and spending changes recently passed into law, offering what many see as multiple pro-growth provisions.
True, the Congressional Budget Office warned that the Big, Beautiful Bill could add some $3.3 trillion to the U.S. government's already huge deficits over the next decade. However, the agency's projections didn't include $2.8 trillion of expected revenues over the next 10 years from Trump's tariffs.
The CBO also chose to model almost no economic growth over the next decade, which probably isn't very realistic.
Of course, it's still unclear whether Wall Street has already priced in all of the "Big, Beautiful Bill" potential positives, or whether the measure's tax cuts and deregulation will have their desired economic effects.
Similarly, we don't know whether there are any more bilateral trade deals around the corner, or whether the Federal Reserve will soon cut interest rates -- which could boost stocks by making bond and money-market yields less attractive.
The S&P 500's Technical Analysis
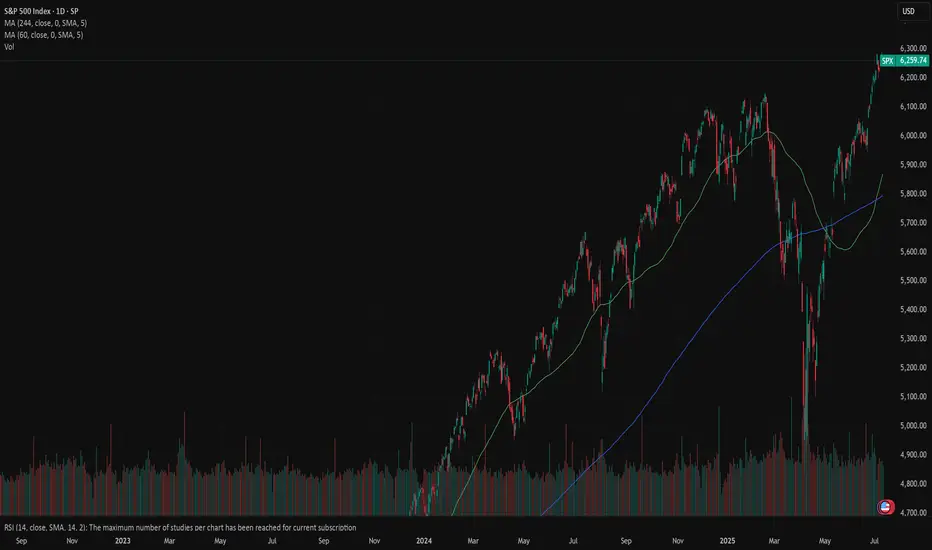
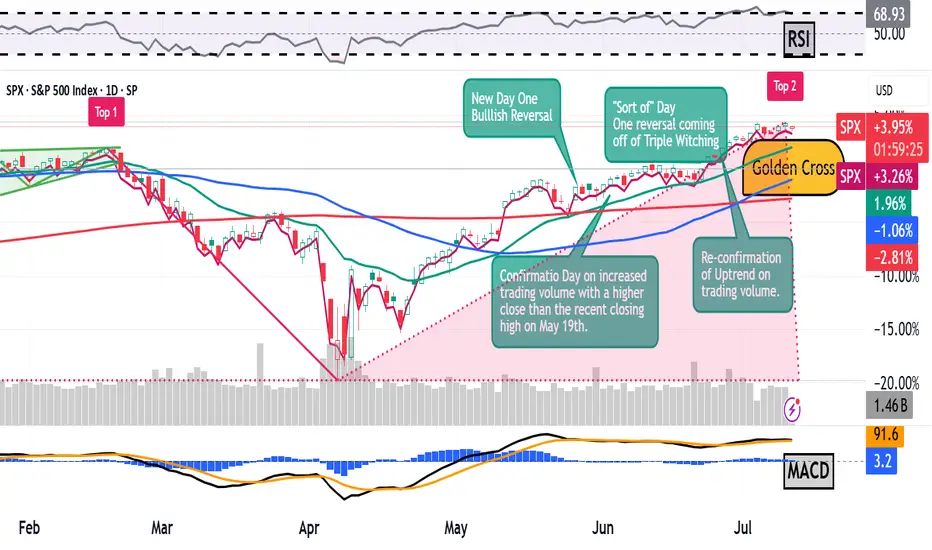
Now let's look at the SPX's chart going back some four months and running through midday Tuesday:
Readers will see that the S&P 500 has been in a clear uptrend for the past three months, as denoted by the orange- and purple-shaded areas above.
The index has colored neatly within the lines, finding support at the lower trendline in mid-June. Additionally, support came at the S&P 500's 21-day Exponential Moving average, or "EMA, marked with a green line above.
More recently, the S&P 500 also enjoyed the benefits of what we call a "golden cross." That's when the index's 50-day Simple Moving Average (or "SMA," marked with a blue line) crosses above a rising 200-day SMA (marked with a red line). That's historically a bullish technical signal for the index.
The S&P 500 also experienced "Day One" bullish reversals on May 27 and June 23. Those "Day Ones" were then confirmed on June 3 and June 26, respectively.
A "Day One" reversal occurs when an index reversed direction up or down on increased trading volume, followed by a "Confirmation Day" that moves the market in the same direction as the reversal on increased volume as well. That combination typically signifies changes in an index's short-term trend.
Now, astute readers might notice that the S&P 500's June 23 "Day One" reversal occurred on decreased day-over-day trading volume.
However, that's misleading because the market day just prior to June 23 was a "triple-witching" day, which technical analysts therefore discard.
Readers should also understand that there must be at least a one-day pause between a "Day One" reversal and a "Confirmation Day." Otherwise, technical analysts will consider both days to represent one move, and we wouldn't have a volume-based technical confirmation.
Next, let's look at the SPX's chart going back to January and running through midday Tuesday:
This chart shows that the S&P 500 is in danger of putting in what's called a "Double Top" pattern of bearish reversal, denoted with the red boxes above marked "Top 1" and "Top 2." With all that's going on politically and geopolitically, that's a concern.
On top of that, Q2 earnings season begins next week, and analysts' consensus is for rather paltry 5% year-over-year earnings growth for the S&P 500 component companies as a whole.
In addition, the S&P 500 has a conflicting Relative Strength Index ("RSI") and Moving Average Convergence Divergence indicator (or "MACD").
The index's RSI, marked with gray lines at the above chart's top, is practically at technically overbought levels.
But at the same time, the daily MACD (marked with black and gold lines and blue bars at the chart's bottom) is showing signs of weakness.
The histogram of S&P 500's 9-day EMA (the blue bars) is now below the zero-bound, which is historically a short-term bearish technical signal.
On top of that, the 12-day EMA (the black line) is threatening to cross under the 26-day EMA (the gold line). This hasn't happened yet, but would be a short-term bearish signal if it did.
Add it all up and the S&P 500 is showing a mixed technical picture right now despite trading at or close to all-time record highs.
(Moomoo Technologies Inc. Markets Commentator Stephen “Sarge” Guilfoyle had no position in S&P 500-related ETFs or mutual funds at the time of writing this column.)
This article discusses technical analysis, other approaches, including fundamental analysis, may offer very different views. The examples provided are for illustrative purposes only and are not intended to be reflective of the results you can expect to achieve. Specific security charts used are for illustrative purposes only and are not a recommendation, offer to sell, or a solicitation of an offer to buy any security. Past investment performance does not indicate or guarantee future success. Returns will vary, and all investments carry risks, including loss of principal. This content is also not a research report and is not intended to serve as the basis for any investment decision. The information contained in this article does not purport to be a complete description of the securities, markets, or developments referred to in this material. Moomoo and its affiliates make no representation or warranty as to the article's adequacy, completeness, accuracy or timeliness for any particular purpose of the above content. Furthermore, there is no guarantee that any statements, estimates, price targets, opinions or forecasts provided herein will prove to be correct.
Moomoo is a financial information and trading app offered by Moomoo Technologies Inc. In the U.S., investment products and services on Moomoo are offered by Moomoo Financial Inc., Member FINRA/SIPC.
TradingView is an independent third party not affiliated with Moomoo Financial Inc., Moomoo Technologies Inc., or its affiliates. Moomoo Financial Inc. and its affiliates do not endorse, represent or warrant the completeness and accuracy of the data and information available on the TradingView platform and are not responsible for any services provided by the third-party platform.
S&P 500 (CASH500) Short - Head and shoulders H1Potential short on S&P 500.
Risk/reward = 3.4
Entry = 6264.9
Stop loss = 6280.3
TP level 1 = 6221.7 (50%)
TP level 2 = 6200.5 (50%)
Need current candle to close back in range at 10.00 for all variables to be met.
Volume exception applied since current candle is the open of European markets.
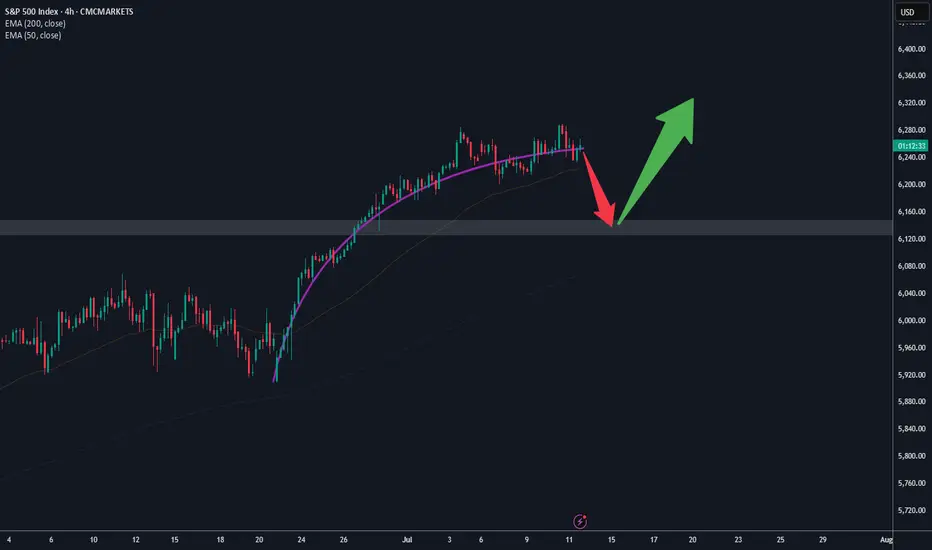
Short Term Risk On S&PMomentum is slowing on the S&P 500.
HT still looking nice.
Short term chance of a correction to around 6140 - conservative, potentially to 6070 if we see a deeper sell off.
Wouldn't want to be a buyer until we see a pullback like this or some strength.