Warning: SPX500 May Have Peaked—Here’s What the Charts SayThe S&P 500 (SPX500) may have reached its peak. In this video, I reveal the technical evidence pointing to a potential reversal—including monthly bearish divergence, daily and weekly reversal candles, and confirmation from key indicators.
This isn’t just noise—these signals align across timeframes, suggesting a shift in momentum that could lead to significant downside. I’ll walk you through the charts, explain the implications for traders and investors, and highlight critical support levels to watch.
Thank you for watching and have a great trading week. Cheers!!
SP500FT trade ideas

S&P500 corrective pullback key support at 6200Key Support and Resistance Levels
Resistance Level 1: 6316
Resistance Level 2: 6374
Resistance Level 3: 6430
Support Level 1: 6200
Support Level 2: 6112
Support Level 3: 6073
This communication is for informational purposes only and should not be viewed as any form of recommendation as to a particular course of action or as investment advice. It is not intended as an offer or solicitation for the purchase or sale of any financial instrument or as an official confirmation of any transaction. Opinions, estimates and assumptions expressed herein are made as of the date of this communication and are subject to change without notice. This communication has been prepared based upon information, including market prices, data and other information, believed to be reliable; however, Trade Nation does not warrant its completeness or accuracy. All market prices and market data contained in or attached to this communication are indicative and subject to change without notice.

SPY Pull back into another earnings week?An engulfing weekly candle is no joke. Sellers are in control.
There is a strong possibility of a pull back and with bias being short, I am looking for a strong LH on the 1/2HR TF to form at 6330 as 50% or 6370- 6375 near the weekly POC.
Confluences for Pull back scenario
- Price bounced off 38.2% fib from 5930 to ATH
- Price found support at 200 ema on 4HR
- 1 HR MACD is building up bullish signal
Have a great week all!

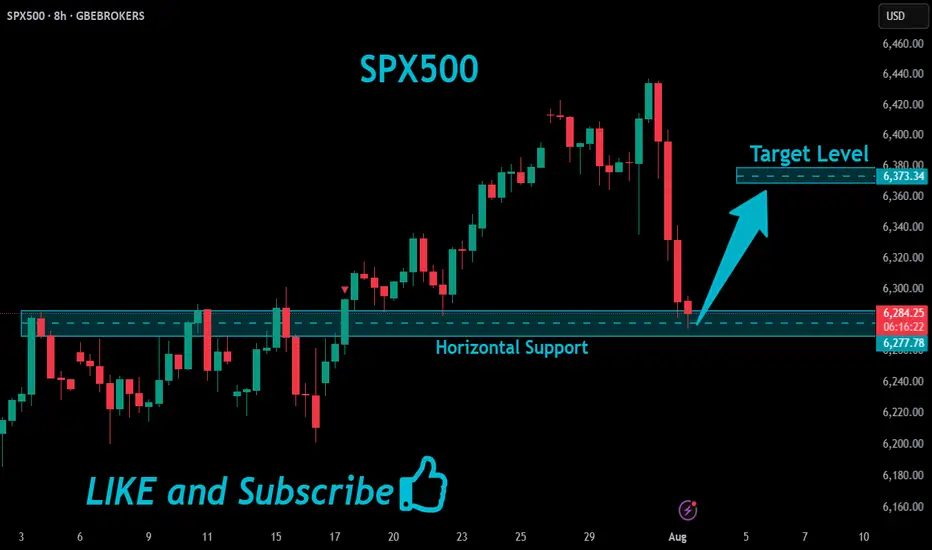
SPX500 Will Go UP!
HI,Traders !
#SPX500 made a retest
Of the horizontal support
Level of 6277.78 and we
Are already seeing a
Bullish rebound so we are
Locally bullish biased and
We will be expecting a
Further bullish move up !
Comment and subscribe to help us grow !
What the Next CPI Print Could Do to the S&P500What the Next CPI Print Could Do to the S&P500
A technical and macro setup ahead of the inflation release
Next week’s CPI report could be one of the most important data points of the quarter, not just for the Fed, but for traders watching the S&P500 (SPX) at these elevated levels.
We’ve seen inflation data act like a volatility trigger in recent months, especially when it diverges from market expectations. And with the S&P flirting with key resistance, the stage is set for either a breakout or a reversal.
Let’s break down both the macro implications and the technical chart setup heading into the release.
Why CPI Matters?
If headline CPI comes in hot, markets may price in fewer Fed cuts this year. Yields spike and SPX often reacts with a sharp pullback.
If inflation cools faster than expected, the Fed may stay dovish. That typically gives SPX and risk assets broadly room to breathe higher.
Current expectations:
- Headline CPI: 3.2 percent
- Core CPI: 3.4 percent
Anything above those numbers is risk-off. Anything below supports the soft landing narrative.
Technical Setup on SPX
On the 4H and daily chart, here’s what we’re seeing:
- Price hovering around a key resistance zone between 5,660 and 5,680
- Rising wedge structure starting to form, typically a bearish sign near market tops
- Bearish RSI divergence on 1D chart
- Volume has been declining on recent pushes higher, showing lack of conviction
Key Levels
- Support: 5,615 and 5,575
- Breakout Target (if CPI is dovish): 5,750 to 5,770
- Downside Target (if CPI surprises hot): 5,500 to 5,480
Watch for a volatility spike on the release and be cautious about chasing the first move.
My Play
I’m personally staying flat heading into the data.
Too much chop, not enough conviction. But I’ll be watching for:
- A false breakout trap above 5,680 followed by reversal as a possible short setup
- Or a clear retest and hold above 5,700 with volume, which may confirm further upside
CPI has become the new FOMC. Be patient and reactive, not predictive.
Final Thought
CPI prints used to be background noise. Not anymore.
This one matters, and SPX is sitting in a technical pressure cooker.
Whatever side you lean toward, come in with a plan and don’t trade the first candle.

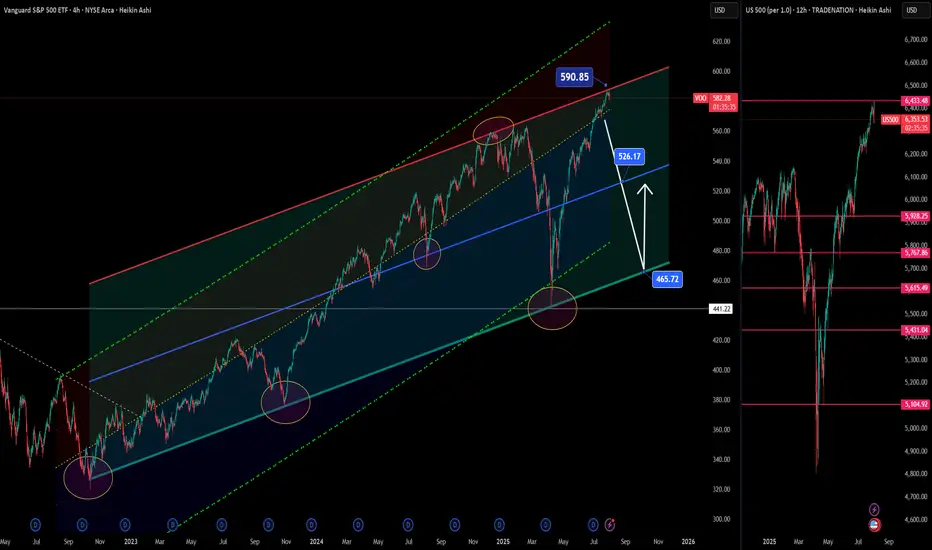
S&P 500 ETF & Index– Technicals Hint at a Possible Correction📉📊 S&P 500 ETF & Index at Resistance – Technicals Hint at a Possible Correction 🔍⚠️
Everything here is pure technicals— but sometimes, the market whispers loud and clear if you know how to listen. 🧠📐
The VOO ETF, which tracks the S&P 500 , has now reached the upper boundary of a long-term ascending channel, once again brushing against resistance near 590.85. This zone has consistently led to major pullbacks in the past.
On the right panel, the US500 Index mirrors this move—pushing toward all-time highs, right as broader sentiment turns euphoric. Technically, both charts are overextended and pressing into key zones.
👀 Potential Path:
🔻 Rejection from current zone ➝ Down toward 526.17, then 465.72 (green support channel)
🔁 Possible bounce after correction — trend still intact long term
And while we’re keeping it technical, it’s worth noting that the Buffett Indicator (Stocks-to-GDP) i s currently screaming “overvaluation.” This doesn't predict timing—but it adds macro context to an already overheated chart setup.
The lesson? Price respects structure. Whether or not the fundamentals are in agreement, the charts are warning that now may not be the time to chase.
History doesn’t repeat, but it often rhymes. Stay sharp, stay technical. 🎯
One Love,
The FX PROFESSOR 💙
ps. the beauty of these levels? Tight Stop loss- excellent R/R
Disclosure: I am happy to be part of the Trade Nation's Influencer program and receive a monthly fee for using their TradingView charts in my analysis. Awesome broker, where the trader really comes first! 🌟🤝📈
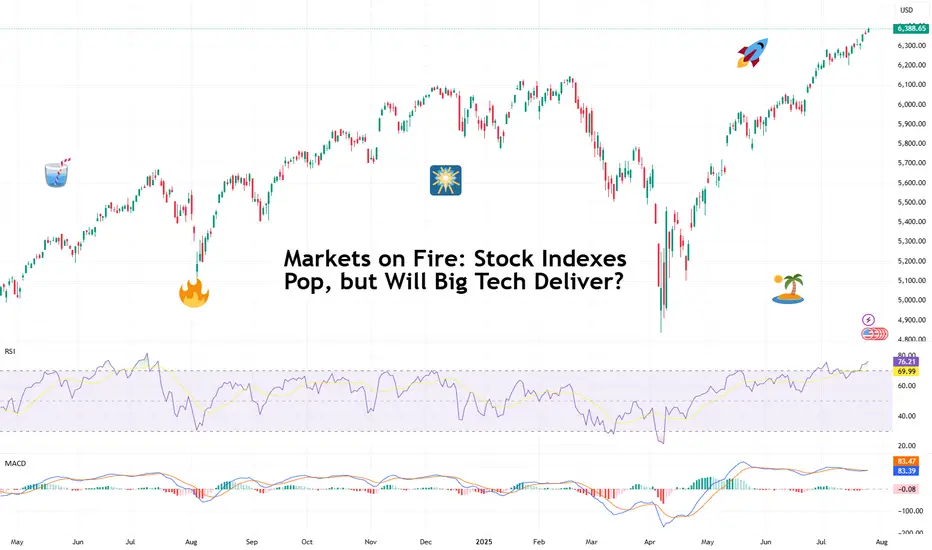
Markets on Fire: Stock Indexes Pop, but Will Big Tech Deliver?S&P 500 and Nasdaq set records. Now it's up to big tech to justify that.
Talk about forward-looking valuation. Tech companies’ valuations are largely based on future potential rather than current performance. And that’s what we’re seeing right now getting priced in across the big indexes.
You’d think we’d be bored of record highs by now. But no — Wall Street keeps hitting refresh on its all-time-high counter. 🎵 Over and over again. 🎵
On Friday, the S&P 500 SP:SPX notched its 14th record close this year, ending at 6,388.64. The Nasdaq Composite NASDAQ:IXIC followed with its 15th at 21,108.32. Even the Dow TVC:DJI — the older sibling who prefers yield over hype — climbed nearly 0.5% to 44,901.92, within a latte’s foam of its December record .
And while indexes are breaking personal bests, investors are buying ahead of some big data deliveries. Why? Because the week ahead is the Super Bowl of Earnings, and the bigger chunk of the Magnificent Seven is up next.
😎 What in the Magnificent Seven?
A highly exclusive club with just seven members, the Mag 7 has entered the earnings spotlight — and the audience isn’t going mild. Traders are pricing perfection, and the script better deliver.
Meta NASDAQ:META kicks things off Wednesday after the close with expected revenue of $44.8 billion and EPS of $5.87. Can Zuckerberg’s AI narrative get investors to forget about the metaverse?
Microsoft NASDAQ:MSFT shows up at the same time, hoping to dazzle with $73.8 billion in revenue and $3.38 EPS. Copilot AI better be doing overtime.
Then on Thursday, again after lights out, Amazon NASDAQ:AMZN joins the chat with its AWS and ecommerce empire expected to pick up $162.1 billion in revenue. Right behind is Apple NASDAQ:AAPL , fighting to stop its slide into meh-land with projected revenue of $89.2 billion and $1.43 EPS. (Fast fact: AAPL is down 12% year to date — among the worst performers in the crew.)
So far, Alphabet NASDAQ:GOOGL already crushed its quarter , posting $96.4 billion in revenue and $2.31 EPS, plus a spicy raise in capex to $85 billion.
Tesla NASDAQ:TSLA ? Not so great. The EV maker reported a 12% revenue drop and a 16% net income decline, spooking investors with a warning of “rough quarters ahead.” The stock is lower by 17% year to date.
Nvidia NASDAQ:NVDA , the AI trailblazer, reports in late August. Until then, it’s chilling on a $4 trillion throne, as per our Top companies rankings, watching its friends sweat it out.
💸 Can the Mag 7 Keep Carrying?
Here’s a harsh dose of reality: the entire S&P 500 is riding on the backs of these seven stocks. Analysts expect them to post 14% earnings growth, while the other 493 companies limp along at 3.4%. Talk about top-heavy things.
So what happens if even one tech titan misses the mark big time and spooks with scary guidance? A market correction? A buy-the-dip opportunity?
And let’s not forget: valuations are stretched. The S&P 500 is now trading at nearly 23x forward earnings (that’s projected profits per share). And the Nasdaq? Don’t even ask. (We’ll tell you anyway — it’s close to 30x). In all that, now’s a great time to keep a close eye on the Earnings Calendar .
📊 Not All Is Big Tech: Fed and Jobs Loom
As if this week wasn’t already packed enough, macro is back on the menu. The Federal Reserve meets Tuesday and Wednesday, and Chair Jay Powell is expected to hold rates steady at 4.5%.
But don’t rule out drama. A single hawkish word and this party could quickly get some rain on. Powell, the man who moves trillions with a simple “Good afternoon,” has a track record of putting markets in their place when they get too euphoric.
And then there’s Friday’s nonfarm payrolls report. Consensus calls for just 108,000 jobs added in July — soft, but not disastrous, and fewer than June’s 147,000 . Blame summer hiring slumps, tariff uncertainty, or the market finally digesting its own hype.
Off to you : Can the Magnificent Seven keep this market magnificent? Or are we about to learn what happens when you ride too close to the sun on AI-generated wings?
SPX500 in Focus – Breakout Needed Above 6346SPX500 – Technical Overview
The price is currently showing bearish momentum as long as it remains below 6341 and 6323, with a downside target at 6283.
🔻 As long as the price trades below 6341, the bearish bias remains intact.
🔼 For the trend to shift bullish, we need a confirmed 1H close above 6346, which could open the path toward 6365 and higher.
🔹 Resistance: 6341, 6365, 6389
🔹 Support: 6298, 6283, 6247

US500: Rebound Setup After Sharp Pullback – Key Support HoldingUS500 has experienced a strong corrective move after an extended bullish run but is now showing signs of stabilizing near a key support area. This zone aligns with both technical retracement levels and the market's reaction to fundamental shifts—particularly the dovish repricing of the Fed following weak US jobs data.
Technical Analysis (4H Chart)
Pattern: After a strong uptrend, price faced a steep correction, forming a potential short-term reversal setup.
Current Level: 6,235, holding above the 6,217 support zone.
Key Support Levels:
6,217 (immediate support; key defense zone for bulls).
6,171 (38.2% retracement, secondary support if deeper pullback occurs).
Resistance Levels:
6,272 (23.6% retracement and initial resistance).
6,360 (upper resistance zone and retest of recent breakdown).
6,429/6,436 (recent high and target if bullish momentum resumes).
Projection: A rebound from current levels could push US500 back toward 6,360–6,430 if support holds.
Fundamental Analysis
Bias: Neutral-to-bullish as macro drivers favor a recovery from pullback.
Key Fundamentals:
Fed Policy: Weak US jobs (+73K) and downward revisions have solidified rate cut expectations (~75% probability in September), boosting equity sentiment.
Inflation: Market awaits US CPI; softer data would further support equities.
Tariffs: While Trump’s tariffs create a medium-term risk for earnings, immediate Fed easing bets outweigh these concerns.
Risk Sentiment: Global risk remains supported by lower yields and optimism about Fed easing.
Risks:
Hot US CPI could reverse cut expectations, pressuring equities.
Geopolitical risks or tariff escalation could trigger renewed selling.
Key Events:
US CPI and PPI.
Fed speeches and rate expectations.
Earnings reports from key US companies.
Leader/Lagger Dynamics
US500 is a leader, driving global risk sentiment and influencing risk-sensitive assets like AUD/USD, NZD/USD, and JPY crosses.
Summary: Bias and Watchpoints
US500 is neutral-to-bullish, stabilizing at key support (6,217) after a sharp correction. Fed cut expectations and risk-on sentiment support the upside scenario, targeting 6,360–6,430 if US CPI aligns with softer inflation. However, a hot CPI print could invalidate this rebound and trigger another leg lower.

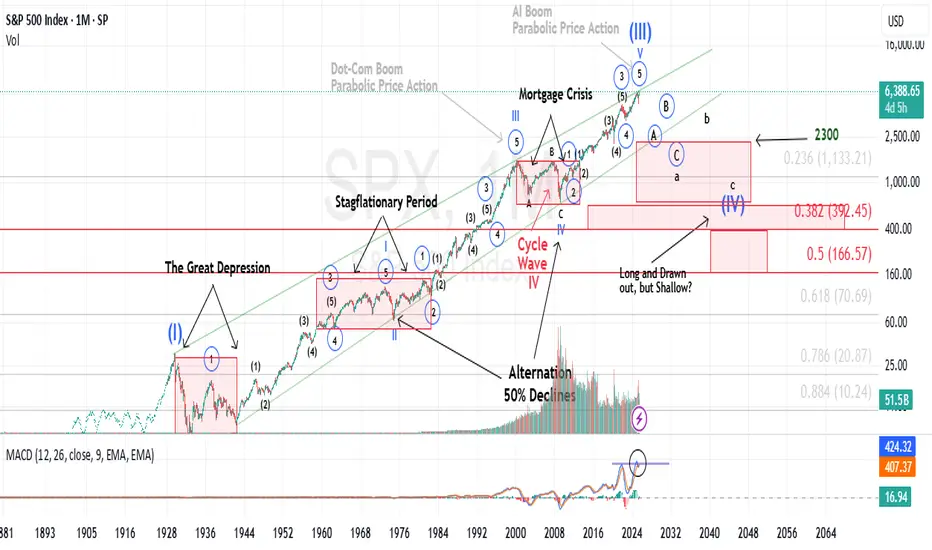
History does not repeat itself, however it tends to rhymeIt’s widely accepted that Mark Twain once said (or wrote) that “history does not repeat itself, however it tends to rhyme”.
Historical Parallels to a Super Cycle Wave (I) Top in U.S. Equities
The road to a major market top is often paved with echoing patterns from the past, and today's landscape bears an uncanny resemblance to pivotal historical events that preceded economic upheaval.
The 1918 Spanish Flu—though less economically damaging in the U.S. than elsewhere, still triggered a 1.5% drop in GDP and a 2.1% decline in consumer spending. The resulting economic weakness, paired with rising inflation, eroded real returns on equities and short-term government bonds for years.
Then came the 1929 stock market crash, the spark that ignited the Great Depression. Driven by a perfect storm of extreme speculation, sky-high valuations, and a regulatory vacuum, the collapse revealed the systemic fragility beneath the euphoria.
Adding fuel to the fire, the Smoot-Hawley Tariff Act of 1930 slammed the brakes on global trade. By sharply raising tariffs on imports, it invited swift retaliatory measures from abroad. The result: a devastating plunge in both U.S. exports and imports, deepening the economic crisis and worsening unemployment. Smoot-Hawley has since become a textbook example of how protectionist policy can magnify economic damage.
Modern Echoes: A Cycle Repeating?
Fast forward to the present and we see unsettling similarities.
The Covid-19 pandemic serves as a modern analog to the 1918 flu, disrupting global supply chains and triggering a steep drop in GDP and consumer spending. Unlike the post-WWI period, however, inflation didn’t precede the crisis, it exploded afterward, fueled by pent-up demand and fiscal stimulus, giving rise to persistent “sticky” inflation....and NOT TRANSITORY.
In a similar inversion of sequence, the Trump-era tariffs—modern-day echoes of Smoot-Hawley, were enacted before any major equity downturn, not after. Still, their long-term impact on global trade and supply chain reliability remains a pressure point for the economy.
Most critically, speculation and valuation excess are again center stage. Just as the roaring ’20s were characterized by euphoric risk-taking, today’s U.S. equity market is trading at record-high P/E ratios, despite rising macroeconomic uncertainty and deteriorating breadth.
These historical and contemporary markers suggest we may be approaching the apex of a Super Cycle Wave (III), a turning point that, like its predecessors, may only be fully recognized in hindsight.
It is my contention, that history is currently rhyming.
Best to all,
Chris
JP Morgan warns the S&P is due a retracement!🚨 Alert 🚨
JP Morgan and Deutsche Bank are the latest to warn that the S&P is due for a correction.
I'm short with a small position size, as the price could move higher yet... Judging by experience, it's near impossible to predict tops. It's best to close long positions or enter smaller-sized short positions with large stops.
VANTAGE:SP500 PEPPERSTONE:US500 ICMARKETS:US500 OANDA:SPX500USD

Good moment to tighten your stop losses!After market reaction to jobs data, it's a good idea to take a look at the indeces and be prepared for a correction, whatever size it is.

SP500 | Short | 3hrsThis technical analysis is for informational and educational purposes only. It does not constitute financial advice. Remember to always research and consult with a professional before making investment decisions. Good luck! 📈💼🚀
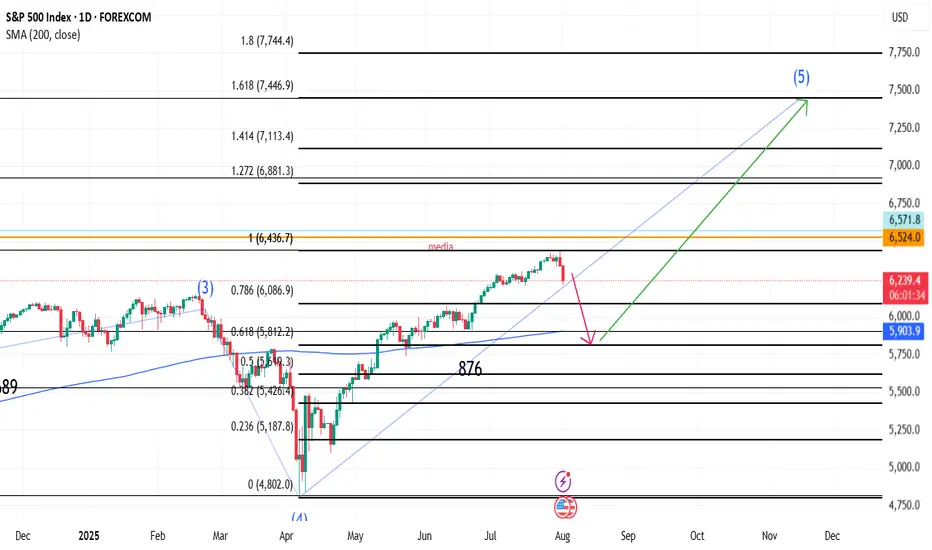
SPX correction to 5800 then 7445In my view current correction could stop in 5800 area where bullish trend could resume to target 7445 area in November
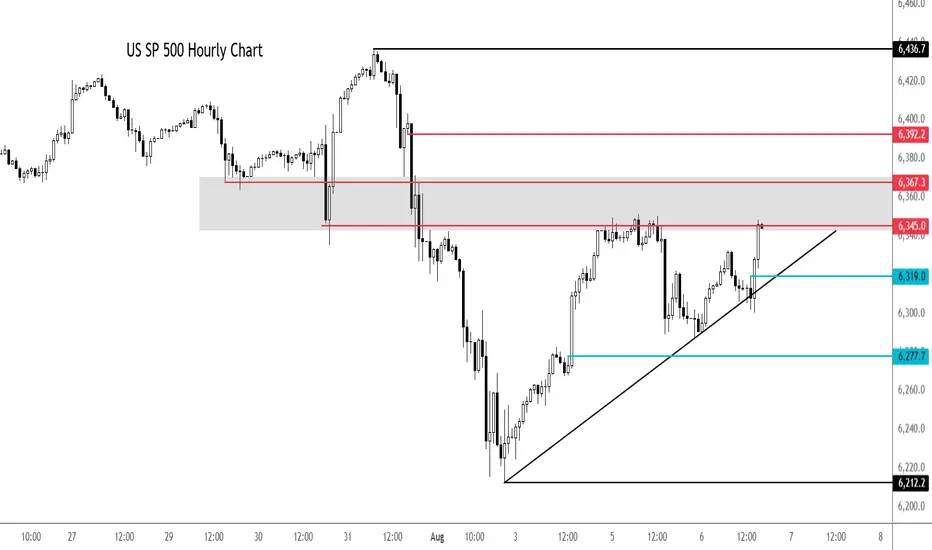
S&P 500 extends rally despite macro concernsThe 5% Apple rally aside, it is all about rate cut bets vs. strong earnings. So far, the latter has helped to keep US markets supported near all-time highs. But if macro concerns increase further, investors' perception about future earnings growth will weaken. And with that, we could see some cracks in expensive stocks.
Looking at the hourly chart of the SPX500, the US benchmark was testing a potential resistance zone in the shaded region between 6345 to 6367, an area which was previously support. Above this zone, 6392 is the next level of potential resistance and then the all-time high of 6436 comes into focus next.
earlier, the index bounced after a failed breakdown below the trend line shown on the chart. Another potential test of the trendline could see the index break lower. Short-term support is seen around 6319 then 6277.
By Fawad Razaqzada, market analyst with FOREX.com
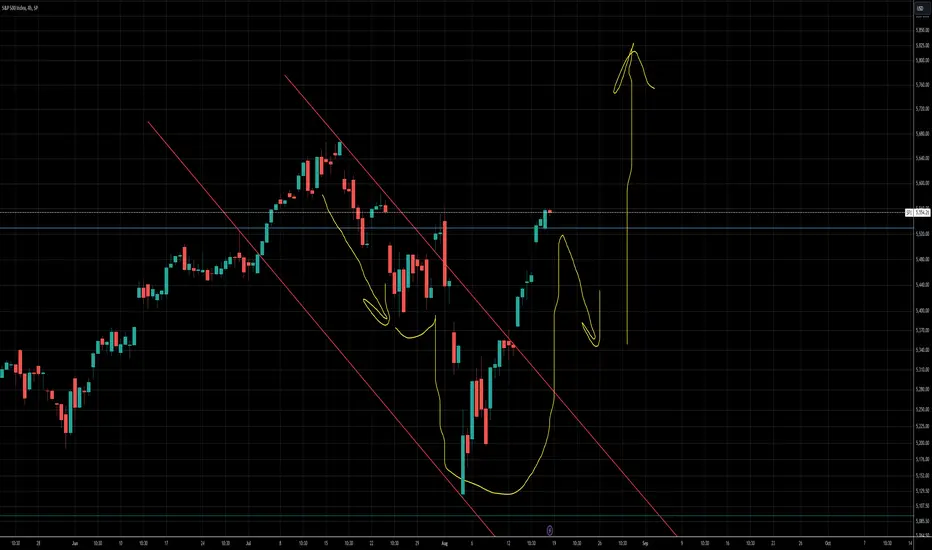
Is This the Start of a Market Drop?So, is the drop beginning? It kind of looks that way, but there’s still no solid setup for entering a short position — and there hasn’t been so far.
The trend is still upward for now, and this current pullback might just be temporary.
What I like about the short idea is that August is traditionally a weak month for stocks .
Could this be the start of a big correction on the market? Yes, it’s possible.
It’s just a pity there’s no clean setup for a short. I’d like to enter, but I’d prefer to see a bit more confirmation on the chart itself.
In general, trading the index off of chart setups isn’t easy — perfect entries are rare. That’s exactly the case now. I’m watching and wondering how and when to catch the downside. Maybe I’ll end up sitting through the entire drop without a position :)
Overall, I’m in favor of the short — but for now, I just don’t see a clear entry point.
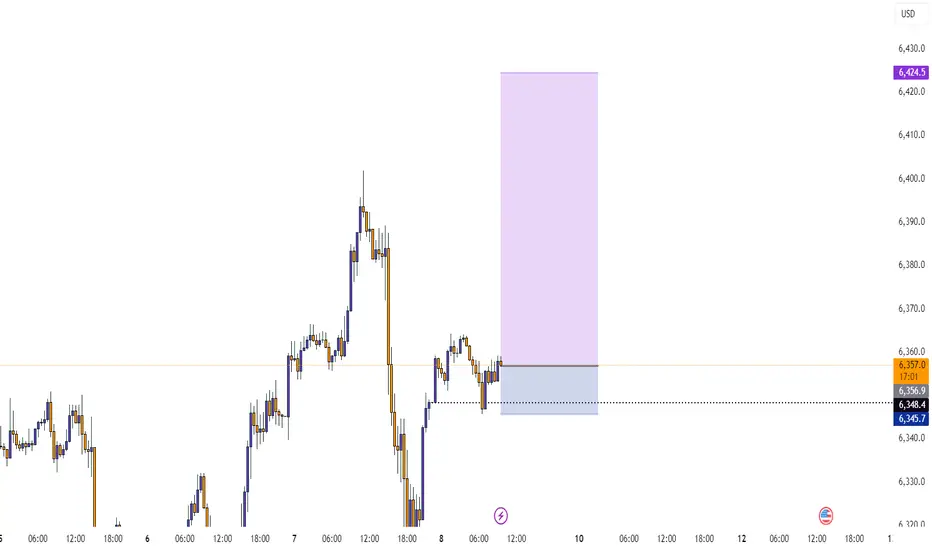
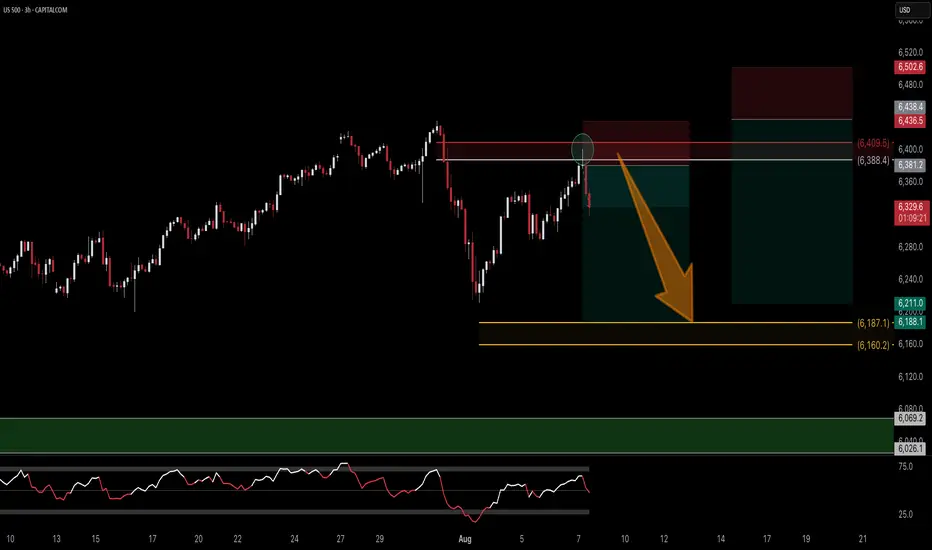
S&P 500 Futures Hold Ground After Tariffs Take EffectS&P 500 Futures Rise After New Tariffs Kick In
President Trump's sweeping tariffs officially took effect just after midnight, escalating trade tensions with dozens of countries. While negotiations are ongoing behind the scenes to secure exemptions and reduce tariff rates, market reactions are already underway.
Technical Outlook
S&P 500 Futures continue to show bullish momentum as long as price trades above 6289, with the potential to retest the All-Time High (ATH).
To confirm a move toward 6453, price must close above 6437 on the 1H chart.
🔻 However, if the price stabilizes below 6389, a correction toward 6365 becomes more likely.
Key Levels:
🔹 Resistance: 6424 – 6453
🔹 Support: 6365 – 6341
Cup and handleTarget 1 is 5800, calculated from taking the height of the cup and handle structure divided by 2, added to the top of the handle inflection point.
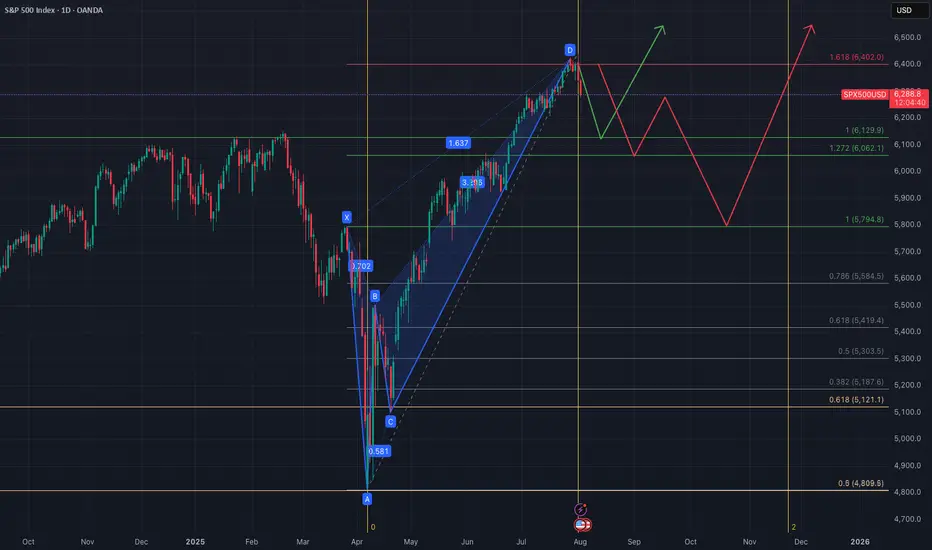
SPX500 - Bearish Crab Pattern- Price completed a perfect Crab Pattern, yet we all got to August 1st (second) liberation day
- If bad mood continues, we can expect a correction:
A. (positive) down to 6150-6000
B. (negative) down to 5800
Just my humble opinion
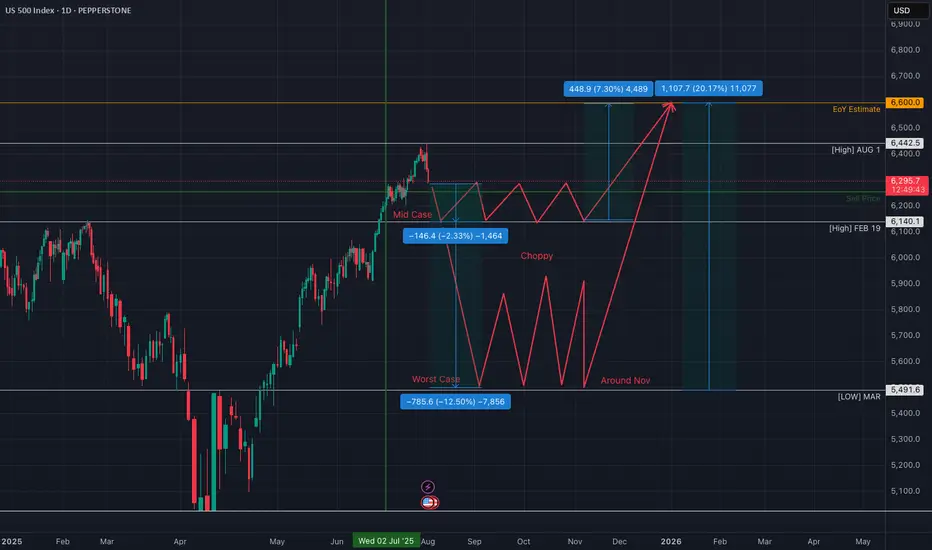
S&P500 for the rest of 2026I am not a professional and this is based on nothing more than blind speculation and feelings.
Probably wrong
S&P 500 ETF & Index Hit Resistance – A Technical Warning Shot 📉⚠️ S&P 500 ETF & Index Hit Resistance – A Technical Warning Shot 🔍🧠
Following up on the video I just posted , I had to share this updated chart of the VOO ETF (Vanguard S&P 500) and US500 Index , now that both are testing key resistance levels.
On the left: AMEX:VOO has reached the very top of a multi-year ascending channel—a zone that has historically triggered sharp corrections. The level at 590.85 marks a major resistance zone.
On the right: The US500 Index is showing a similar technical overextension, trading just under 6,450, with 5,928.25 as the nearest support below.
🎯 Technicals at play:
VOO could retrace toward 526.17 and potentially 465.72, both of which are solid technical supports within this channel.
This setup doesn't mean panic—but it does argue for caution, especially after such an extended run.
🧠 And yes, the Buffett Indicator (Stocks-to-GDP) continues to point toward an overheated market . While it's not a timing tool, it adds macro weight to the technical signals.
In the video, I also touched on:
Taking profits on NASDAQ:NVDA after a near-perfect technical rejection at target.
Reviewing Rolls Royce nearing upper channel resistance.
Gold and Silver at inflection points—likely to be impacted if equities begin to unwind.
Rotational potential into Bitcoin and Ethereum, which may benefit from macro shifts.
This is how I trade: respect structure, stay proactive, and prepare before the move—not after. Let me know how you’re positioning or if you’re sitting on hands waiting for a dip.
One Love,
The FX PROFESSOR 💙
Disclosure: I am happy to be part of the Trade Nation's Influencer program and receive a monthly fee for using their TradingView charts in my analysis. Awesome broker, where the trader really comes first! 🌟🤝📈
