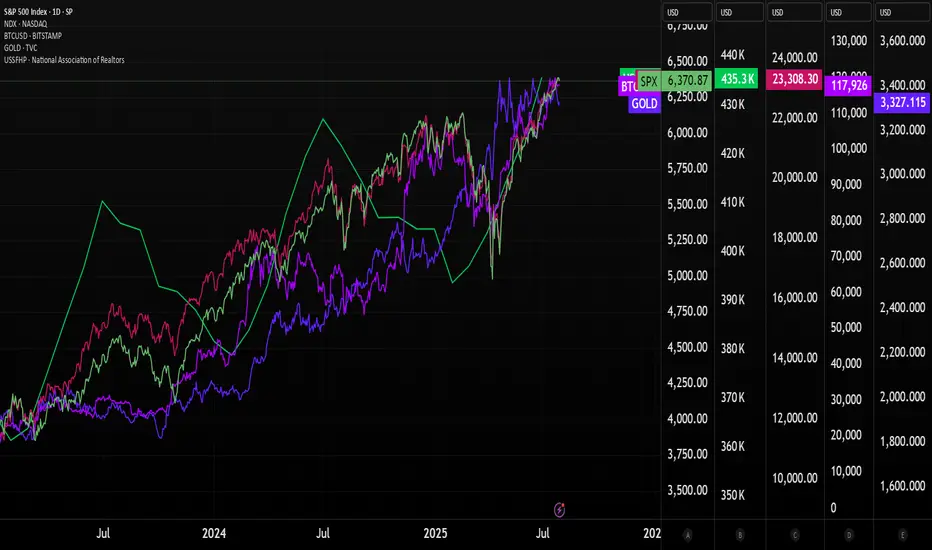
Nasdaq and S&P 500 higher than ever. Crash incoming??The stock market is now more expensive than ever.
Some people are calling the top, saying that the market is overbought and too high.
There are indicators that show that the market is overheated, but NO ONE KNOWS whether it's going to crash next week or continue running up for months.
Since April, Nasdaq has gained 40%, which is a lot. Congrats if you bought some QLD and TQQQ back in April when I posted about it.
SP:SPX : All-time high. NASDAQ:NDX : All-time high. BITSTAMP:BTCUSD : All-time high. TVC:GOLD : All-time high HOME PRICES ( ECONOMICS:USSFHP ): All-time high. Sounds a bit like a bubble.
The S&P 500’s market cap now equals 28x real disposable personal income — a record.
The stock market Shiller PE ratio is at its highest in 20 years.
Nasdaq companies, especially the MAG7, are strongly outperforming small-cap companies. The last time this happened at this speed, we had the dot-com crash.
The top 10 stocks in the S&P 500 account for 40% of the index.
So, saying this, is the market going to crash?
I don't know, but I know that it's more likely to crash now than it was 3 months ago. It might continue running higher, too, as the FED is expected to cut rates. Really, no one knows. 😊
Here's what I'm doing:
I trimmed down some overpriced stocks from my portfolio: Lemonade, Coupang, Shopify, and Crowdstrike
I trimmed down some of my crypto, especially Bitcoin and Ethereum
I stopped DCA'ing into leveraged ETFs
I'm accumulating cash
I'm still investing (added more healthcare stocks to the portfolio)
Quick note: I'm just sharing my journey - not financial advice! 😊
SPCUSD trade ideas
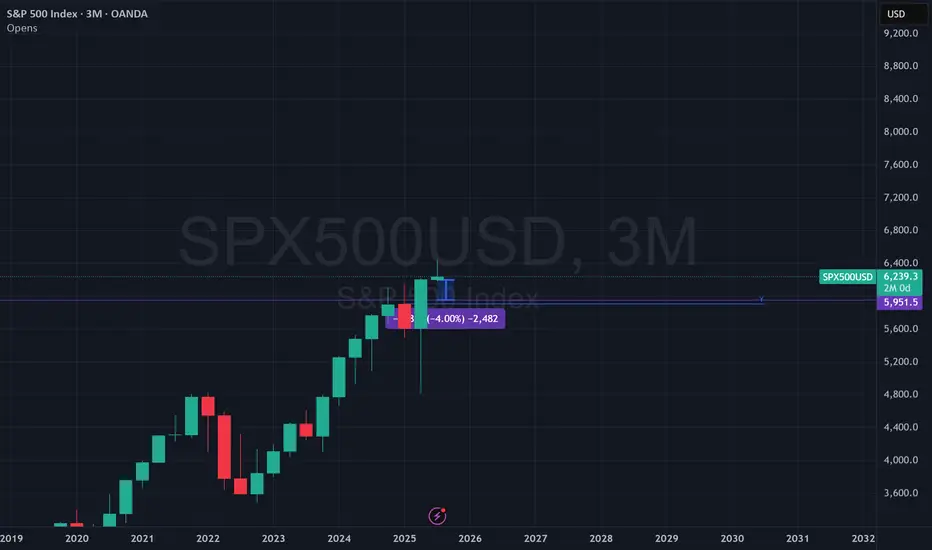
Bearish Engulfing on Risk. Average quarterly downside since 2023 open is 4.07%. Is a retest of near the yearly open on order over the month of August? Markets are no longer pricing in a Fed rate cut in September. Will that be the near term bearish fuel?
SPY and its games -FOMC buy level needs to be taken out After 3 days of back and forth, the trend line is the deciding factor for me on the bearish bias.
Once the FOMC buy level is taken with at least 4hr closure, sellers are in control.
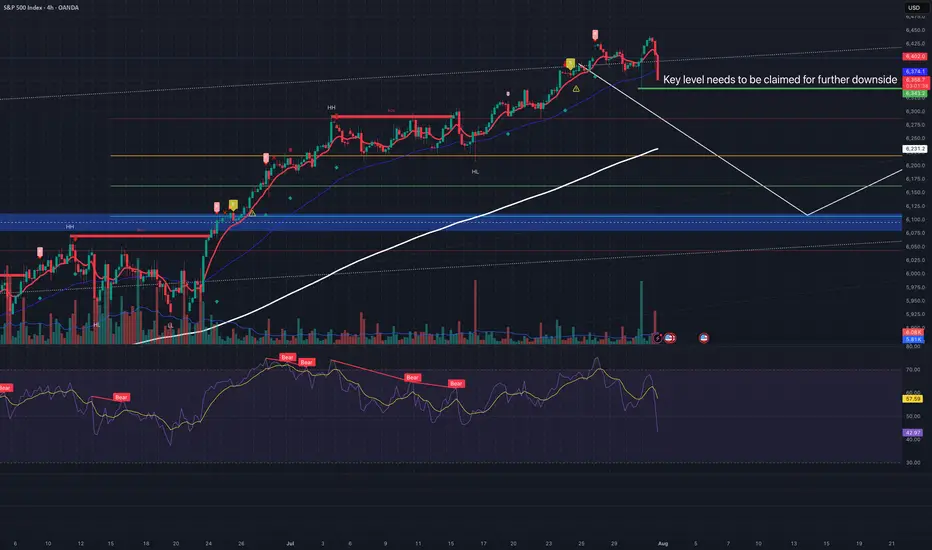
29-07-2025This chart contains my analysis and key observations for today's trading session. All drawings and indicators reflect my current view of the market as of today. The purpose of this publication is to keep a record of my analysis and review it later for learning and improvement. No investment advice is provided.

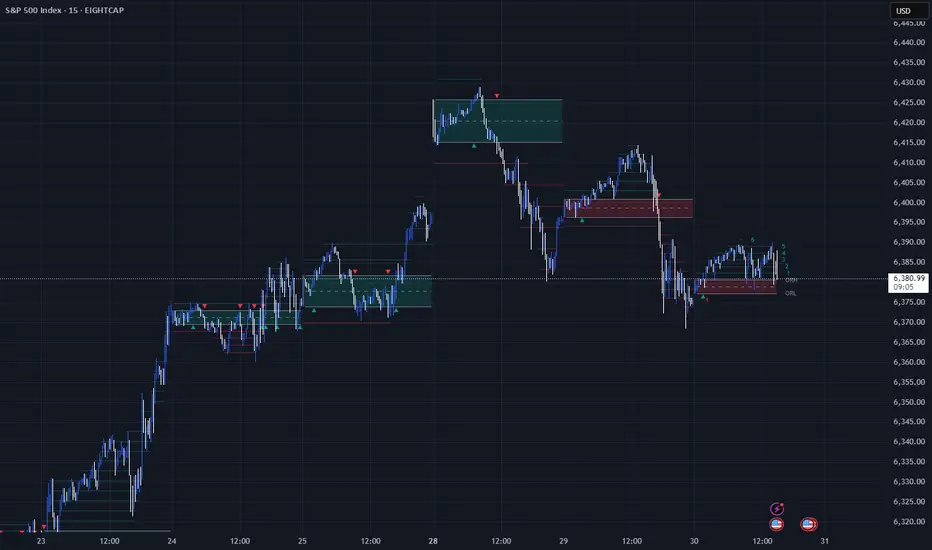
Unlocking the Power of ORB (Opening Range Breakout)Unlocking the Power of ORB (Opening Range Breakout): A Proven Strategy for Intraday Traders
In the fast-paced world of intraday trading, simplicity and structure can often outperform complexity. One such time-tested strategy is the Opening Range Breakout (ORB) — a method favored by both discretionary and system traders for its clarity and adaptability.
📌 What is ORB (Opening Range Breakout)?
ORB refers to the price range (high and low) formed during the first few minutes (typically 5, 15, or 30) after the market opens. Traders look for a breakout above or below this range, anticipating strong momentum in that direction.
🧠 Why ORB Works
Volume Surge: The opening minutes see high institutional activity, creating genuine demand/supply signals.
Market Psychology: ORB captures trader sentiment as news digests overnight and is priced in at the open.
Defined Risk: The high/low of the range becomes a natural stop-loss area, allowing clean setups.
✅ Entry and Exit Rules for the ORB Strategy
Having a consistent framework helps you avoid emotional decisions. Here’s how you can structure your trades using ORB:
🔹 Entry Criteria:
Timeframe: Define your ORB window — e.g., first 15-minute candle.
Bullish Breakout Entry:
Enter long when price closes above the ORB high with volume confirmation.
Bearish Breakdown Entry:
Enter short when price closes below the ORB low with volume confirmation.
⚠️ Avoid entering on the first breakout candle. Wait for a close and retest, or a strong momentum candle for higher confidence.
🔹 Stop-Loss Placement:
For Long Trades: Place SL just below ORB low
For Short Trades: Place SL just above ORB high
🔹 Target/Exit Options:
Fixed RR Target: Aim for 1.5–2x your risk as initial target.
Mid/Outer Bands: Use indicator-drawn breakout bands (like those in LuxAlgo script) as profit zones.
Time-based Exit: Close position by end of session if price stalls or consolidates.
Trailing Exit: Trail your stop behind higher lows (long) or lower highs (short) after breakout.
📊 ORB in Action
You can explore this ready-to-use TradingView indicator to visualize ORB levels in real-time:
🔍 Indicator: Opening Range with Breakouts & Targets (by @LuxAlgo) Thanks to @LuxAlgo team to make this indicator available.
🛠️ Highlights:
Automatically marks the opening range
Plots breakout zones and targets
Ideal for intraday strategies
Works across indices, forex, and crypto
📓 Integrating ORB into Your Trading Journal App
If you're journaling ORB trades, consider logging:
✅ Symbol & timeframe
✅ ORB range (high/low)
✅ Breakout direction (long/short)
✅ Entry time & price
✅ Exit reason (target hit, SL hit, time-based exit)
✅ Notes: market sentiment, news drivers, volume confirmation
Over time, this data will help you:
🔍 Identify which assets respect ORB best
📈 Tune your RR ratio and stop placements
🧠 Reduce decision fatigue by automating setups
🧪 Want to Automate It?
Our trading journal app is ready with 🧠 AI-based journaling for feedback and refinement
🎯 Final Thoughts
ORB is a classic — not because it’s flashy, but because it offers structure, risk control, and repeatability. Whether you're a price action purist or using smart indicators, ORB can provide a disciplined edge — especially when integrated into a journaling and feedback loop.
📌 Start small. Track results. Tune your edge.
S&P 500 as expensive as at the end of 2021 in valuation terms !Two weeks ago, I shared a technical analysis of the S&P 500 across all timeframes. This analysis outlines price targets for the end of 2025 based on technical and fundamental criteria. You can revisit this analysis by clicking the first chart below.
WARNING: A major bullish target I previously mentioned is close to being reached—6,475 points on the S&P 500 futures contract. The market may soon enter a consolidation phase.
Given this week's packed fundamentals, it's wise to start locking in your gains by moving up your stop-loss levels—especially as the S&P 500 has now returned to its end-2021 valuation peak.
Click on the table below to access details on this week's significant fundamental developments:
1. Caution: The S&P 500 has reached its end-2021 valuation record!
While technical market analysis is important, valuation metrics are even more so. The S&P 500 has just reached its previous valuation peak from the end of 2021—historically the starting point of the 2022 bear market. While the current macro context is different, this level could trigger a short-term market pause.
Chart showing S&P 500 valuation via the CAPE Ratio (Shiller PE):
2. S&P 500 seasonality is weaker in August and bearish in September
Another cautionary factor is seasonality. A statistical look at average S&P 500 performance by month highlights a weaker period in August and a typically negative one in September.
In summary, technical, fundamental, and seasonal analysis all point to securing gains as we approach August/September—without questioning the underlying long-term uptrend.
Chart showing S&P 500 seasonality since 1960:
DISCLAIMER:
This content is intended for individuals who are familiar with financial markets and instruments and is for information purposes only. The presented idea (including market commentary, market data and observations) is not a work product of any research department of Swissquote or its affiliates. This material is intended to highlight market action and does not constitute investment, legal or tax advice. If you are a retail investor or lack experience in trading complex financial products, it is advisable to seek professional advice from licensed advisor before making any financial decisions.
This content is not intended to manipulate the market or encourage any specific financial behavior.
Swissquote makes no representation or warranty as to the quality, completeness, accuracy, comprehensiveness or non-infringement of such content. The views expressed are those of the consultant and are provided for educational purposes only. Any information provided relating to a product or market should not be construed as recommending an investment strategy or transaction. Past performance is not a guarantee of future results.
Swissquote and its employees and representatives shall in no event be held liable for any damages or losses arising directly or indirectly from decisions made on the basis of this content.
The use of any third-party brands or trademarks is for information only and does not imply endorsement by Swissquote, or that the trademark owner has authorised Swissquote to promote its products or services.
Swissquote is the marketing brand for the activities of Swissquote Bank Ltd (Switzerland) regulated by FINMA, Swissquote Capital Markets Limited regulated by CySEC (Cyprus), Swissquote Bank Europe SA (Luxembourg) regulated by the CSSF, Swissquote Ltd (UK) regulated by the FCA, Swissquote Financial Services (Malta) Ltd regulated by the Malta Financial Services Authority, Swissquote MEA Ltd. (UAE) regulated by the Dubai Financial Services Authority, Swissquote Pte Ltd (Singapore) regulated by the Monetary Authority of Singapore, Swissquote Asia Limited (Hong Kong) licensed by the Hong Kong Securities and Futures Commission (SFC) and Swissquote South Africa (Pty) Ltd supervised by the FSCA.
Products and services of Swissquote are only intended for those permitted to receive them under local law.
All investments carry a degree of risk. The risk of loss in trading or holding financial instruments can be substantial. The value of financial instruments, including but not limited to stocks, bonds, cryptocurrencies, and other assets, can fluctuate both upwards and downwards. There is a significant risk of financial loss when buying, selling, holding, staking, or investing in these instruments. SQBE makes no recommendations regarding any specific investment, transaction, or the use of any particular investment strategy.
CFDs are complex instruments and come with a high risk of losing money rapidly due to leverage. The vast majority of retail client accounts suffer capital losses when trading in CFDs. You should consider whether you understand how CFDs work and whether you can afford to take the high risk of losing your money.
Digital Assets are unregulated in most countries and consumer protection rules may not apply. As highly volatile speculative investments, Digital Assets are not suitable for investors without a high-risk tolerance. Make sure you understand each Digital Asset before you trade.
Cryptocurrencies are not considered legal tender in some jurisdictions and are subject to regulatory uncertainties.
The use of Internet-based systems can involve high risks, including, but not limited to, fraud, cyber-attacks, network and communication failures, as well as identity theft and phishing attacks related to crypto-assets.

SPX500 Correction Before Rally? Key Levels in FocusSPX500 Correction Before Rally? Key Levels in FocusSPX500 OVERVIEW
Fundamental Context:
The U.S. and EU have averted a tariff standoff. The agreement reduces the baseline tariff on most European imports to 15%, down from the previously threatened 30% by the Trump administration. In return, the EU has committed to investing approximately $600 billion in the U.S.
Additionally, U.S.–China trade talks are ongoing in Stockholm, with reports suggesting a possible 90-day extension to the tariff deadline.
Technical Outlook:
SPX500 maintains a bullish bias due to easing trade tensions. However, as long as the price trades below 6421, a short-term correction toward 6397 and 6388 is likely. A rebound is expected if the price stabilizes above 6388.
🔺 Bullish Continuation will be confirmed if a 1H candle closes above 6427, potentially targeting 6454 and 6470.
Key Levels
• Support: 6397 – 6388 – 6365
• Resistance: 6454 – 6470
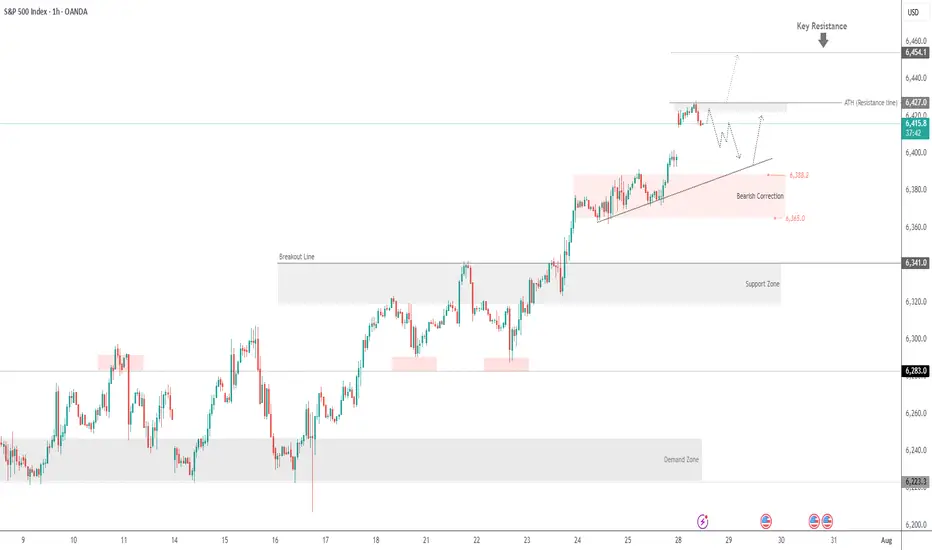
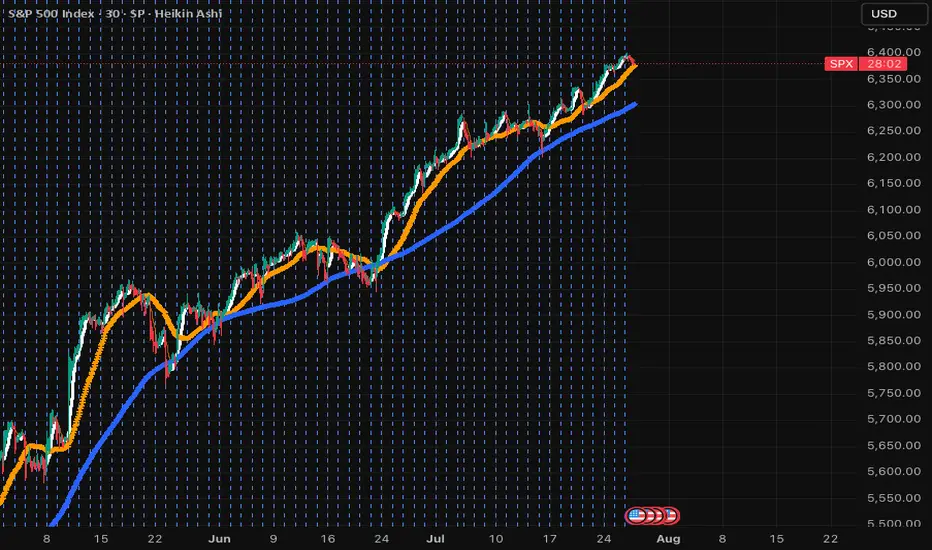
SPX....what goes up, must go downThis is long overdue. SPX has just crossed 9SMA, next 50SMA then 200SMA. Won't be surprised if it knocks each very soon. This will be a big week and tariffs are going to start hitting; even though this was mostly artificial and Americans are paying 90% of it! When in doubt, sell and park in money market! The next dip will hit hard and deep. Don't let the small wins overshadow the deep issues in the economy. Overpriced market and many lagging indicators will soon hit and default rates that are coming out are scary! Stay safe and don't get emotional over any stock. If it dips, you can always buy it cheaper.
S&P 500 Counter-Trend Setup After Bullish Week US500Currently watching the S&P 500 (US500) closely 👀. The index has been in a strong bullish trend 📈, but I’m now evaluating a potential counter-trend opportunity.
Given the strength we’ve seen this week — possibly a “foolish rally” — there’s a chance we’ve either printed or are close to printing the high of the week 🧱. That opens the door for a retracement setup, particularly as we head into Monday’s open 🗓️.
🧠 Trade idea: If we get a bearish market structure break, I’ll be looking to enter short — targeting a 1R take profit initially, and holding a portion for a 2R–3R extension 🎯.
Friday sessions, especially after strong trends, often present clean intraday pullbacks — and when Monday’s low is set early, it can trap late buyers and fuel the move 📉.
⚠️ This is not financial advice — just sharing my thought process and trade plan.

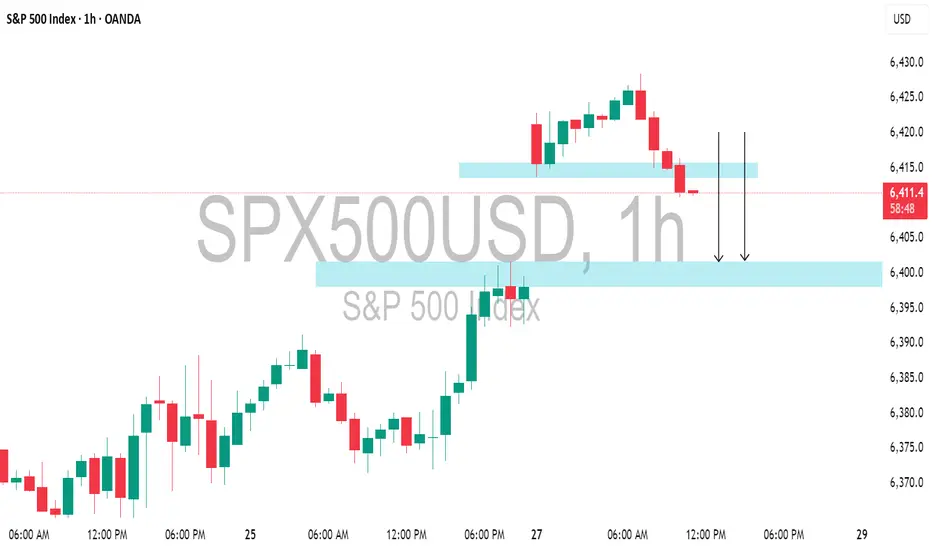
S&P500 INDEX (US500): Classic Gap Opening TradeI noticed a classic gap up opening on 📉US500 Index and believe it will be filled today.
The formation of an intraday bearish change of character (CHoCH) on the hourly chart indicates a strong likelihood of continued bearish movement.
Target - 6400.
No FOMOSPY does its thing and will keep moving higher but cautious on low volume push.
To keep it simple, if there is a daily close back inside the master trendline sometime this week, a short setup will be adequate to the previous all time high @ 6095
The Golden Age 7000 EOY SPXThe Golden Age (year) is here!
Have cash ready for May in April. Be heavy hedges going in to 26.
We're going to juice earnings with all the investments pouring in for just about every single industry. Once the injection is complete, we will reset while all the invested money completes projects.
GL!
Better Buy Bitcoin

New All-Time Highs for S&P 500 – No Resistance AheadThe S&P 500 is officially in price discovery mode, printing new all-time highs with clean higher highs and higher lows.
Each old resistance flipped into strong support—textbook bullish market structure.
As long as this trend holds, there's no ceiling in sight. Bulls are fully in control.

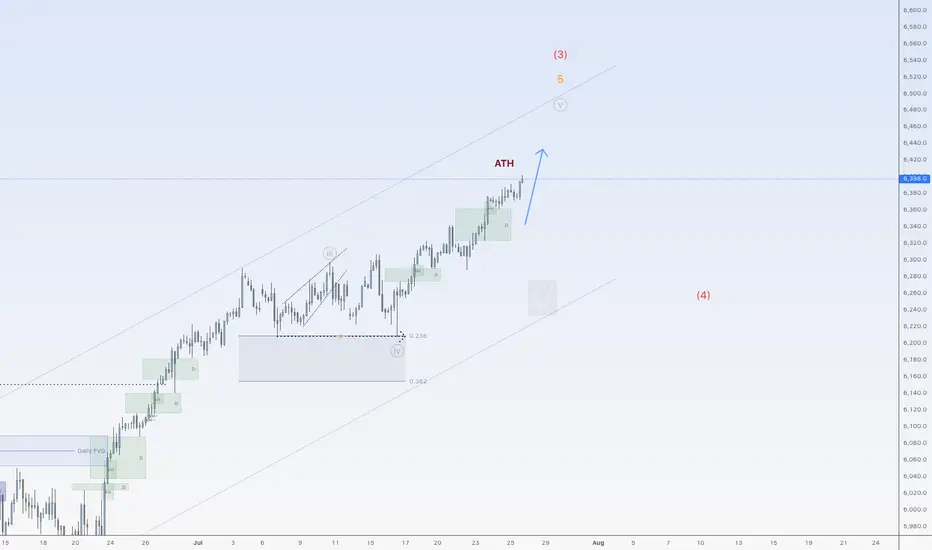
SPX500USD is on a riseHi traders,
Last week SPX500USD started the next impulse wave 5 (grey) as I've said in my outlook.
Next week we could see more upside for this pair.
Let's see what the market does and react.
Trade idea: Wait for a small pullback and a change in orderflow to bullish on a lower timeframe to trade longs.
NOTE: the next three weeks I'm on holiday so I will not post any outlook publicly.
If you want to learn more about trading FVG's & liquidity sweeps with Wave analysis, then please make sure to follow me.
This shared post is only my point of view on what could be the next move in this pair based on my technical analysis.
Don't be emotional, just trade your plan!
Eduwave
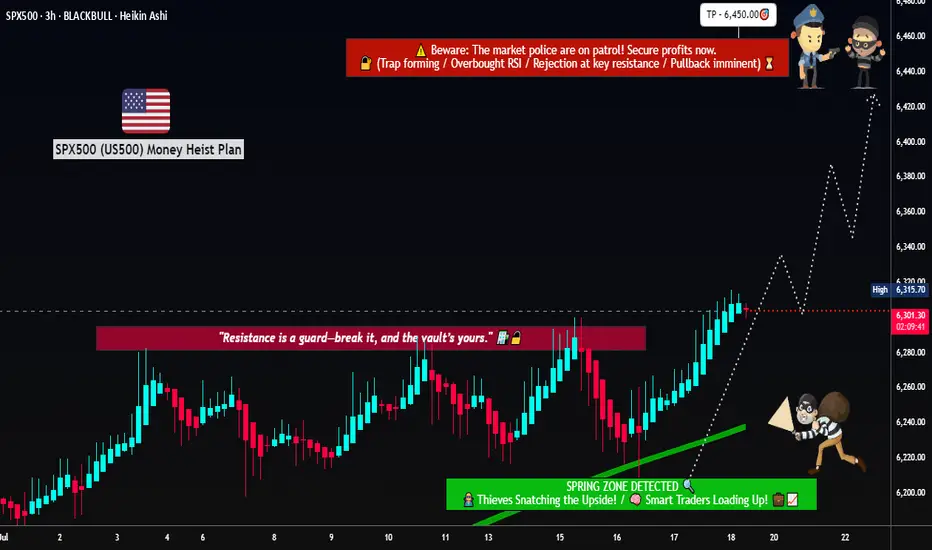
Rob the Rally SPX500: Enter Before Resistance Catches You🦹♂️💰**“SPX500 Street Heist” – Thief-Style Robbery Plan for Bulls!**📈💸
(Powered by Thief Trader's Market Robbing Tactics – Scalp | Swing | Day Trade Edition)
🌍Hello, Global Money Hunters!
📣 Salaam, Bonjour, Ola, Hola, Hallo, Marhaba & Welcome to the heist floor! 🎩💼
Thief Trader is back again with a loaded plan to rob the market clean — this time targeting the mighty SPX500 / US500 🎯. Based on a fusion of technical setups, macro sentiment, and the Thief Trading System, we’ve set our sights on the next breakout vault of Wall Street.
🎯 The Gameplan – Heist the Resistance Vault
The index is entering a high-risk resistance barricade — overbought, consolidated, and heavily guarded by bearish robbers (sellers). This is the zone where the market police lurk and trend reversals often get triggered. However, smart thieves always plan with precision.
Here’s the mission briefing:
🔓Entry Zone (Break-in Point)
💥 “The vault is open — grab the bullish loot!”
Enter Long anywhere close to market price or on pullbacks near recent swing lows/highs.
Preferred timeframes: 15-min to 30-min for sniper-level accuracy.
Deploy DCA-style limit orders (layered entries for maximum control).
🛑Stop Loss (Escape Hatch)
Base SL on recent swing low candle wicks on the 4H timeframe.
Suggested: ~6250.00 — but adapt based on your risk appetite, lot size, and position stacking.
📈Target / Loot Location
🎯 Primary Take-Profit: 6450.00
Or… pull out early if you spot resistance fighters guarding the vault.
Use trailing SL to secure gains and manage getaway.
⚡Scalper’s Notice
Only Long-side allowed!
Got big capital? Jump in now.
Running low? Tag along with swing traders and follow the robbery protocol.
Always protect your bag with dynamic trailing stops.
🧠Fundamental Fuel Behind the Plan
Bullish sentiment across major indices
Macro trends, COT positioning, sentiment outlook, and intermarket analysis all greenlit
Geopolitical and Fed tone supportive — tap into real data before entering
👉 Always analyze: News, Fundamentals, Sentiment, COT reports, and macro conditions.
🚨NEWS ZONE ALERT – No Loud Moves!
Avoid entry during major economic news drops
Use trailing SLs to guard profits
Don’t let your open trades get caught in the chaos of news releases!
💥Let’s Boost the Thief Army!
Smash the BOOST button 💖 to power up the robbery crew.
Support the strategy, share the love, and stay ahead of the game using Thief Trading Style. Every trade is a step closer to freedom from financial traps. 🚀💰🎉
📌Disclaimer: This is a general market analysis for educational purposes and should not be considered personal financial advice. Please evaluate your own risk management strategy before placing trades.
📌Markets shift fast — stay flexible, stay alert, and always rob smart.
🔥Stay locked in for the next heist plan — Thief Trader signing off for now…
💸💼📈 Trade smart. Rob harder. 🤑🦹♂️📊
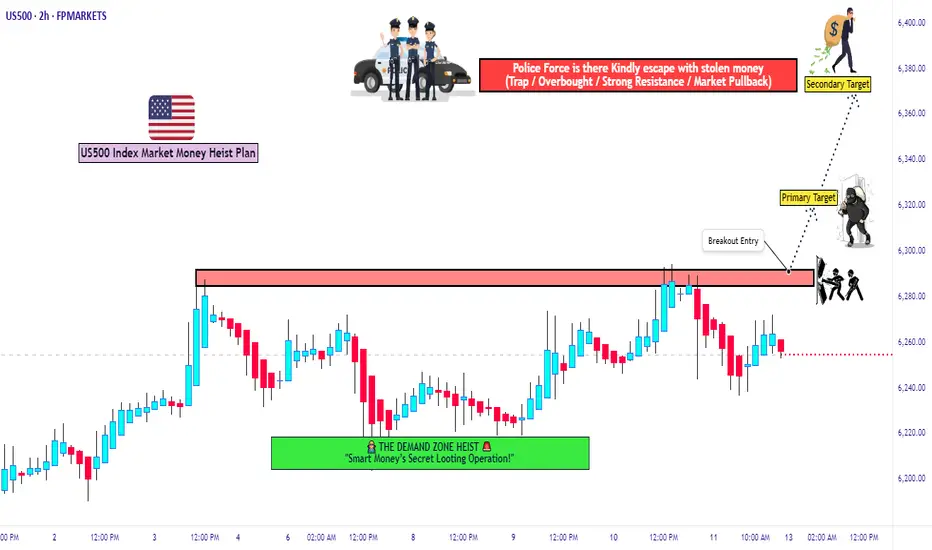
US500 Bulls Assemble | Breakout Heist Strategy📈🚨 MASTER HEIST PLAN: “SPX500 ROBBERY – THIEF TRADING STYLE 🔥💸” 🚨📈
(The Ultimate Long Strategy Blueprint for Smart Day/Swing Traders)
🌍 Greetings to All Market Bandits, Bullish Burglars, and Chart Snipers!
Hola! Bonjour! Ola! Hallo! Marhaba! 🙌
🦹♂️This is your friendly chart thief checking in with the latest SPX500/US500 masterplan!
This isn’t just a trade—it’s a heist 🎯. We’re not here to participate, we’re here to dominate! Welcome to the Thief Trading Style, where we map, trap, and snatch those pips with ruthless precision. 🧠🔍💰
🚀 THIEF TRADE SETUP - SPX500/US500
A mix of technical sniper entries + fundamental black ops analysis = 💸 Maximum Extraction. 💸
🎯 ENTRY PLAN: THE BREAKOUT HEIST
📍Buy Entry Zone: Wait for the clean breakout + candle close above 6270.00.
"The vault opens once we clear that wall. Let the bullish getaway begin!" 💥🚪📈
🛠️Thief Tips for Entry:
Use Buy Stop Orders above resistance levels.
OR layer in Buy Limit Orders near recent pullbacks (15/30m swing zones) using DCA Style (Dollar Cost Average layering like a pro).
Want stealth mode? Set that alert (alarm), and strike when the breakout sings. 🔔🎯
🛑 STOP LOSS – PROTECT THE LOOT
🧨Set your SL smart—beneath the nearest swing low using the 2H timeframe for stronger structure.
💬 “Look, don’t gamble. A thief knows when to run. Set that stop where I showed ya, or risk losin’ the bag.” 💼💣
❗Your SL should reflect your risk per trade, lot size, and number of entries. It’s your getaway plan—don’t mess it up.
💥 TARGETS – WHERE WE CASH OUT
🏴☠️Primary Take Profit (TP1): 6310.00
🏴☠️Secondary Take Profit (TP2): 6370.00
💹 Scalp Traders: Stick to the Long Side Only. Ride the momentum, but use trailing SL to lock it in.
🔍 THIEF FUNDAMENTAL INTEL: WHY THIS IS OUR MOMENT
Current SPX500 bullishness driven by:
✅ Positive macro & geopolitical tailwinds
✅ Institutional positioning (COT reports)
✅ Intermarket analysis showing strong correlations
✅ Momentum building with sentiment and volume
📌 Stay sharp—check all your fundamental reports, news catalysts, and sentiment tools before executing your move. Smart thieves plan every detail. 🎓📊
⚠️ NEWS RELEASE REMINDER
📢 News = Chaos. Don’t get caught in the spray:
🔒Avoid entering trades just before big announcements.
🚀 Use Trailing SL to secure profit if you're already in.
Stay agile. Stay smart. Stay rich. 💼🚁
❤️ SUPPORT THE HEIST – HIT THAT BOOST BUTTON!
👊 Liked the plan? Hit the Boost to join the elite robbery crew.
Every boost fuels the mission. Every like sharpens the strategy. Let's build a team of smart, profitable traders. 🚀💸🔥
🧠 Remember: This is general analysis – not financial advice. Manage your risk like a true thief. Stay updated. Adapt fast. Don't get caught. 🕵️♂️
🎉See you in the next Heist Plan! Keep your tools sharp, your charts cleaner, and your profit bags fatter. 🤑🔥
American Exceptionalism - The End of an Era "The Eagle and the Fall"
O say can you see, from the towers so high,
A gleam in the steel and a spark in the sky?
The factories roared and the railways sang,
And liberty’s bell through the cities rang.
We rose from the soil, rough-handed and proud,
With faith forged in steel and heads unbowed.
The eagle soared on ambition's flame,
Each man in his dream, each street with a name.
From sea unto sea, we built and we bought,
In ticker tape winds, prosperity caught.
The market climbed like a hymn on the air—
A temple of glass, reflecting a prayer.
But greed wore a mask and danced in disguise,
A siren’s whisper in financier’s eyes.
And credit, like wine, flowed too freely at last,
While whispers of worry were buried in glass.
October arrived like a thief in the mist,
And struck with a silence too brutal to miss.
A breath, then a cry, then a plunge in the floor—
The numbers all bleeding, the dream no more.
Yet still in the ruins, beneath ash and flame,
Burned a stubborn belief in America’s name.
For even when mountains of fortune did crash,
The stars and the stripes held fast through the ash.
O nation of daring, of promise and pain,
You rise not once, but again and again.
Through boom and through bust, your story is spun—
A land still unfinished, still chasing the sun.
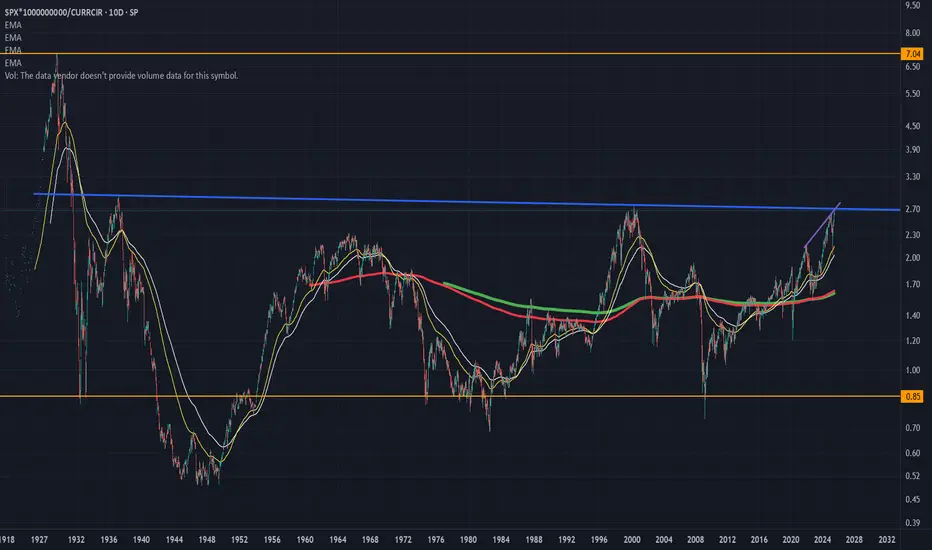
Entire S and P history in one chart. Approaching a neck-snapper!Here is a chart of the entire S and P history versus total currency in circulation.
This gives bubble periods (anytime the value is over 2) and times when the market crashed after being in a bubble.
If you notice we are fast approaching the line that broke the neck of the market in the 60s and 2000 dotcom bust.
If we clear that line, hold on to your hats because we are going into full blown speculative mania like just before the Great Depression!
In fact maybe the AI-crypto bubble will be exactly like the Great Depression, AI causing mass unemployment and global poverty.
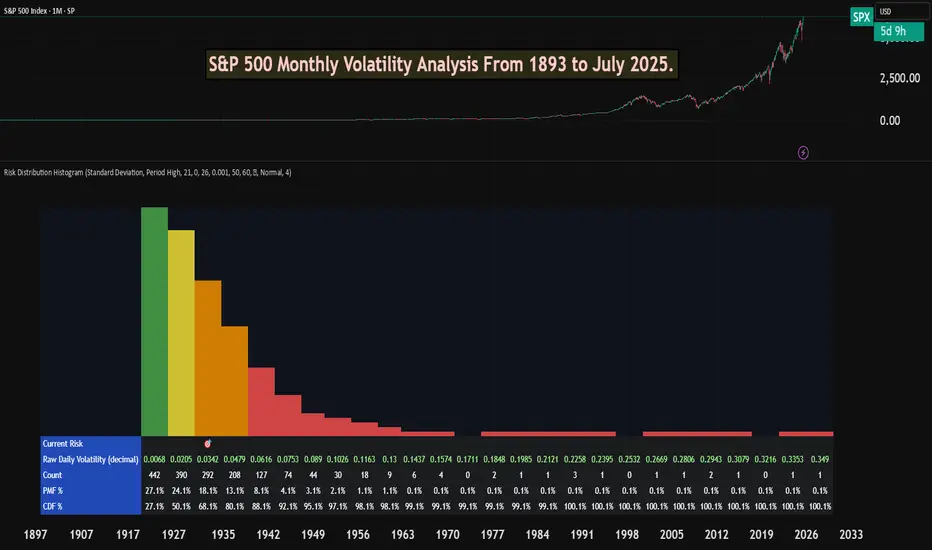
S&P 500 Monthly Volatility Analysis From 1893 to July 2025Most of the time, the S&P 500 is seen as a low-volatility index when compared to most individual stocks, small-cap indexes, or indexes from other countries.
However, most investors don't know exactly what volatility to expect from a statistical perspective.
The Risk Distribution Histogram allows us to understand exactly how risk is distributed.
S&P 500 Statistical Risk Distribution
Here are some highlights from what we get from the analysis. Some of this data might actually surprise investors. The data is monthly:
27% of all months have volatility under 0.68%
80% of all months' volatility was under 4.79%
5% of all months had a volatility of over 7%
If we can call a volatility over 25% a severe crash or "grey" swan, we had 7 of those events
3 months with extreme volatility over 30%
This allows us to understand tail risk and plan ahead. While most times the S&P 500 is in the low volatility zone, extreme events can happen.
What can we learn from this?
Prepare for rare but possible high-volatility events.
Understand the 80/20 rule. Most months are very low volatility, but 20% of them will have a volatility higher than 5% approximately.
Avoid overconfidence in stability
Plan for long-term horizons. High volatility tends to "dissipate" in the long term.
This is why it's important not to discard rare high-volatility events, especially when the investor is in need of liquidity.
This risk analysis can be done for any ticker.
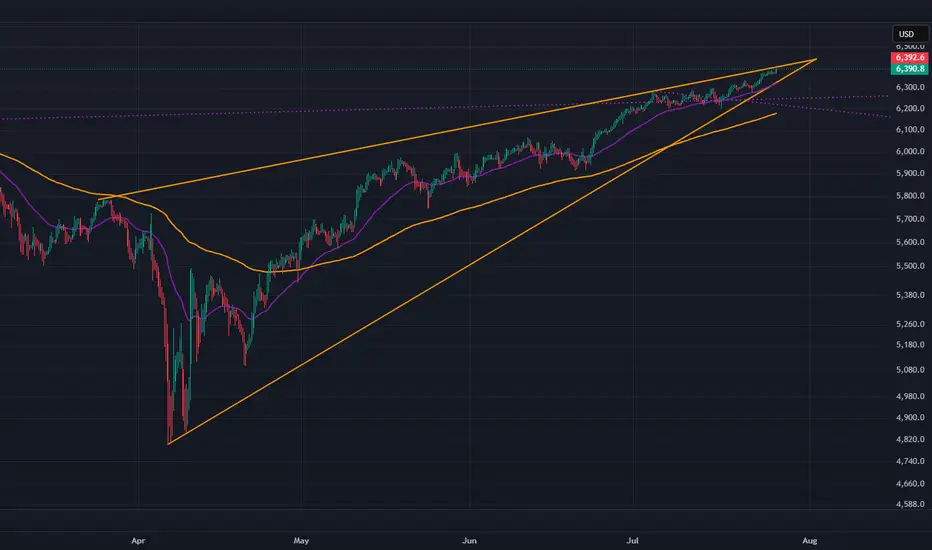
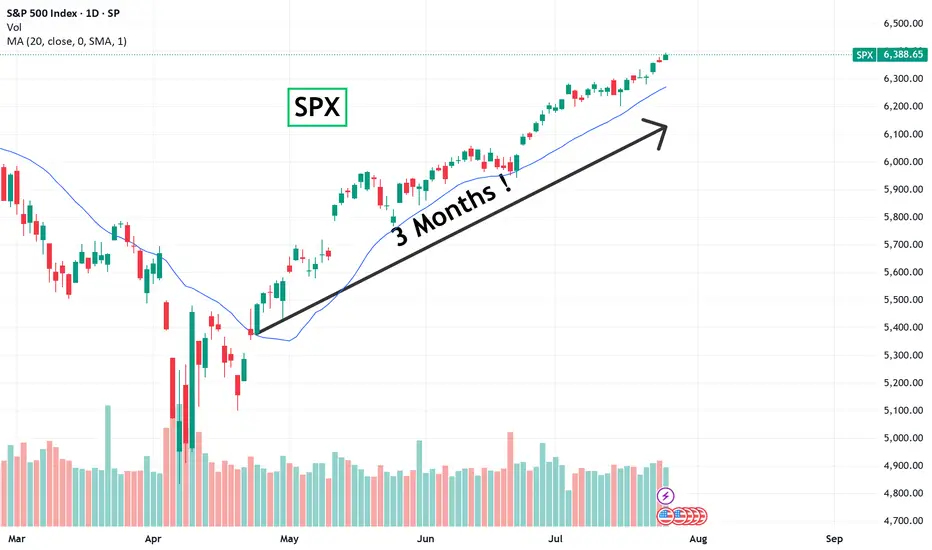
SPX chit chat... we're still up for nowAfter that crazy April 2025 crash, it feels like we should not be this high so fast... that's how I felt before too. But the rising channel is holding up right now. We are approaching the top. In previous times, the market grinded even higher (COVID pandemic was the last example).
Today we squeezed out new ATHs. The month ends next week and a new one begins. Less fear; more charts for the rest of the year.
See you in August!

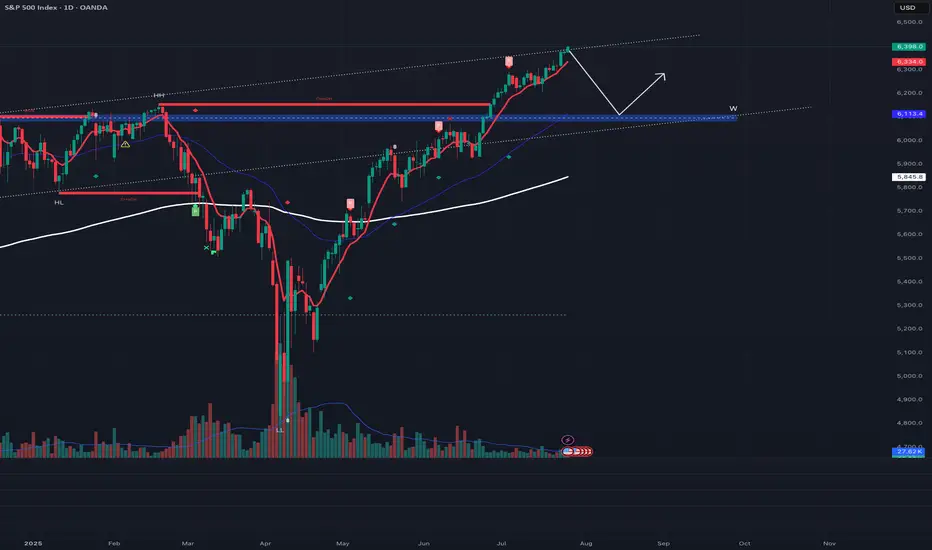
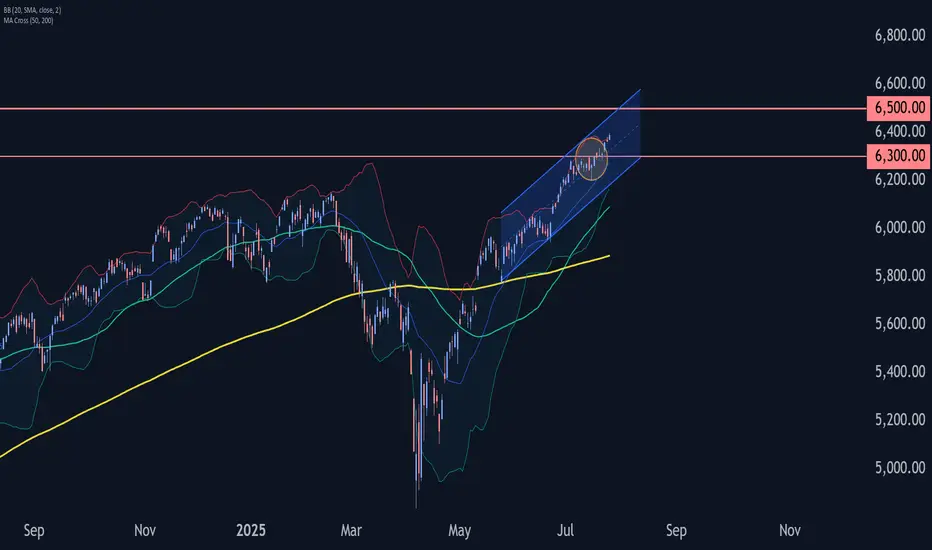
S&P 500 Index Wave Analysis – 25 July 2025
- S&P 500 Index broke key resistance level 6300.00
- Likely to rise to resistance level 6500.00
S&P 500 Index recently broke the key resistance level 6300.00 (which stopped the previous waves 5 and (B), as can be seen below).
The breakout of the resistance level 6300.00 continues the active intermediate impulse wave (5) from the middle of this month.
Given the strong daily uptrend, S&P 500 Index can be expected to rise to the next resistance level 6500.00 (coinciding with the daily up channel from May).
Watching July 31 High and August 1 Low - Key LevelsUS Inflation Next Week (CPI and PPI)
Will August re-test highs with momentum? Or test and fade?
MAGS back to highs.
AAPL has one of the best weeks since 2020's post covid crash recovery (WILD).
I still like long assets, but playing the game with discipline and patience.
Enjoy the weekend. Looking forward to the grind next week.
Thanks for watching!!!
-Chris
