SPELLUSDT Forming Bullish Falling WedgeSPELLUSDT is currently exhibiting a bullish falling wedge pattern, a formation that often precedes a significant upward breakout. The price has been gradually compressing between converging trendlines, and recent candles suggest growing bullish pressure near the wedge’s support. With a good volume p
SPELL/USDT Analysis: Long Setup
We previously analyzed this coin for a short setup, which played out well.
Now we’re noticing seller weakness and a failure to push new lows. A local support zone has formed at $0.00065–$0.000598, and we’ve already seen an initial bullish reaction from it.
We are considering a long from this zone

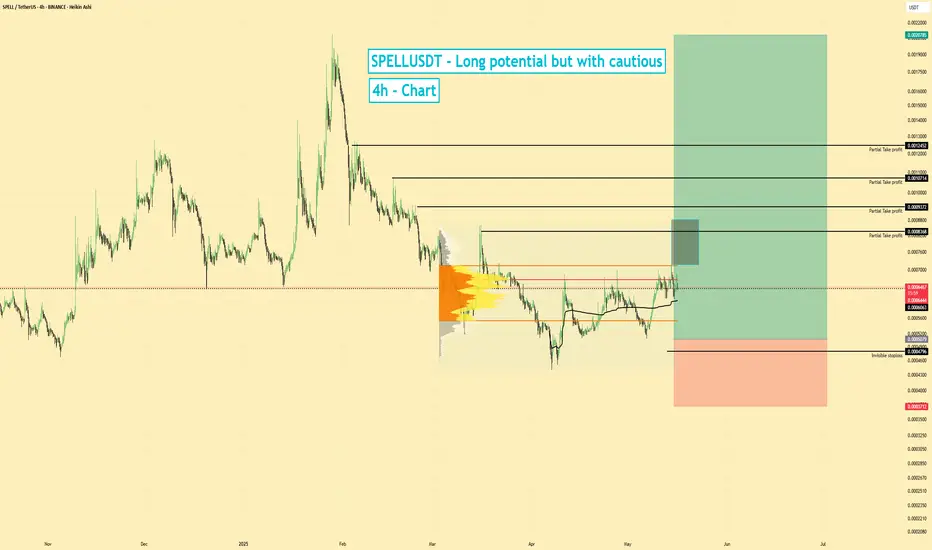
SPELLUSD | Long Bias | Watching Key Liquidity Zone | (May 2025)SPELLUSD | Long Bias | Watching Key Liquidity Zone | (May 2025)
1️⃣ Insight Summary:
SPELL is trading at ultra-low levels and sitting below a key value area. Despite concerns about fundamentals and major selling pressure, we're watching for a potential bounce opportunity if liquidity steps in.
2️⃣
SPELL/USDT Analysis – Possible Strong Correction
This asset is completing the formation of a reversal structure.
Above the current price levels, there are strong volume-based sell zones. If a reaction occurs from these zones, a sharp decline may follow, with the potential to reach the current low at $0.00051.
Sell Zones:
$0.00068–$0.000706,
$

SPELL good risk ratio here R:R = 1:3.6Successfully breakout this resistant line with a short -term target of at least +20-50%

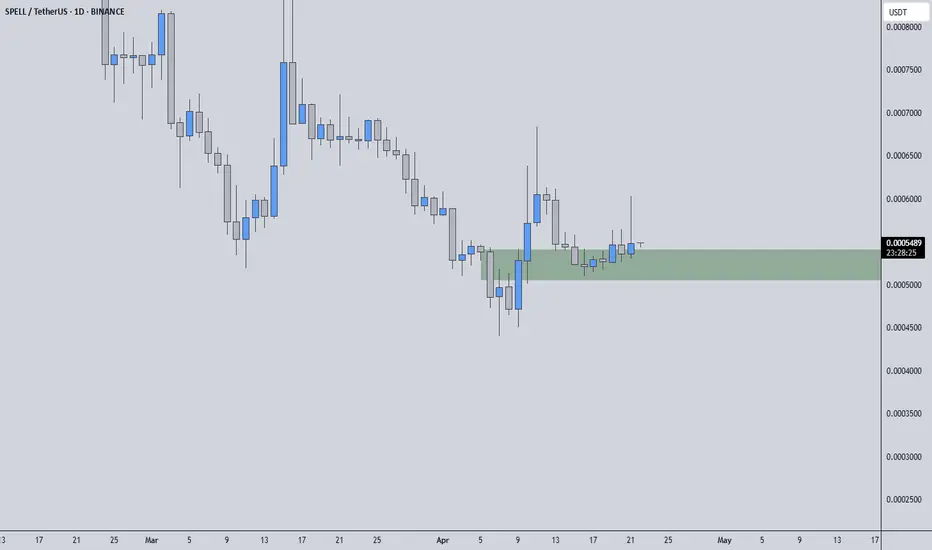
SPELLUSDT | Buyers Are Stepping In, Green Box Marks Key SupportVolume and order-flow data show genuine buying interest in SPELLUSDT right now. The green box on our chart highlights a zone where buyers have consistently defended price, making it a reliable area for potential entries.
🟢 Support Zone to Watch
The green box aligns with previous demand levels. When
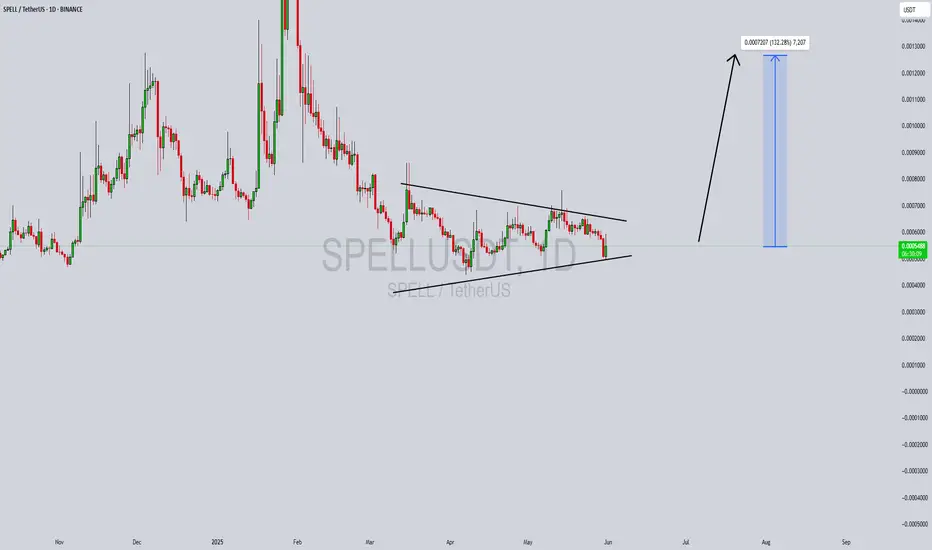
$SPELL/USDT Breakout Alert!🚀 $SPELL/USDT Breakout Alert!
SPELL has broken out of a symmetrical triangle on the 4h chart, confirming a strong bullish move!
• Entry: CMP
• TP: 0.0008612
• SL: 0.0005143 for risk management.
Momentum looks after consolidation — eyes on continuation if volume stays strong!
DYOR, NFA

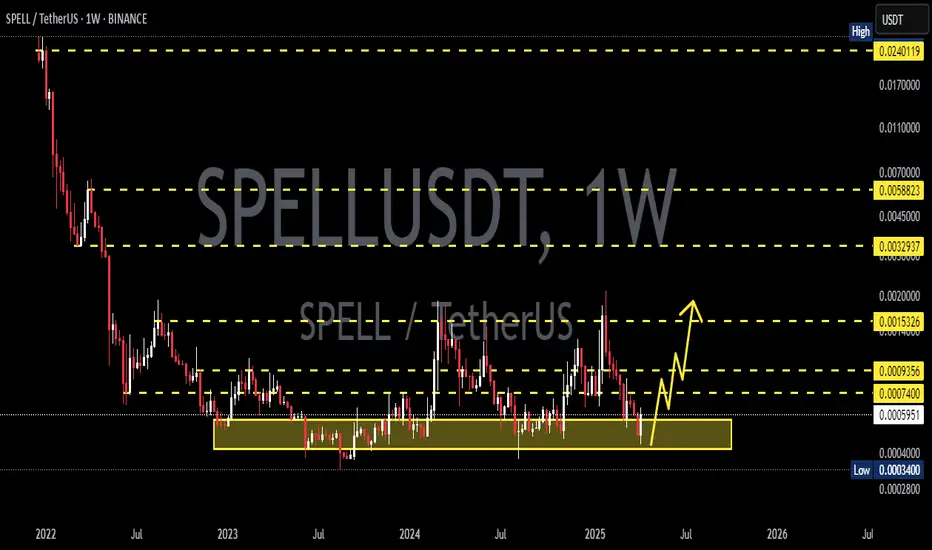
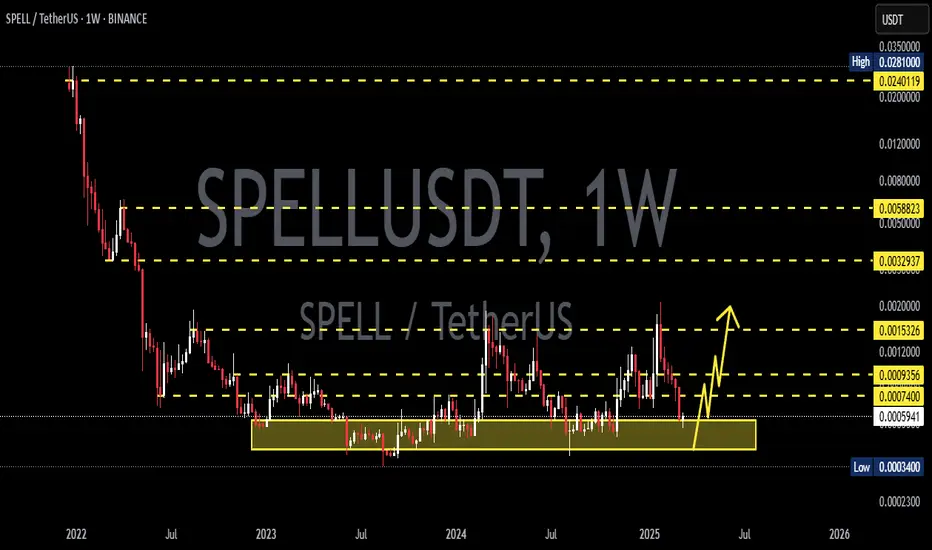
SPELLUSDT 1WSPELL ~ 1W Analysis
#SPELL Buy gradually from here if you still have a Conviction on this coin with a short -term target of at least 15%+.
SPELL/USDTHello friends
Given the strong support of the price, you can buy within the specified ranges with capital and risk management.
Price targets are also specified...
*Trade safely with us*

SPELLUSDT 1WSPELL ~ 1W Analysis
#SPELL Buy gradually from here if you still have a Conviction on this coin with a short -term target of at least 20%+.
See all ideas
Summarizing what the indicators are suggesting.
Oscillators
Neutral
SellBuy
Strong sellStrong buy
Strong sellSellNeutralBuyStrong buy
Oscillators
Neutral
SellBuy
Strong sellStrong buy
Strong sellSellNeutralBuyStrong buy
Summary
Neutral
SellBuy
Strong sellStrong buy
Strong sellSellNeutralBuyStrong buy
Summary
Neutral
SellBuy
Strong sellStrong buy
Strong sellSellNeutralBuyStrong buy
Summary
Neutral
SellBuy
Strong sellStrong buy
Strong sellSellNeutralBuyStrong buy
Moving Averages
Neutral
SellBuy
Strong sellStrong buy
Strong sellSellNeutralBuyStrong buy
Moving Averages
Neutral
SellBuy
Strong sellStrong buy
Strong sellSellNeutralBuyStrong buy
Displays a symbol's price movements over previous years to identify recurring trends.