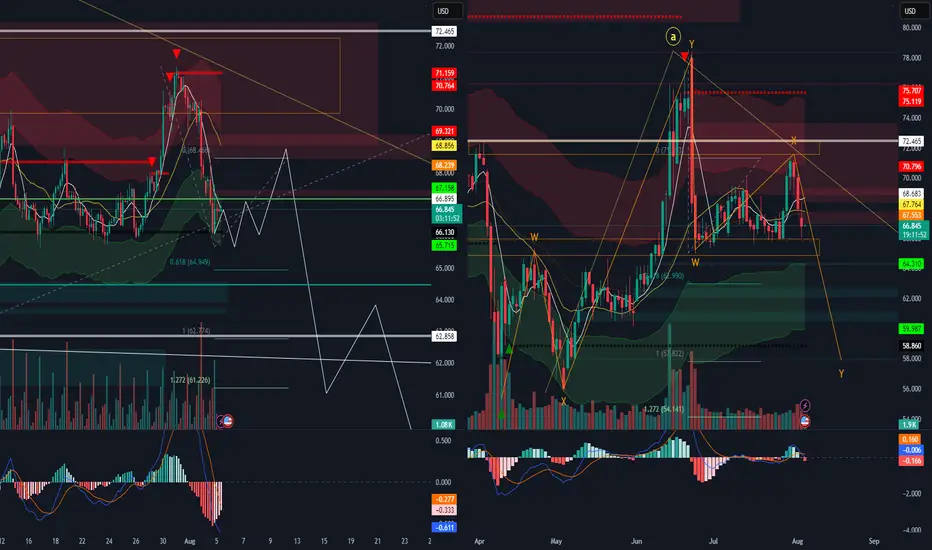
Oil Seems to soon drop downOil grand super Cycle suggests a further down move pursuing wave B towards 57.845 or 50.268. However before this great move down, we should see a slight fall to 66.104 or 65.673 the a sudden jump to 69.141 from that level we may see a drop in probably august to the 50.268 or 62.858
SPOTCRUDE trade ideas
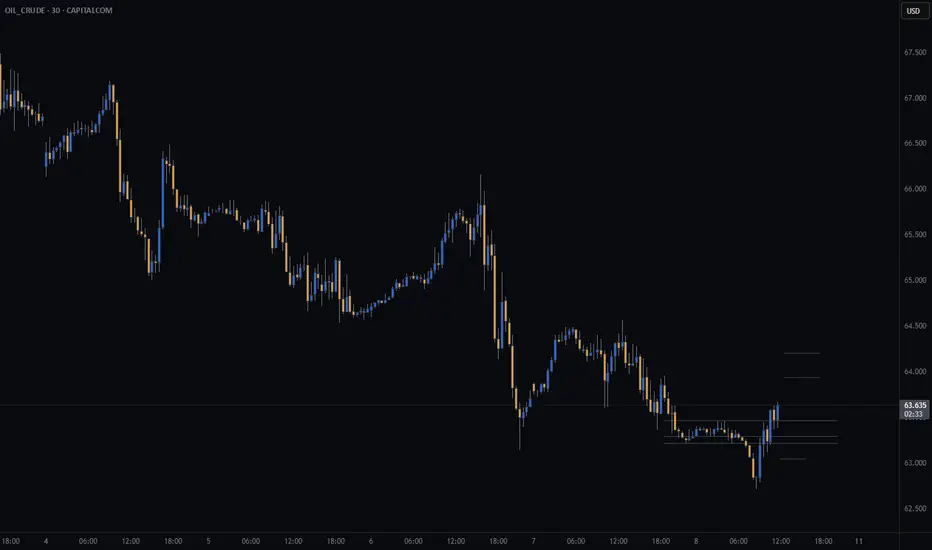
Is oil price heading back up? Watching a potential inverse head and shoulders forming on the 30-minute chart for Oil.
🔹 Risk/Reward: 2.7
🔹 Entry: 63.290
🔹 Stop Loss: 63.043
🔹 Take Profit 1 (50%): 63.93
🔹 Take Profit 2 (50%): 64.21
A couple of key factors still need to align before I pull the trigger:
• One will confirm around 14:45 SAST (GMT+2)
• Looking for lower volume on the right shoulder compared to the left
What do you think? Is oil ready to push higher?
Drop your thoughts or how you trade inverse head and shoulders below! 👇
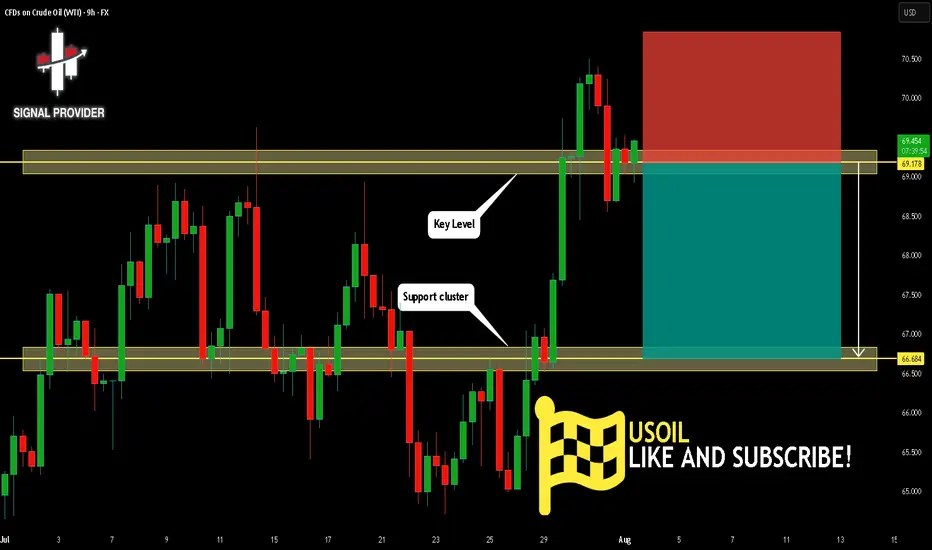
USOIL Is Bearish! Short!
Please, check our technical outlook for USOIL.
Time Frame: 9h
Current Trend: Bearish
Sentiment: Overbought (based on 7-period RSI)
Forecast: Bearish
The market is approaching a significant resistance area 69.178.
Due to the fact that we see a positive bearish reaction from the underlined area, I strongly believe that sellers will manage to push the price all the way down to 66.684 level.
P.S
The term oversold refers to a condition where an asset has traded lower in price and has the potential for a price bounce.
Overbought refers to market scenarios where the instrument is traded considerably higher than its fair value. Overvaluation is caused by market sentiments when there is positive news.
Disclosure: I am part of Trade Nation's Influencer program and receive a monthly fee for using their TradingView charts in my analysis.
Like and subscribe and comment my ideas if you enjoy them!
WTI: downside potentialHi traders and investors!
This analysis is based on the Initiative Analysis concept (IA).
Weekly timeframe
A buyer initiative is tentatively developing, yet the strongest buyer candle (highest volume) produced no follow-through. It was followed by two buyer candles on weak volume. Last week volume expanded again and clustered around 69.975, showing that sellers are still defending this level. Weekly seller targets: 65.628 and 64.378.
Daily timeframe
Sellers remain in control. The chart clearly shows volume manipulation around 69.975. Daily seller targets: 65.628 and 64.736.
Wishing you profitable trades!

Crude oil under pressure as geopolitical talks developCrude oil confirms the bearish trend, having pressured from intermediate-term peak. The fair price, according to the STEO forecast, stays at around $60 and that level might be perceived as a target area for the current price swing.
Geopolitical agenda adds more pressure on oil, as Steve Witkoff, the special negotiator from Donald Trump’s team, has visited Moscow and had a positive effect from talks with Vladimir Putin. Next week, markets will look forward to potential three-sided talks between Ukraine, Russia and the US. This situation adds more pressure to the already bearish Crude oil market.
One may think of cautious short positions in the direction of a price swing, closing it before “the news”.
Don't forget - this is just the idea, always do your own research and never forget to manage your risk!
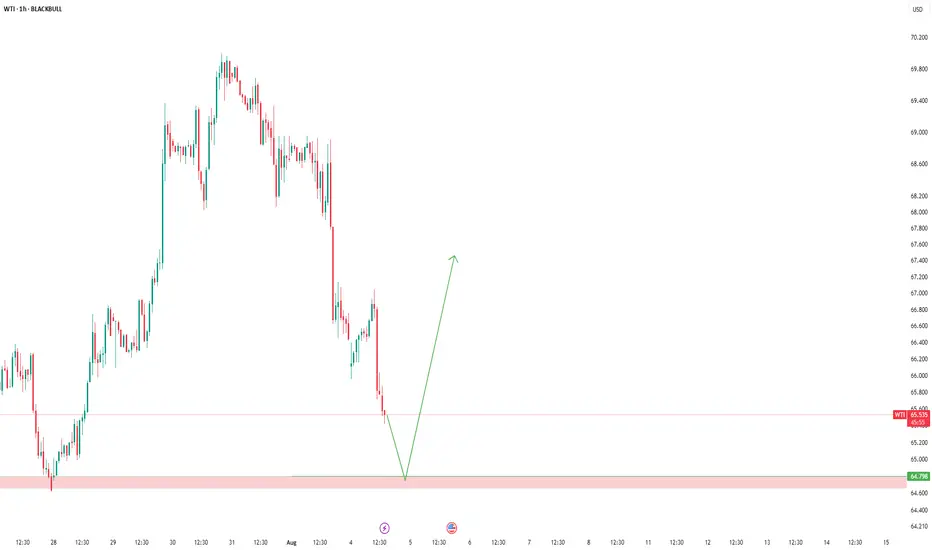
WTI Crude Oil – Range Support in FocusWe're waiting for price to reach the bottom of the range, and with a solid buy signal, we’ll consider going long.
However, since this level has been tested multiple times, it’s highly vulnerable to stop fishing — so caution is key.
As always, we’re ready for all scenarios:
If price breaks below, we’ll wait for a pullback to enter short.
But right now, we’re watching the range support for potential longs
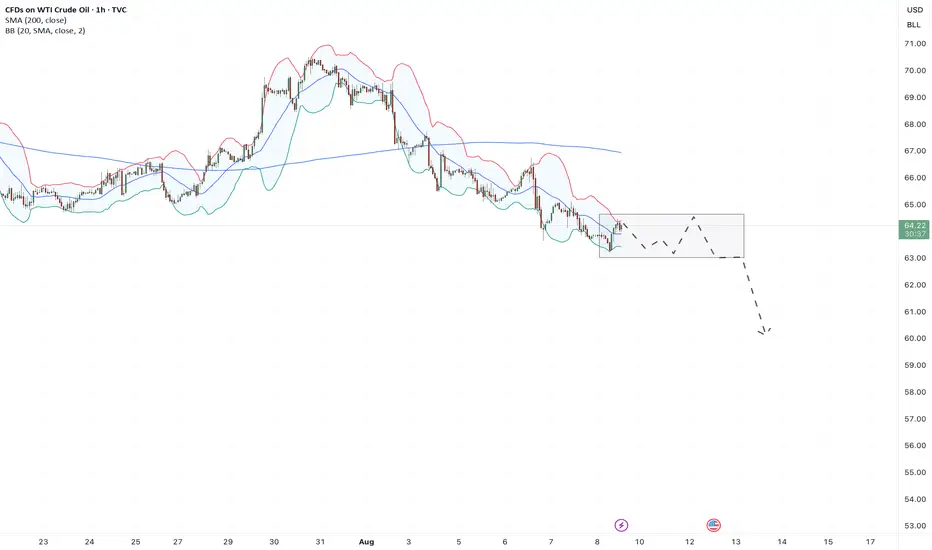
WTI Crude Oil (USOIL) Technical Analysis:WTI is currently trading near the $65.90 support zone after a strong break below $67.00, indicating increased downside risk if no buying interest appears.
🔹 Bearish Scenario:
If the price breaks below $65.00 and holds, the next support target may be around $62.00.
🔹 Bullish Scenario:
If the price recovers and breaks above $67.00, it could move to retest $69.50, and if bullish momentum continues, potentially extend to $70.50.
⚠️ Disclaimer:
This analysis is not financial advice. It is recommended to monitor the markets and carefully analyze the data before making any investment decisions.
How long can the decline in US crude oil prices last?
💡Message Strategy
On Monday (August 4) during the Asia-Europe session, WTI fell for three consecutive days, with a drop of 1.16% today, trading around 66.55. OPEC+'s decision to increase production, coupled with geopolitical and economic policies, has jointly formed the expectation that oil prices will be "weak and volatile, dominated by downward pressure."
Short-Term: Increased Supply Drives Price Decline
OPEC+'s decision to increase production directly led to further declines in oil prices on Monday (Brent crude fell 0.28% to $69.23/barrel, and WTI fell 0.46% to $67.01/barrel), extending Friday's decline. Market expectations of oversupply reinforced bearish sentiment, particularly as the UAE's additional production increase (accounting for 2.4% of global demand) further amplified the signal of easing supply. However, India's announcement to continue purchasing Russian crude oil partially offset the impact, limiting the price decline and failing to shift the short-term downward trend.
Medium-Term: Supply-Demand and Policy Risks Intertwine
On the Supply Side: OPEC+'s production increase plan may be paused after September, as Goldman Sachs anticipates accelerated OECD inventory accumulation and fading seasonal demand support. However, if US shale oil production is forced to cut production at break-even points due to low oil prices, OPEC+ may adjust its strategy and even consider further releasing the remaining 1.66 million barrels/day of production capacity, which would continue to suppress oil prices.
Long-Term: Market Share Competition and Structural Overcapacity
OPEC+'s production increase strategy aims to reshape the global oil landscape by squeezing out high-cost producers, such as US shale oil, through low prices. Due to rising equipment costs driven by tariffs and low oil prices, US shale oil companies have cut capital expenditures, resulting in a decline in the number of active drilling rigs and a slowdown in production growth. This strategic game is likely to keep oil prices in a low range for a long time, with significant long-term downward pressure. Unity within OPEC+ and coordination between Saudi Arabia and the UAE will be key to policy implementation.
📊Technical aspects
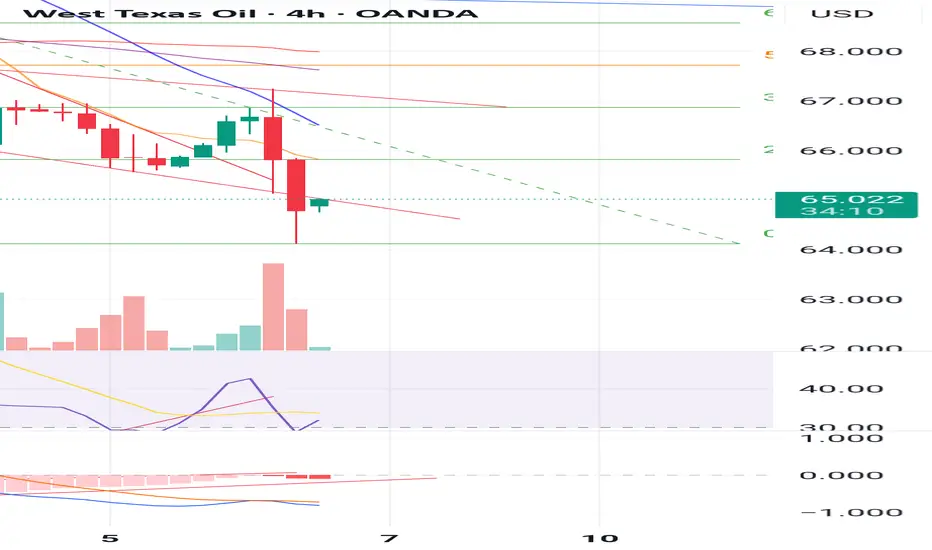
Crude oil's short-term (1H) trend has reversed downward from its highs. The moving averages are diverging and aligning downward, indicating a downward trend in the short term.
The K-line chart has continued to close with small real bodies, and the MACD indicator is about to form a golden cross near the zero axis, signaling weakening downward momentum and a bullish bias on pullbacks. Crude oil is expected to remain weak and downward today, with a potential correction near $65.00.
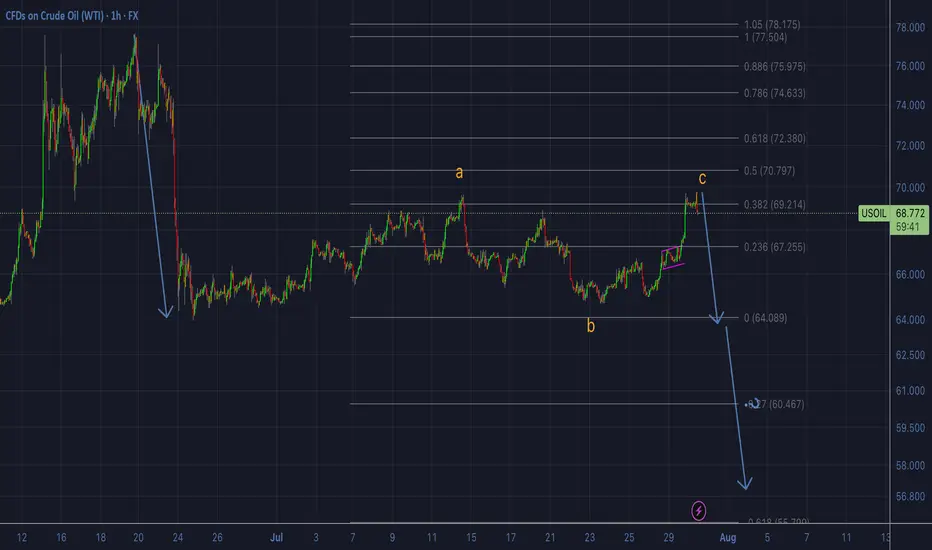
OIL - shortFollowing our previous forecasted up-move, from now on we will switch to looking for sell setups only. We would normally expect the C wave of the corrective pattern retrace all the way to the 0.618 fib of the downward impulse, as the A wave had already retraced to the 0.382. But that isn't necessarily always the case. As long as the C retracement has broken the top of the A retracement, the pattern formally speaking can be complete. We will not be looking for further buys, therefore, from now on. Even if it does continue to the 0.618, we will skip the eventual buy and focus on the sells. At the same time, because the eventuality of more up exists, we will wait for a proper sell setup before we enter any short position. Updates will follow.
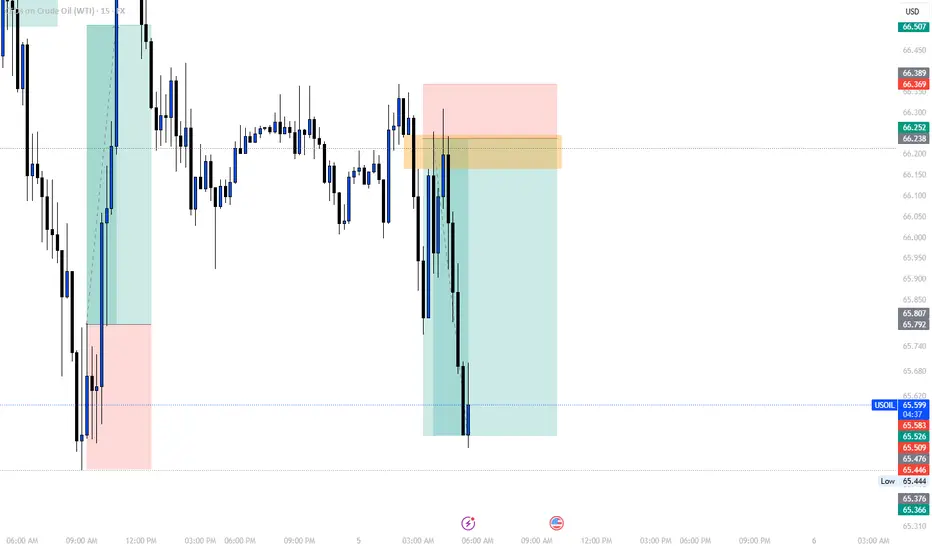
TP REACHED ON OUR TRADE ON OILEarly this morning I posted to sell on OIL, now here I am with the results of the price reaching our TP.
Our entry was based on a reversal and a FVG as you can see on the chart, target was the previous low which the market exactly reached.
Follow for more!
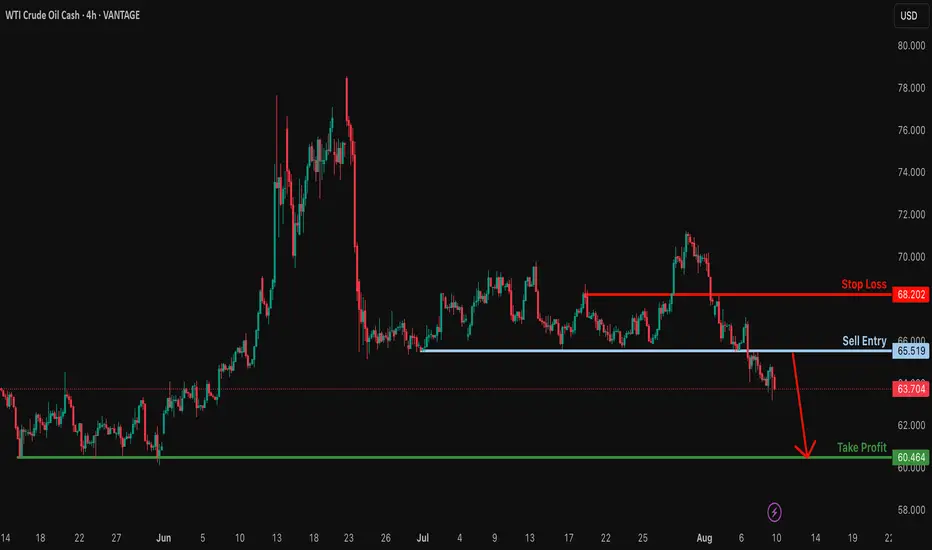
Bearish drop?USO/USD has reacted off the resistance level which is a pullback resistance and could potentially drop from this level to our take profit.
Entry: 65.51
Why we like it:
There is a pullback resistance.
Stop loss: 68.20
Why we like it:
There is a pullback resistance.
Take profit: 60.46
Why we like it:
There is a multi swing low support.
Enjoying your TradingView experience? Review us!
Please be advised that the information presented on TradingView is provided to Vantage (‘Vantage Global Limited’, ‘we’) by a third-party provider (‘Everest Fortune Group’). Please be reminded that you are solely responsible for the trading decisions on your account. There is a very high degree of risk involved in trading. Any information and/or content is intended entirely for research, educational and informational purposes only and does not constitute investment or consultation advice or investment strategy. The information is not tailored to the investment needs of any specific person and therefore does not involve a consideration of any of the investment objectives, financial situation or needs of any viewer that may receive it. Kindly also note that past performance is not a reliable indicator of future results. Actual results may differ materially from those anticipated in forward-looking or past performance statements. We assume no liability as to the accuracy or completeness of any of the information and/or content provided herein and the Company cannot be held responsible for any omission, mistake nor for any loss or damage including without limitation to any loss of profit which may arise from reliance on any information supplied by Everest Fortune Group.
HHarami about to close in 30 minutes with macd and rsi divergence 1-4 hr 😅 tough luck if you're shorting after a 10% fall 😅
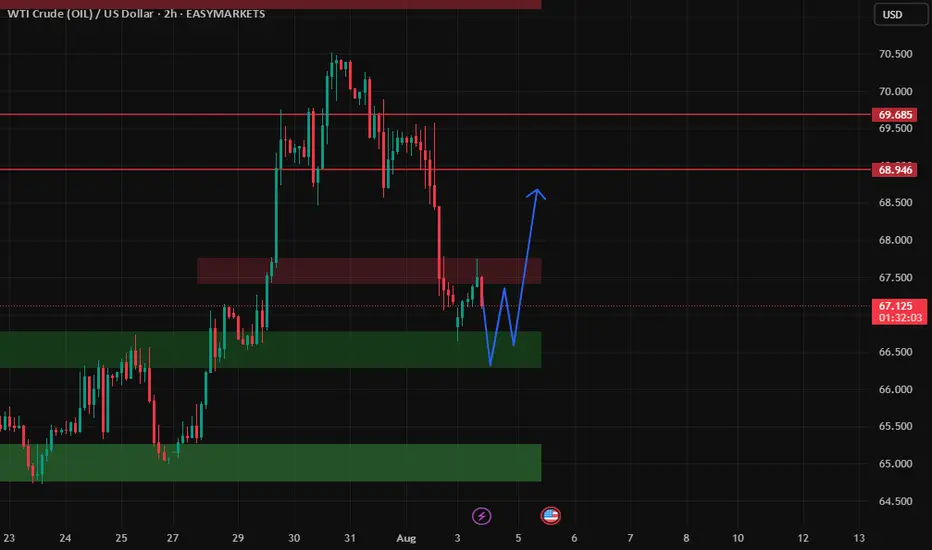
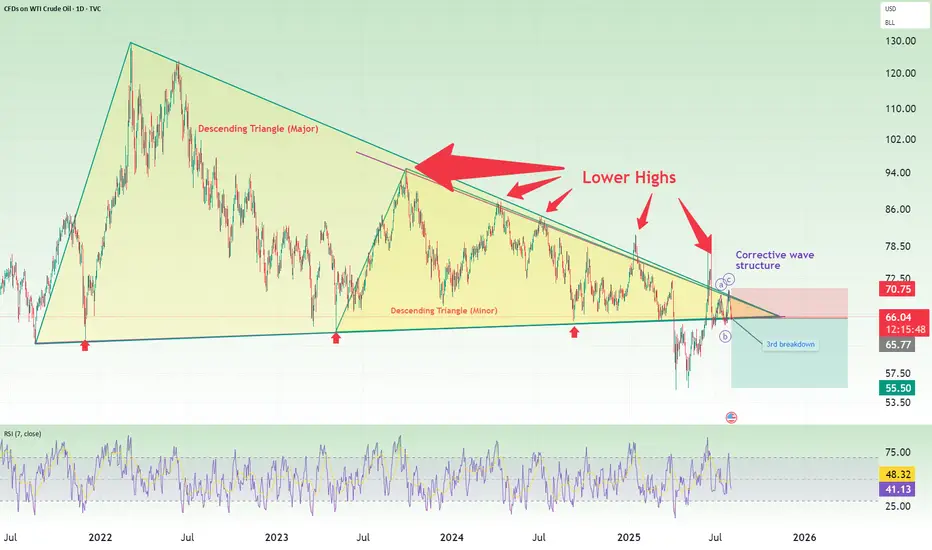
Oil short: breakdown from triangle againThis idea is backed by my general view that the stock market is going to crash in August. what this means is that we are going into a risk-off environment and there will be reduced consumption and demand for oil too.
Technically, I pointed out 4 things in this chart:
1. Descending triangles
2. Lower highs
3. 3rd breakdown (after a false break to the upside)
4. A corrective wave structure
Good luck!
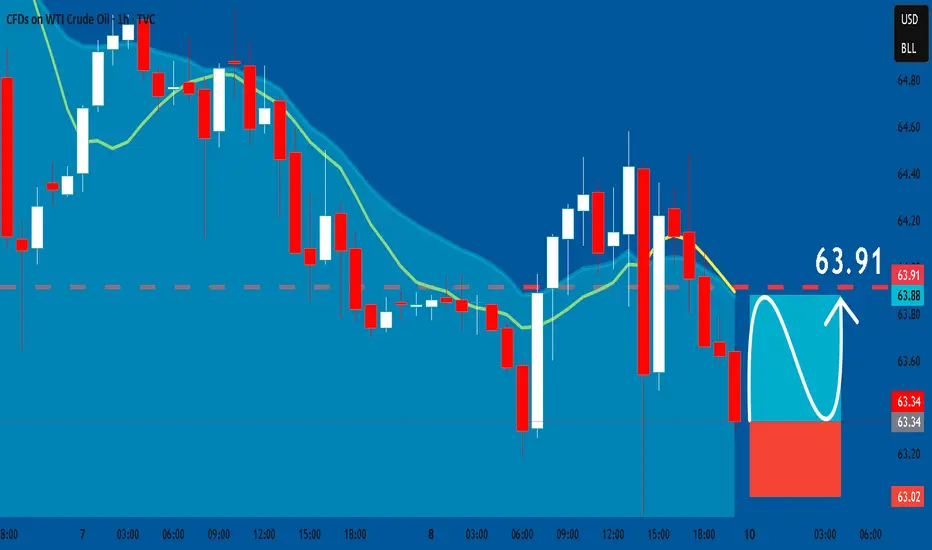
USOIL: Long Signal with Entry/SL/TP
USOIL
- Classic bullish formation
- Our team expects pullback
SUGGESTED TRADE:
Swing Trade
Long USOIL
Entry - 63.34
Sl - 63.02
Tp - 63.91
Our Risk - 1%
Start protection of your profits from lower levels
Disclosure: I am part of Trade Nation's Influencer program and receive a monthly fee for using their TradingView charts in my analysis.
❤️ Please, support our work with like & comment! ❤️
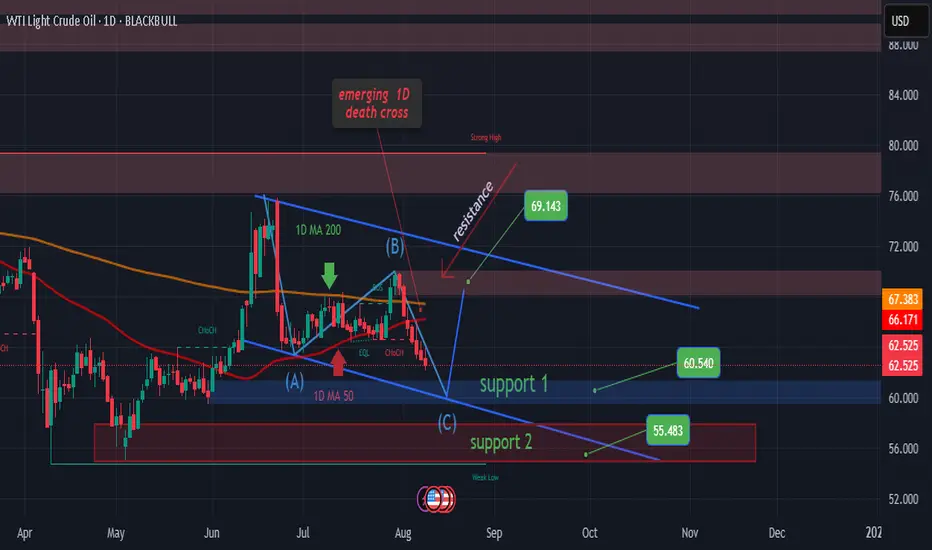
USOIL - EMERGING 1D DEATH CROSS ALERT
WTI Crude is breaking lower and is now forming its first 1D Death Cross since September 2024. While this setup is usually considered bearish, the last time it appeared, the market bottomed just two days later.
Currently, price is heading toward Support 1 ($60.54), with an extended bearish target at Support 2 ($55.48) if downside momentum accelerates. That said, the 1D RSI will be close to oversold by the time Support 1 is reached, increasing the probability of a rebound toward the Resistance zone at $69.29.
📉 Short-term bias: Bearish toward support
📈 Medium-term bias: Potential rebound once support is tested
#USOIL #WTI #CrudeOil #DeathCross #TechnicalAnalysis #Kaizo
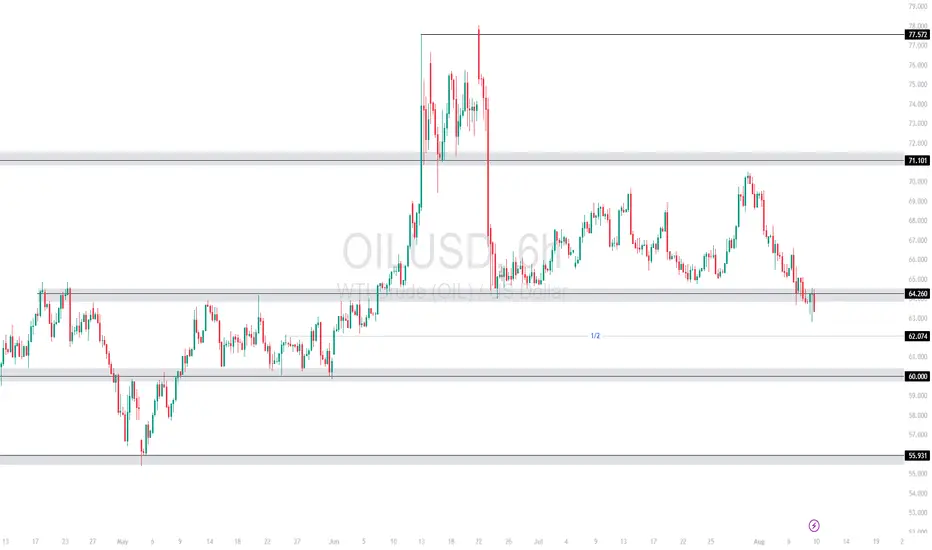
OILUSD Bears Testing – Can 62.074 Hold or Will 60.000 Be Next?Price has broken below the 64.260 🔽 support zone and is now retesting it from the underside, showing bearish pressure. The market is currently leaning toward further downside unless bulls can reclaim 64.260. The next key support sits at 62.074 🔽, which has acted as a strong reaction point in the past.
Currently trading at 63.44, with
Support at: 62.074 🔽, 60.000 🔽, 55.931 🔽
Resistance at: 64.260 🔼, 71.101 🔼, 77.572 🔼
Bias:
🔼 Bullish: A breakout and hold above 64.260 could open the path toward 71.101.
🔽 Bearish: Failure to reclaim 64.260 may keep sellers in control, targeting 62.074 and potentially 60.000.
📛 Disclaimer: This is not financial advice. Trade at your own risk.
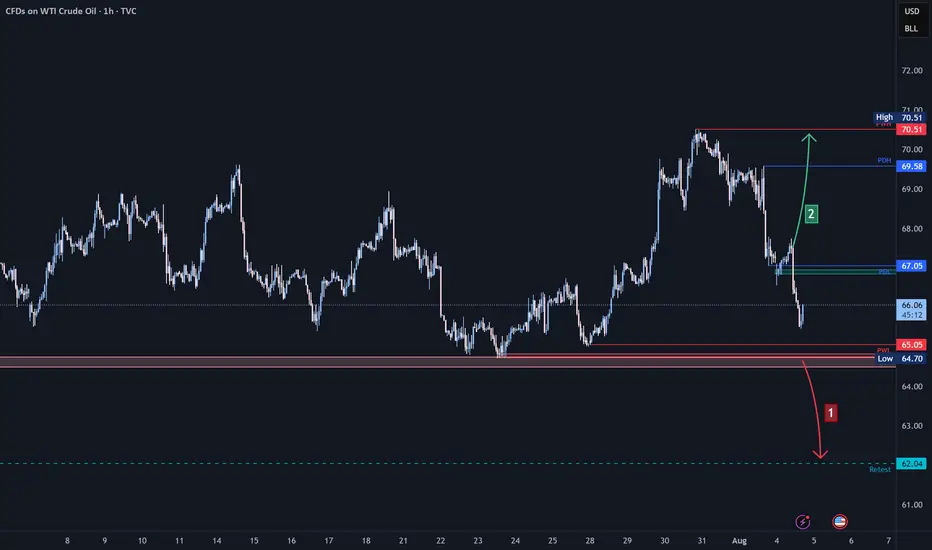
Crude Oil (WTI / USOIL) Analysis:Crude oil is currently trading near a short-term resistance area at $64.00, while the overall trend remains bearish.
🔻 Bearish Scenario:
If the price breaks below $63.25 and holds beneath it, we could see a move toward the $62.00 support level.
🔺 Bullish Scenario:
If the price regains strength and breaks above $64.00, it may retest the $65.00 level. With continued bullish momentum, it could reach as high as $66.30.
⚠️ Disclaimer:
This analysis is not financial advice. It is recommended to monitor the markets and carefully analyze the data before making any investment decisions.
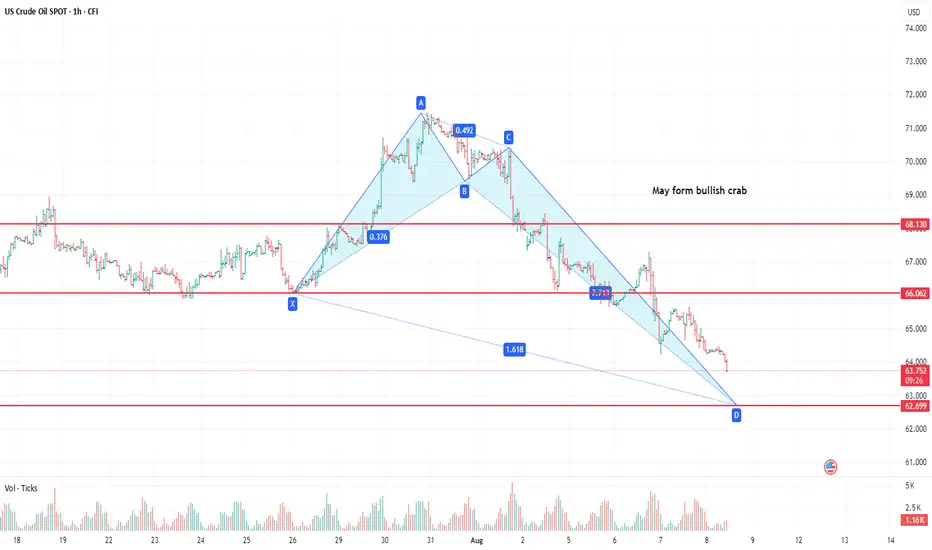
WTI crude spotafter breaching 65.238 wti get more weaker as its wave 3 or c open and may take it to 57-58 $ but one bearish crab again also appear may develop. Levels in chart, sell on rally market but near that level with sl and buy signal one can see reversal. I am not Sebi registered analyst. This is not buy , sell hold recommendation.
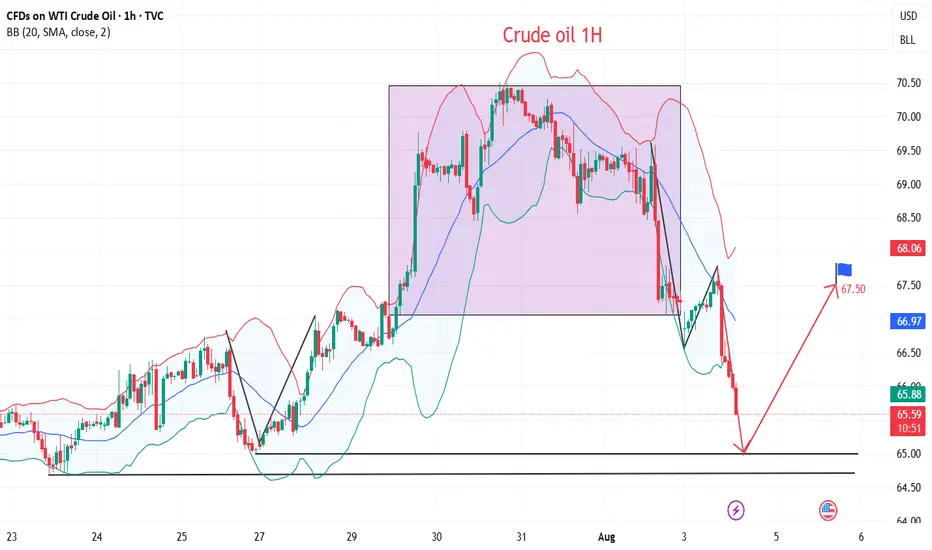
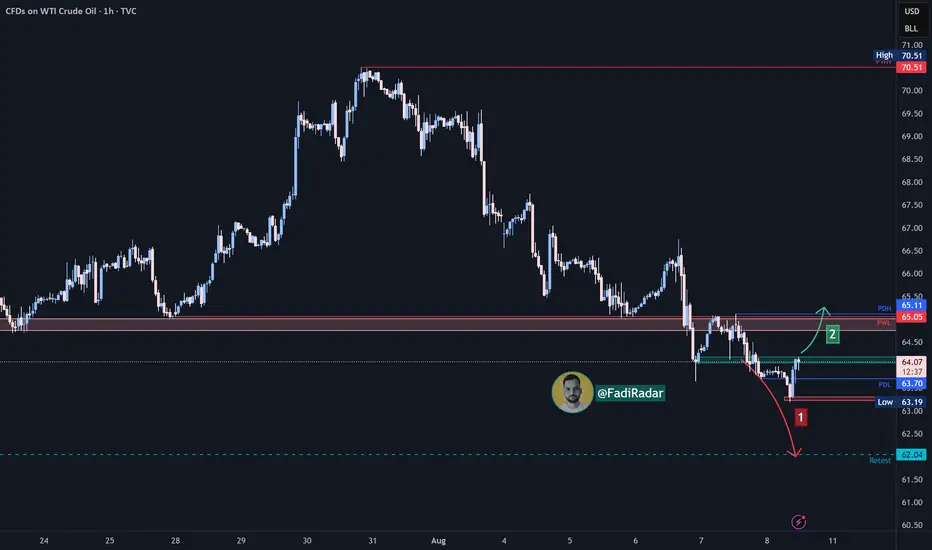
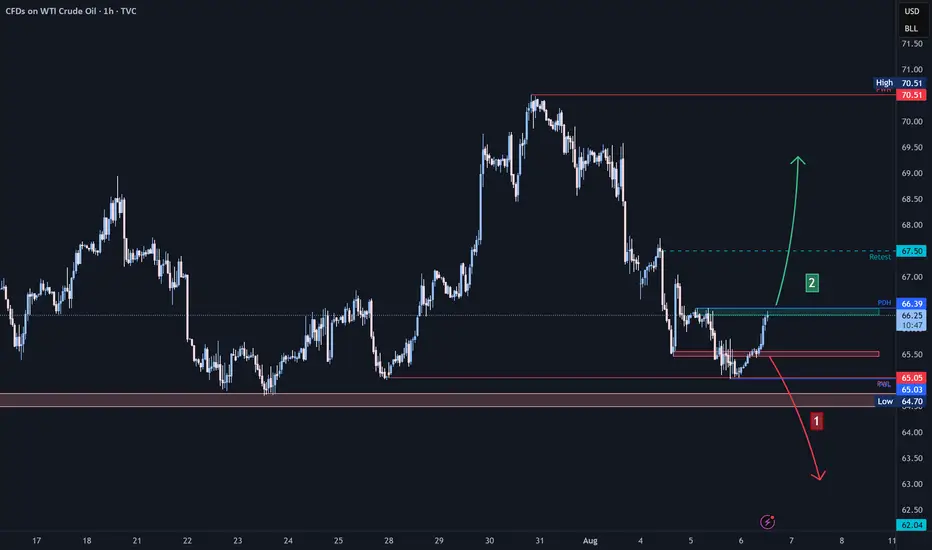
Crude Oil Analysis (WTI / USOIL):Crude oil is currently trading near a key resistance area around $66.30.
🔻 Bearish Scenario:
A break and close below $65.50 may lead to a decline toward the next major support at $64.50.
🔺 Bullish Scenario:
If the price breaks back above $66.35 and holds, we may see a retest of the $66.90 zone.
📈 Continued bullish momentum could drive the price toward $67.50.
⚠️ Disclaimer:
This analysis is not financial advice. It is recommended to monitor the markets and carefully analyze the data before making any investment decisions.
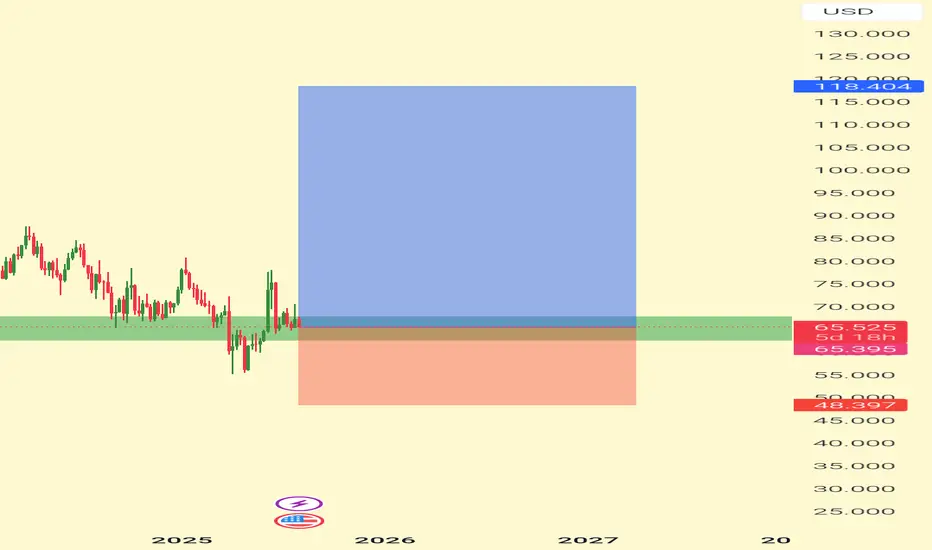
Wait for a surge in oil price to around 120$Taking into account the price action specially in the daily timeframe that an inverse head and shoulders pattern are visible and the strong weekly support and taking into account the escalation of conflicts and war in the middle east, it's non of a surprise to see a 120$ oil price in a matter of some weeks or months.
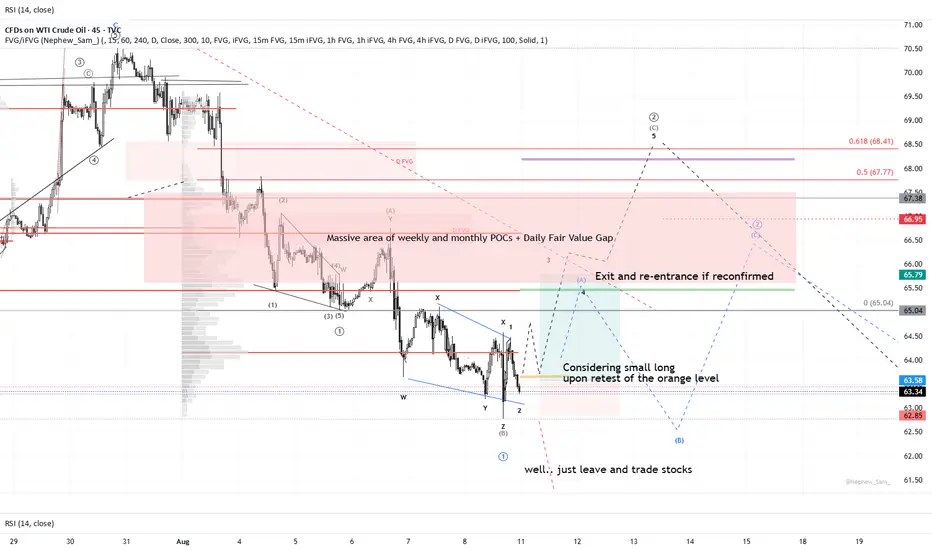
OIL:Trading Against the Trend: Waiting for a Correction to ShortI'm still battling the market here, waiting for a pullback that would:
Reject price from resistance
Print a clean corrective wav
e for a short entry
Counter-trend trading usually ends as well as holding over weekends—poorly.
That said, levels keep the roadmap clear. Pullbacks can play out a dozen ways.
A bounce into these zones would also sweep last week's FVG liquidity.
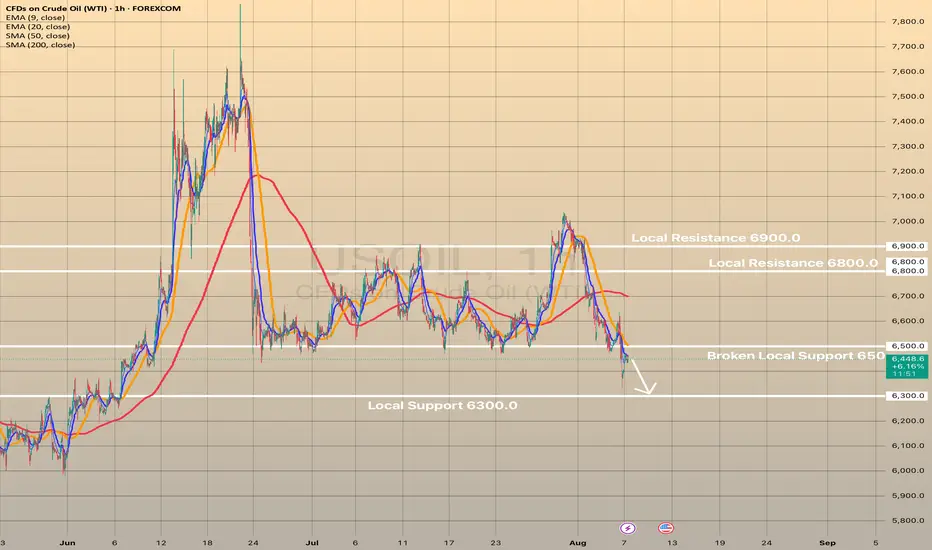
USOIL declines on possibility of geopolitical stabilityUSOIL declines on possibility of geopolitical stability
Crude oil and gasoline prices fell August 6 after an early rally, as Trump announced "great progress" in U.S.-Russia talks to end the Ukraine war, reducing fears of new sanctions on Russian energy exports. Additionally, OPEC+’s planned 547,000 bpd production increase for September further pressured prices amid concerns of a global oil supply glut.
Technically, USOIL broke crucial local support at 6,500.00. Currently, the price is retesting this level. The decline towards 6,300.00 is expected in short-term.