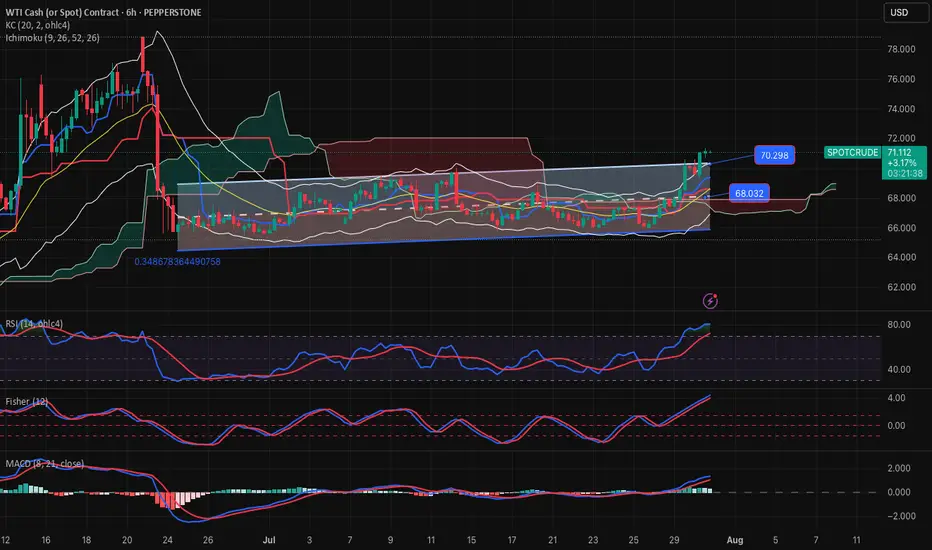
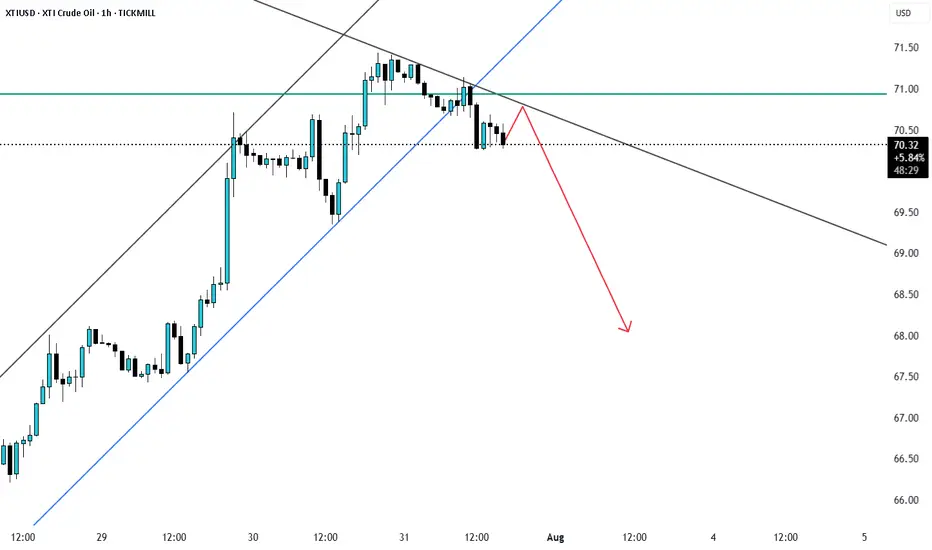
OIL-SELL strategy 6 hourly chart Reg. ChannelOIL has moved up sharply and we are moving beyond the regression channel. This usually will not last especially when overbought status.
Stragtegy SELL @ $ 70.90-71.30 and take profit near 69.37 for now.
SPOTCRUDE trade ideas
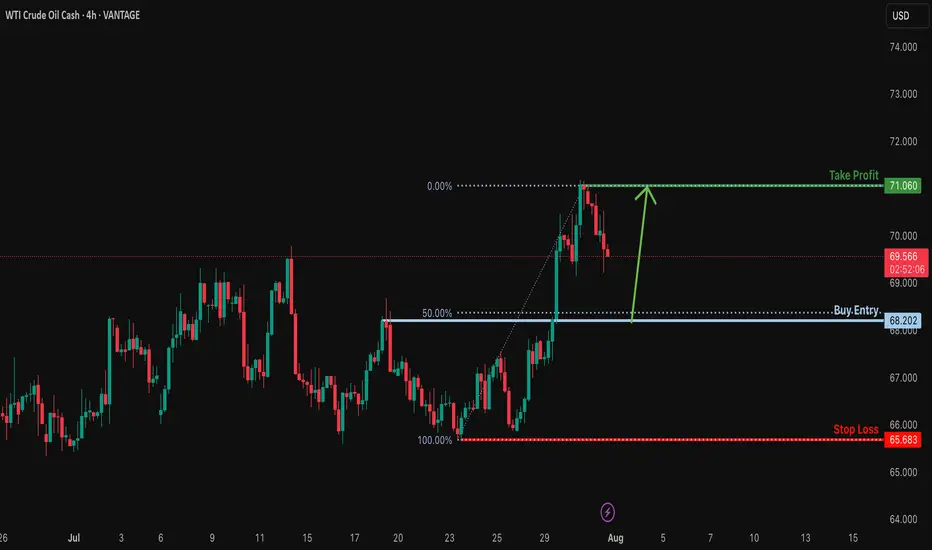
Bullish bounce off 50% Fibonacci support?USOUSD is falling towards the support levle which is a pullback support that aligns with the 50% Fibonacci retracement and could bounce from this level to our take profit.
Entry: 68.20
Why we like it:
There is a pullback support that lines up with the 50% Fibonacci retracement.
Stop loss: 65.68
Why we like it:
There is a multi swing low support.
Take profit: 71.06
Why we like it:
There is a swing high resistance.
Enjoying your TradingView experience? Review us!
Please be advised that the information presented on TradingView is provided to Vantage (‘Vantage Global Limited’, ‘we’) by a third-party provider (‘Everest Fortune Group’). Please be reminded that you are solely responsible for the trading decisions on your account. There is a very high degree of risk involved in trading. Any information and/or content is intended entirely for research, educational and informational purposes only and does not constitute investment or consultation advice or investment strategy. The information is not tailored to the investment needs of any specific person and therefore does not involve a consideration of any of the investment objectives, financial situation or needs of any viewer that may receive it. Kindly also note that past performance is not a reliable indicator of future results. Actual results may differ materially from those anticipated in forward-looking or past performance statements. We assume no liability as to the accuracy or completeness of any of the information and/or content provided herein and the Company cannot be held responsible for any omission, mistake nor for any loss or damage including without limitation to any loss of profit which may arise from reliance on any information supplied by Everest Fortune Group.
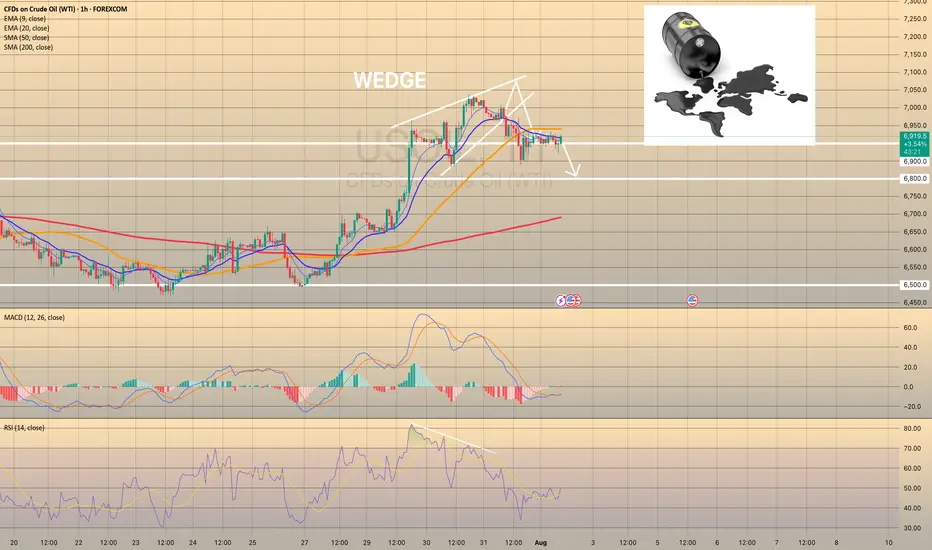
USOIL IS GOING BULLISH. FOR HOW LONG?USOIL IS GOING BULLISH. FOR HOW LONG?
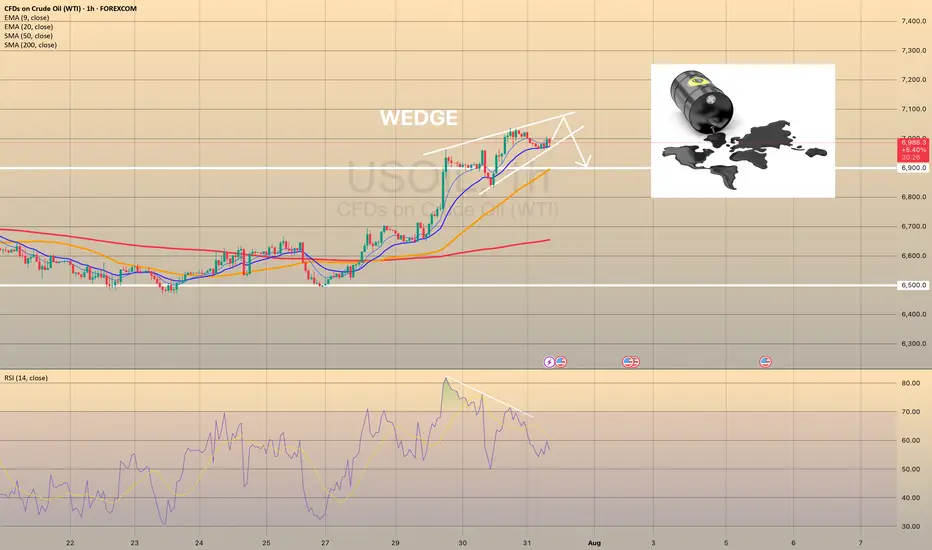
Brent has started this week with a strong bullish momentum and holds near 6-week high on supply fears. President Trump announced plans to impose tariffs on Indian exports and penalize its Russian oil imports. In a parallel move, the US introduced its most extensive sanctions on Iran in seven years. The United States has even offered its oil to the world in exchange for Iranian and Russian oil, but there is evidence that the US production capacity is now at historic highs and is unlikely to grow in the near future.
However, technically oil shows us bearish divergence on RSI and bearish wedge here. The price may reverse towards 6,900.00 as a first target. EIA data showed US crude inventories jumped by 7.7 million barrels last week—the largest increase in six months and defying forecasts for a decline. Market participants are waiting for the OPEC+ meeting this week, expecting a significant output hike.
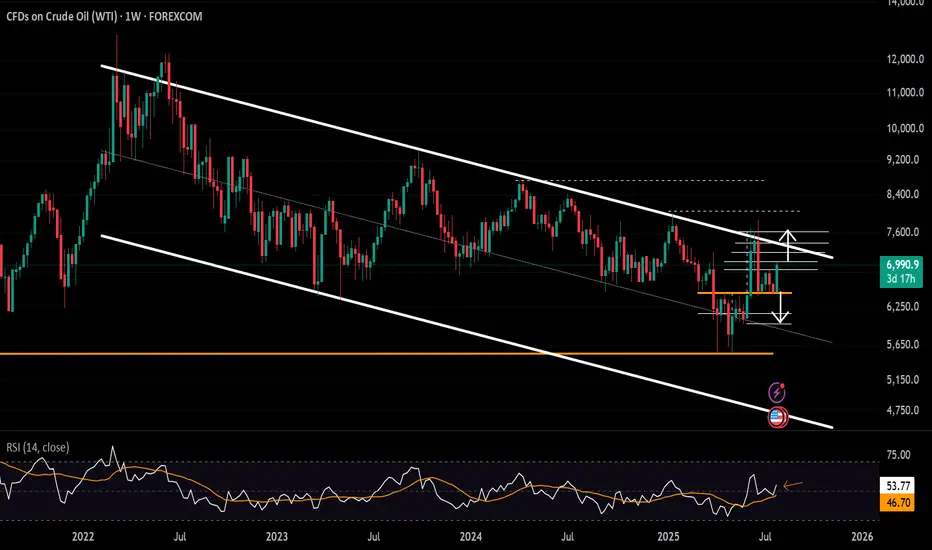
Crude Oil’s $70 Surge Still Faces 3-Year Channel ResistanceAlthough news points to a crude oil price surge, technical analysis indicates price cap risks remain within the borders of a 3-year descending channel.
Should a clear hold emerge above the $70 barrier, the bullish rebound in price action from the $64.40 zone, in line with the weekly RSI’s rebound off the neutral 50 zone, may extend toward the channel’s upper boundary at $72.40, $74.40, and $77 in more extreme scenarios.
A confirmed hold above the $77–78 zone may shift the primary trend away from bearish dominance and pave the way for longer-term bullish forecasts.
On the downside, if a price drop results in a clean break below the $64 barrier, downside risks may extend toward the mid-zone of the long-standing channel, with potential support levels at $63.20, $61.80, and $59.70, respectively.
Written by Razan Hilal, CMT
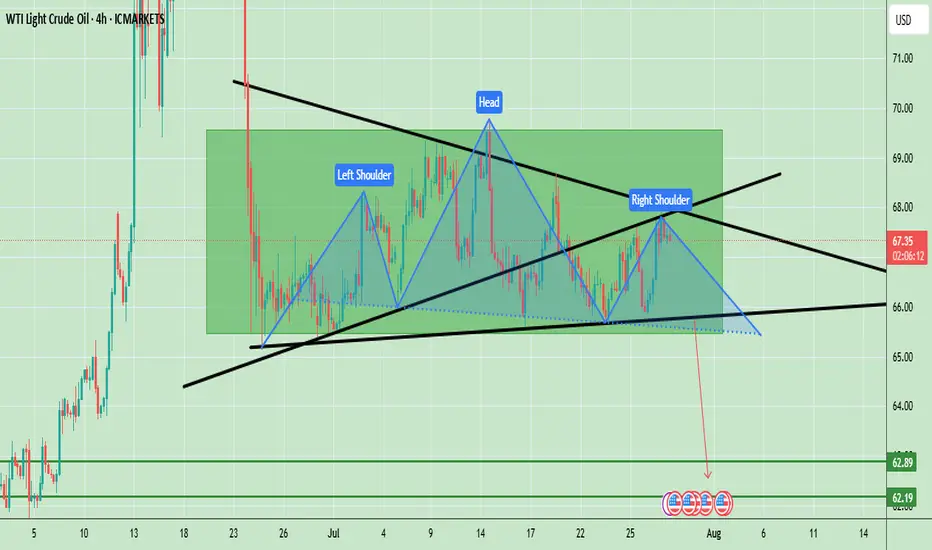
Oil Prices Form Bearish Head & Shoulders – Key Neckline in FocusWTI crude oil is showing a clear Head and Shoulders (H&S) pattern, which is a strong bearish reversal signal. The left shoulder formed in early July, followed by a higher peak forming the head in mid-July, and finally the right shoulder near the current levels, which is lower than the head. The neckline is positioned around $66.00, acting as a key support level. Currently, the price is trading at $67.34, hovering slightly above this neckline, indicating that the market is at a critical decision point. A confirmed break below the neckline could accelerate bearish momentum, targeting the $62.20 – $62.80 zone based on the pattern’s measured move. However, if the neckline holds, a possible bounce toward $68.50 – $69.00 could occur, but overall bias remains bearish unless the price can break and sustain above $69.00.
Key Price Levels:
- Resistance: $68.50 – $69.00
- Neckline Support: $66.00
- Bearish Target (if confirmed): $62.20 – $62.80
Note
Please risk management in trading is a Key so use your money accordingly. If you like the idea then please like and boost. Thank you and Good Luck!
Crude oil starts to rise, are you ready?
💡Message Strategy
Oil prices continued their upward trend amid rising geopolitical risks. US President Trump recently issued a tough statement, demanding Russia end the conflict with Ukraine within 10 to 12 days or face secondary sanctions.
Fears that Russian crude oil exports might be disrupted pushed Brent crude oil prices close to $70 per barrel, marking their largest single-day gain in two weeks at 2.3%. Meanwhile, US West Texas Intermediate (WTI) crude oil prices also remained stable around $67.
The intertwined uncertainties of geopolitics and trade policy have complicated market sentiment. Besides the situation between Russia and Ukraine, investors are closely watching the August 1st trade policy deadline set by the United States and the upcoming OPEC+ meeting in early August, which will determine its September crude oil production increase plan.
The industry generally expects that despite tight crude oil inventories in some parts of the world and strong peak season consumption in the Northern Hemisphere, if OPEC+ continues to increase production, oversupply pressure will gradually emerge by the end of the year.
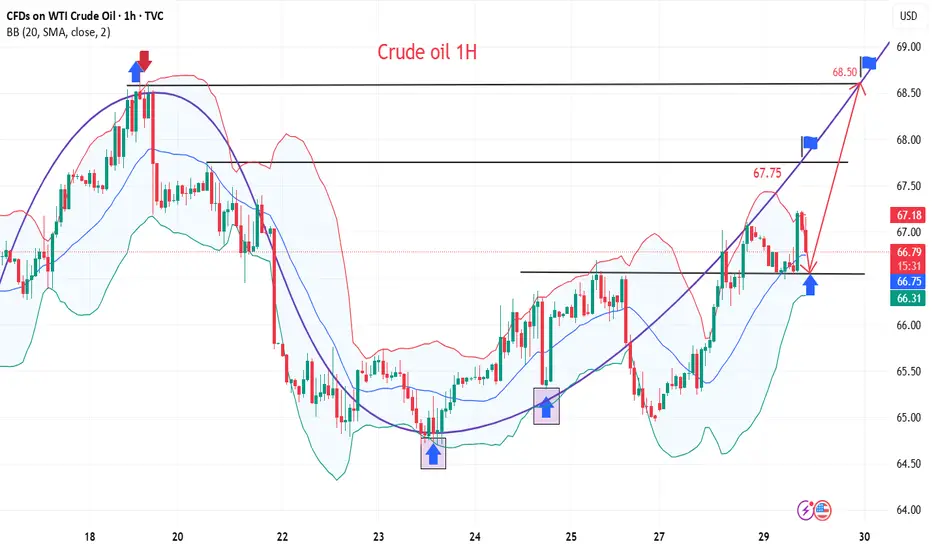
📊Technical aspects
From a technical perspective, the daily chart of US crude oil (WTI) shows a modest upward trend. The current price is trading steadily above its 100-day moving average, indicating continued bullish momentum.
The Relative Strength Index (RSI) remains between 55 and 60, remaining within overbought territory, suggesting further upside potential. A successful break above the key resistance level of $68.50 would open up opportunities towards $70.
💰Strategy Package
Long Position:66.50-67.00,SL:65.50,Target:68.50-69.00
One Last Dip Before the Pop?On the daily timeframe, we anticipate two possible scenarios for USOIL’s movement. In the red-labeled scenario, USOIL is expected to undergo a correction to test the 63.71–64.03 area. However, in the best-case scenario, if USOIL manages to hold above 64.03, it has the potential to strengthen toward the 68.27–72.53 range.

USOIL Robbery Alert! Smart Entry Plan Below Key MA Level🔐💥 “WTI Energy Heist: Thief Trader’s Bearish Master Plan” 💥🔐
The Official Robbery Blueprint for Smart Traders
🌟 Hi! Hola! Ola! Bonjour! Hallo! Marhaba! 🌟
💸 Welcome, Money Makers & Market Robbers! 💸
🚨 Get ready to break into the "US Oil Spot/WTI" market with precision-crafted bearish strategy from the one and only — Thief Trader Style!
📉💣 THE HEIST IS ON: SHORT PLAN LOADED! 💣📉
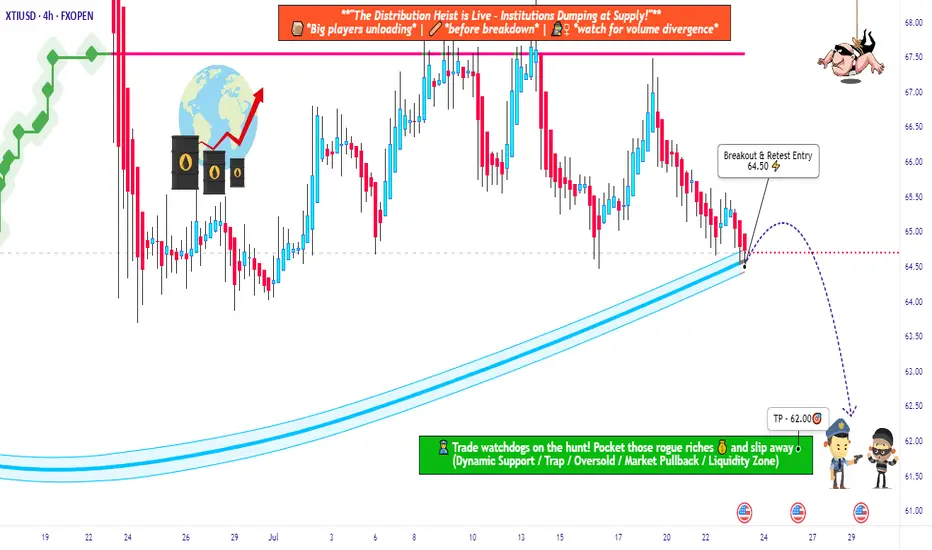
We’ve analyzed the charts using Thief Technicals + Fundamental Lockpick Tools and spotted a high-risk GREEN zone – a consolidation trap where greedy bulls usually get caught. This is where we strike.
🔑 ENTRY:
"Wait for the Neutral Moving Average to Break — Then Make Your Move!"
🎯 Focus zone: 64.50
☠️ Wait for the breakout – do NOT enter before it happens.
✅ Use sell stop orders above the MA line or place sell limit orders on the pullback after the breakout (target within the 15–30 min candle near swing high/low).
🧠 Thief Tip: Layer in entries using the DCA (layered attack strategy) to catch price on its way down. Set a chart alert so you don’t miss the strike moment.
🛑 STOP LOSS:
"Set it smart or don’t set it at all — you choose the fire you want to play with!"
📍 SL only gets placed AFTER breakout.
🎯 Recommended SL at 66.00 on the 4H swing level.
☠️ DO NOT place any orders or SL before confirmation breakout.
📊 Your SL depends on your risk %, lot size, and number of entries stacked.
🎯 TARGET ZONE: 62.50
💸 Lock profits before the bulls wake up. This level is based on market exhaustion zones and historical bounce areas.
🧠 WHY WE'RE SHORTING THIS?
This isn’t just a chart move — it’s backed by full-scale robbery research:
📰 COT Reports
📈 Macro & Seasonal Trends
🛢️ Crude Oil Inventories
💹 Sentiment & Intermarket Correlation
📉 Supply-Demand Dynamics
📚 Before pulling the trigger, educate yourself with the fundamentals. Dive into COT, Seasonal, and Macro reports. Don’t rob blindly — rob smart.
⚠️ Risk Management Alert:
Major news releases? Step back.
Trailing stops? Lock it in.
Position sizing? Know your risk.
Trade like a professional robber, not a street pickpocket.
💥💖 SUPPORT THE ROBBERY PLAN 💖💥
🧨 Smash that BOOST button to support this trading style and help more traders rob the market clean. Every like, every boost makes this community stronger.
💬 Drop a comment, share your entry levels, or post your winning trades.
This is a trading crew – we rob together, we profit together.
🔔 Stay tuned — more heist plans dropping soon.
Until then... Rob Smart. Trade Hard. Take Profits. 💰💪🎯
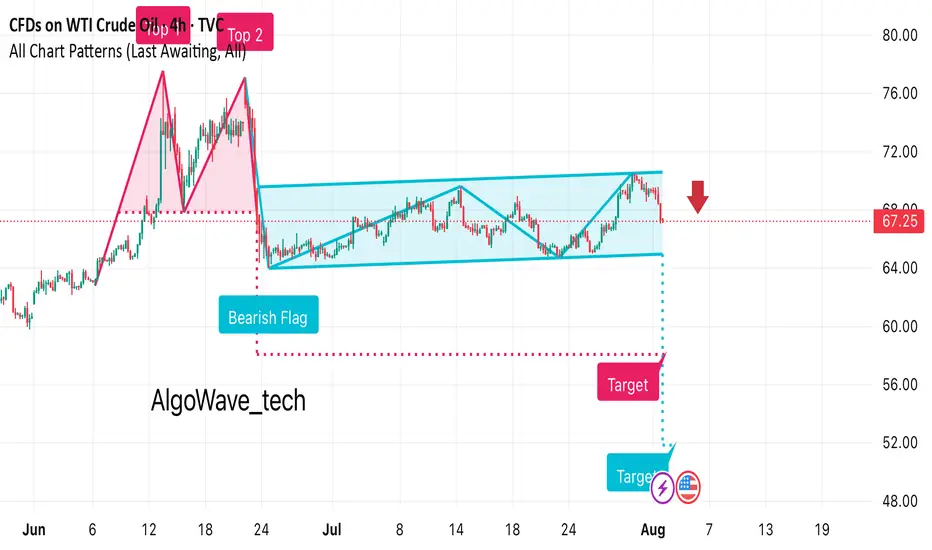
It looks like this chart for WTI Crude Oil is showing a bearish • Previous Move: There’s a strong downward leg before the flag formation, indicating bearish momentum.
• Flag Pattern: Price consolidates in an upward-sloping channel after the drop.
• Breakout: The chart suggests a bearish breakout below the channel, marked with a red arrow at around $67.25.
• Target Projection: The measured move target appears to be around the $53–54 range, based on the flagpole height.
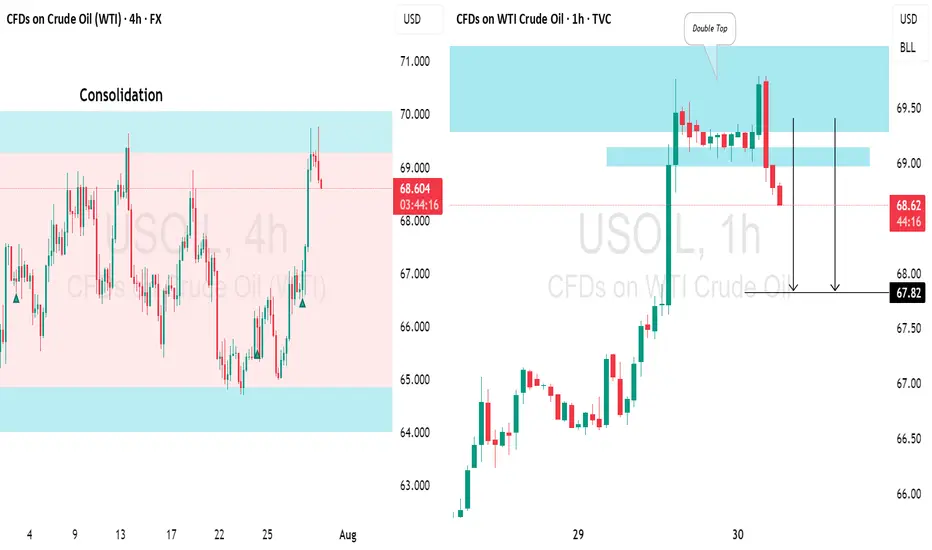
US CRUDE OIL(WTI): Consolidation ContinuesUSOIL is currently consolidating within a horizontal channel and has shown a bearish response at resistance,
The price formed a small double top pattern before declining.
There's a strong likelihood that the price will soon reach the 67.83 level.
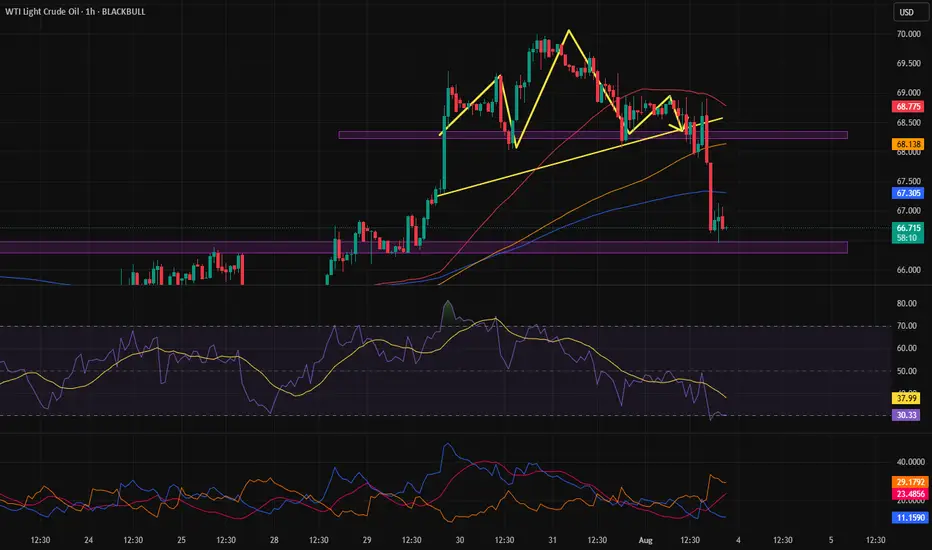
Pattern targetIn the previous analysis, we spotted a head and shoulders pattern and mentioned that if it gets activated, it will hit the pattern target — and that’s exactly what happened.
A clean and beautiful setup.
Market Analysis: Oil Prices Ease – Market Awaits Fresh CatalystMarket Analysis: Oil Prices Ease – Market Awaits Fresh Catalyst
WTI crude oil is also down and remains at risk of more losses below $64.60.
Important Takeaways for WTI Crude Oil Price Analysis Today
- WTI crude oil price continued to decline below the $66.00 support zone.
- It traded below a connecting bullish trend line with support at $65.60 on the hourly chart of XTI/USD at FXOpen.
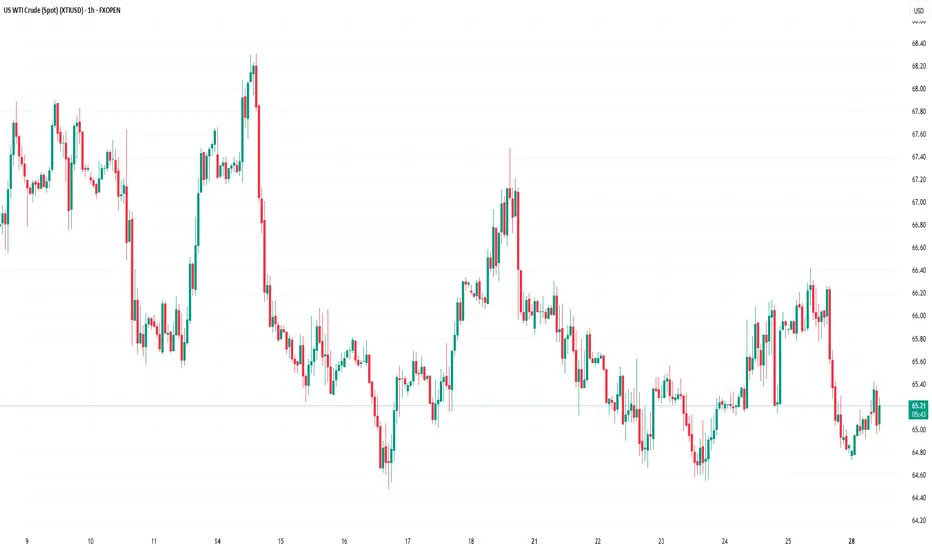
WTI Crude Oil Price Technical Analysis
On the hourly chart of WTI crude oil at FXOpen, the price struggled to continue higher above $67.50. The price formed a short-term top and started a fresh decline below $66.00.
There was a steady decline below the $65.80 pivot level. The bears even pushed the price below $65.00 and the 50-hour simple moving average. The price traded below a connecting bullish trend line with support at $65.60.
Finally, the price tested the $64.75 zone. The recent swing low was formed near $64.73, and the price is now consolidating losses. On the upside, immediate resistance is near the $65.60 zone. It is close to the 50% Fib retracement level of the downward move from the $66.42 swing high to the $64.73 low.
The main resistance is $65.80. A clear move above it could send the price towards $66.40. The next key resistance is near $67.50. If the price climbs further higher, it could face resistance near $70.00. Any more gains might send the price towards the $72.00 level.
Immediate support is near the $64.60 level. The next major support on the WTI crude oil chart is near $63.20. If there is a downside break, the price might decline towards $60.00. Any more losses may perhaps open the doors for a move toward the $55.00 support zone.
This article represents the opinion of the Companies operating under the FXOpen brand only. It is not to be construed as an offer, solicitation, or recommendation with respect to products and services provided by the Companies operating under the FXOpen brand, nor is it to be considered financial advice.
WTI OIL The federal funds rate is the interest rate at which U.S. banks and credit unions lend their excess reserve balances to other banks overnight, usually on an uncollateralized basis. This rate is set as a target range by the Federal Open Market Committee (FOMC), which is the policymaking arm of the Federal Reserve. The current target range as of July 2025 is approximately 4.25% to 4.5%.
The federal funds rate is a key benchmark that influences broader interest rates across the economy, including loans, credit cards, and mortgages. When the Fed changes this rate, it indirectly affects borrowing costs for consumers and businesses. For example, increasing the rate makes borrowing more expensive and tends to slow down economic activity to control inflation, while lowering the rate stimulates growth by making credit cheaper.
The Fed adjusts this rate based on economic conditions aiming to maintain stable prices and maximum employment. It is a vital tool of U.S. monetary policy, impacting economic growth, inflation, and financial markets.
In summary:
It is the overnight lending rate between banks for reserve balances.
It is set as a target range by the Federal Reserve's FOMC.
It influences many other interest rates in the economy.
Current range (July 2025) is about 4.25% to 4.5%.
1. ADP Non-Farm Employment Change (Forecast: +82K, Previous: -33K)
Above Forecast:
If ADP employment is much stronger than expected, the Fed would see this as a sign of ongoing labor market resilience. Robust job growth would support consumer spending, potentially keep wage pressures elevated, and could make the Fed less likely to ease policy soon. This reinforces the case for holding rates steady or staying data-dependent on further cuts.
Below Forecast or Negative:
If ADP jobs gain falls short or is negative again, the Fed may interpret it as a weakening labor market, raising recession risk and reducing inflationary wage pressures. This outcome could increase the chances of a future rate cut or prompt a more dovish tone, provided it aligns with other softening indicators.
2. Advance GDP q/q (Forecast: +2.4%, Previous: -0.5%)
Above Forecast:
A GDP print above 2.4% signals surprisingly strong economic growth and likely sustains the Fed’s view that the U.S. economy is avoiding recession. The Fed may delay rate cuts or take a more cautious approach, as stronger growth can support higher inflation or at least reduce the urgency for support.
Below Forecast or Negative:
Weak GDP—especially if close to zero or negative—would signal that the economy remains at risk of stagnation or recession. The Fed may then pivot to a more dovish stance, become more willing to cut rates, or accelerate discussions on easing to avoid a downturn.
3. Advance GDP Price Index q/q (Forecast: 2.3%, Previous: 3.8%)
Above Forecast:
A significantly higher-than-expected GDP Price Index (an inflation measure) points to persistent or resurgent inflationary pressures in the economy. The Fed might see this as a reason to delay cuts or maintain restrictive rates for longer.
Below Forecast:
If the Price Index prints well below 2.3%, it suggests that inflation is cooling faster than anticipated. This outcome could allow the Fed to move toward easing policy if other conditions warrant, as price stability is more clearly in hand.
Bottom Line Table: Data Surprises and Likely Fed Reaction
Data Surprise Fed Outlook/Action
All above forecast Hawkish bias, rate cuts delayed or on hold
All below forecast Dovish bias, higher chances of rate cut
Mixed Data-dependent, further confirmation needed
Summary:
The Fed’s interpretation hinges on how these figures compare to forecasts and to each other. Stronger growth, jobs, and inflation = less rush to cut; weaker numbers = lower rates sooner. If growth or jobs are especially weak or inflation falls sharply, expect more dovish Fed commentary and a greater likelihood of future easing. Conversely, if the data all surprise to the upside, hawkish (rate-hold) messaging is likely to persist.
The U.S. Dollar Index (DXY) is a financial benchmark that measures the value of the United States dollar relative to a basket of six major foreign currencies. It provides a weighted average reflecting the dollar's strength or weakness against these currencies. The DXY is widely used by traders, investors, and economists to gauge the overall performance and health of the U.S. dollar on the global stage.
Key Features of the DXY:
Currencies included and their weights:
Euro (EUR) – 57.6%
Japanese Yen (JPY) – 13.6%
British Pound (GBP) – 11.9%
Canadian Dollar (CAD) – 9.1%
Swedish Krona (SEK) – 4.2%
Swiss Franc (CHF) – 3.6%
It was established in 1973 after the collapse of the Bretton Woods system to serve as a dynamic measure of the dollar's value.
The index reflects changes in the exchange rates of theses versus the U.S. dollar, with a higher DXY indicating a stronger dollar.
The DXY influences global trade dynamics, commodity prices (like oil and gold)
#SHAVYFXHUB #USOIL #WTI #OIL

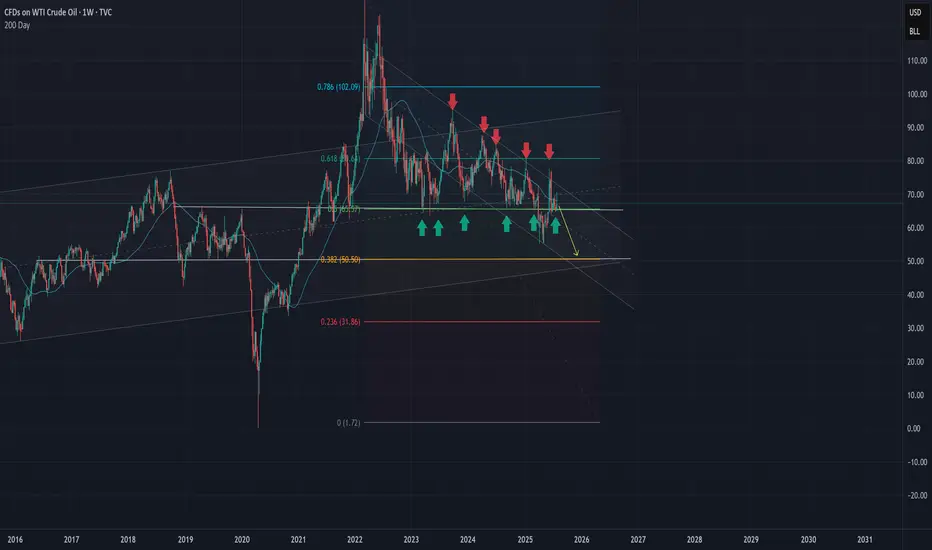
Crude OilOil will go down to %50 by EOY 2026 unless it breaks the upper bound of the downsloping parallel.
XTIUSD rejection from fib 0.5 XTIUSd recently pulled back to fib0.5 level and is currently looks to be reversering as support trendline broke and price may reject from here.
USOIL WTIWest Texas Intermediate (WTI) oil is a major benchmark for crude oil pricing, known for its high quality—being both light and sweet due to its low sulfur content and low density. WTI is sourced primarily from inland Texas and is the underlying commodity for oil futures traded on the New York Mercantile Exchange (NYMEX). The main physical delivery point is Cushing, Oklahoma, a critical U.S. oil storage and trading hub.
Current Price (as of August 1, 2025)
WTI crude oil is trading around $69.15–$69.36 per barrel.
Recently, WTI prices have seen volatility due to global economic factors, including U.S. tariffs, OPEC+ production, and shifts in oil demand. Despite a small decline on the day, oil prices have posted their strongest weekly performance since June, rising over 6% for the week.
Market and Outlook
Recent price movement reflects concerns about global trade tensions, new tariffs, and their impact on economic growth and energy demand. At the same time, supply risks remain due to geopolitical factors such as potential sanctions on Russian oil and U.S.-China trade developments.
Analyst forecasts for the remainder of 2025 suggest continued volatility, with WTI potentially ranging between $56 and $73 per barrel, influenced by demand, OPEC+ decisions, and geopolitical events.
Quick Facts Table
Feature Detail
Type Light, sweet crude
Benchmark NYMEX (U.S.), major global reference
Main Delivery Point Cushing, Oklahoma
Latest Price (Aug 1, 2025) $69.15–$69.36 per barrel
Typical Drivers U.S. tariffs, OPEC+ decisions, trade policy, supply risks, global demand
WTI oil plays a central role in global energy markets, serving as a benchmark for North American and international oil pricing. Its price reflects both supply fundamentals and broader macroeconomic and geopolitical developments.
#OIL #WTI

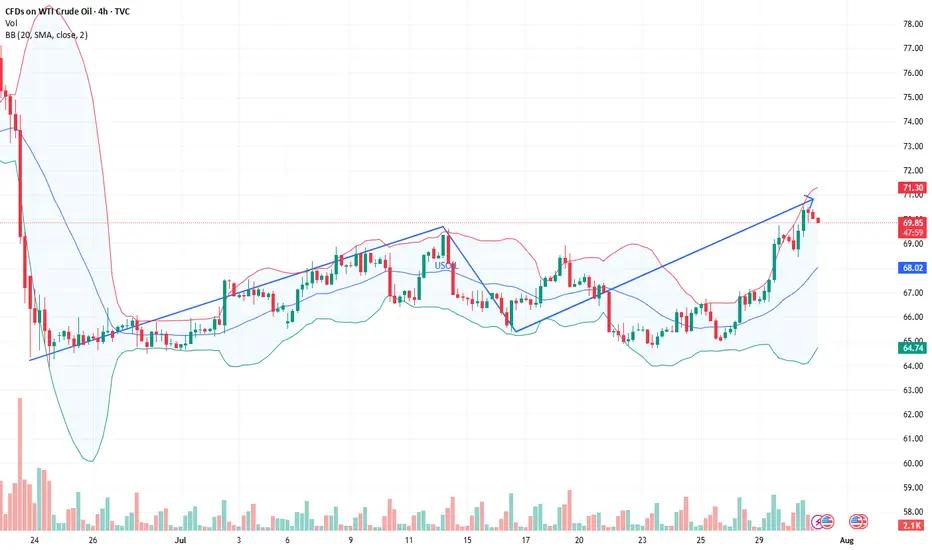
Is the surge in crude oil bulls here a comeback?The news-driven support for crude oil's recent rally is almost exhausted, so we'll continue to adopt a buy-low-sell-high strategy today, using a small stop-loss to maximize profits.
Short at $71.20, with a stop-loss at $71.70 and a take-profit at $69.20. (For aggressive shorting, try shorting at $70.95).
The above strategy is Charlie's personal opinion and is for reference only. If you follow suit, please be cautious and use a stop-loss to protect your position. TVC:USOIL FOREXCOM:USOIL TRADU:USOIL TRADU:USOIL
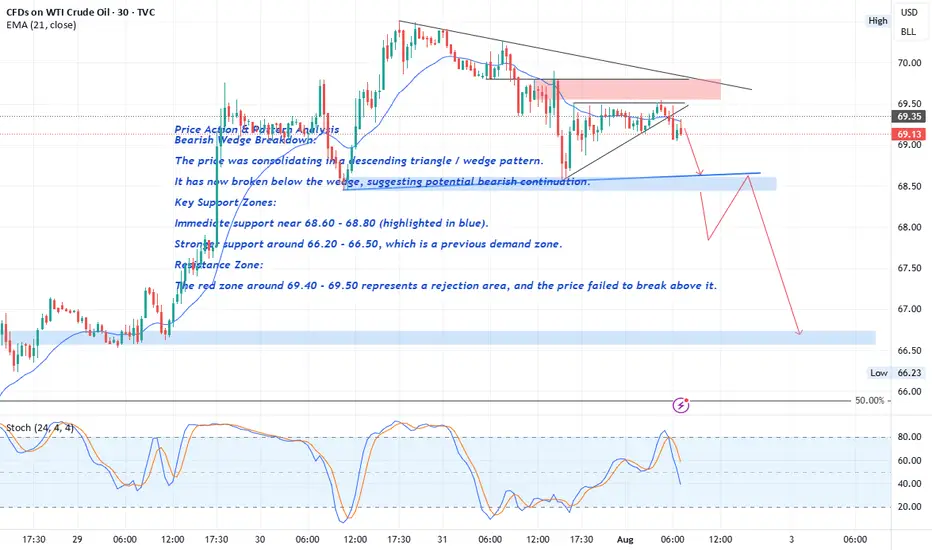
Crude Oil Price Action & Pattern Analysis
Bearish Wedge Breakdown:
The price was consolidating in a descending triangle / wedge pattern.
It has now broken below the wedge, suggesting potential bearish continuation.
Key Support Zones:
Immediate support near 68.60 - 68.80 (highlighted in blue).
FOREXCOM:USOIL
The break of the 68.60 level with a strong bearish candle would serve as confirmation of a Head and Shoulders (H&S) pattern , with solid bearish implications.
Stronger support around 66.20 - 66.50 , which is a previous demand zone.
Resistance Zone:
The red zone around 69.40 - 69.50 represents a rejection area , and the price failed to break above it.
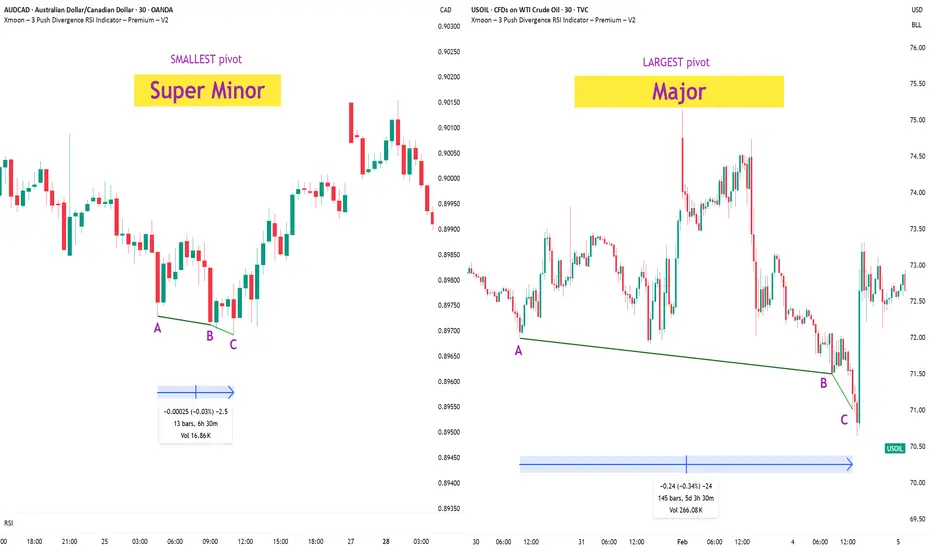
Xmoon Indicator Tutorial – Part 2 – Pivots🔻🔻🔻+ Persian translation below 🔻🔻🔻
🔹 What Is a Pivot?
In the Xmoon strategy, every high or low that forms on the chart is considered a pivot.
The number of candles between two highs or two lows defines the size of the pivot.
The more candles there are between them, the larger and more reliable the pivot becomes.
🔸 Types of Pivots in the Xmoon Indicator Settings
In the settings panel, you can choose which types of pivots the patterns should be based on.
There are 4 pivot types :
• Super Minor → the smallest pivot
• Minor
• Mid Major
• Major → the largest pivot
⏫ As you move from Super Minor to Major, the strength of the pivot increases — but the number of signals decreases.
⚖️ Choosing the Right Pivot = Your Trading Style
• Want more signals? → Use smaller pivots like Minor or Super Minor
• Prefer higher accuracy and lower risk? → Use larger pivots like Major or Mid Major
💡 Pro Tip: On higher timeframes, pivots perform better and help reduce risk.
✍️ Summary
If you're looking for frequent signals, trade on lower timeframes, and can handle higher volatility and pressure, then smaller pivots like Super Minor and Minor are a better choice.
But if you prefer quality over quantity, work on higher timeframes, and value clarity, peace of mind, and higher success rates, then larger pivots like Mid Major and Major are the way to go.
📣 If you have any questions or need guidance, feel free to ask us. We’d be happy to help.
🔻🔻🔻 Persian Section – بخش فارسی 🔻🔻🔻
🔹 پیوت چیست؟
در استراتژی ایکسمون، هر قله یا درهای که روی چارت شکل میگیرد، یک پیوت محسوب می شود
فاصله زمانی بین دو قله یا دو دره (یعنی تعداد کندلهایی که بینشان قرار دارد) اندازهی پیوت را مشخص میکند
هرچه تعداد کندل بین دو سقف یا کف بیشتر باشد، آن پیوت بزرگتر و معتبرتر است
🔸 انواع پیوت در تنظیمات اندیکاتور ایکسمون
در بخش تنظیمات، میتوانید مشخص کنید که الگوها بر اساس چه نوع پیوتهایی شناسایی شوند
ما ۴ نوع پیوت داریم
• سوپر مینور ← کوچکترین پیوت
• مینور
• میدماژور
• ماژور ← بزرگترین پیوت
⏫ هرچه از سوپرمینور به سمت ماژور برویم، قدرت پیوت بیشتر میشود، ولی تعداد سیگنالها کمتر می شود
⚖️ انتخاب پیوت مناسب = سبک معاملاتی شما
• به دنبال سیگنال زیاد هستید ← پیوت کوچک تر = مینور و سوپرمینور
• به دنبال دقت بیشتر و ریسک کمتر هستید← پیوت بزرگتر = ماژور و میدماژور
💡 نکته حرفهای: در تایمفریمهای بالا، پیوتها عملکرد بهتری دارند و به کنترل ریسک کمک میکنند
✍️ جمعبندی
اگر دنبال سیگنالهای زیاد هستید، در تایمفریمهای کوچکتر کار میکنید و میتونید نوسانات و فشار روانی بالاتر رو تحمل کنید، پیوتهای کوچکتر مثل سوپرمینور و مینور انتخاب مناسبتری هستند
اما اگر در تایم فریم های بزرگتر کار می کنید و کیفیت سیگنال، آرامش ذهنی و احتمال موفقیت برایتان مهمتر است، پیوتهای بزرگتر مثل میدماژور و ماژور انتخاب بهتری هستند
📣 اگر سوالی دارید یا نیاز به راهنمایی دارید، خوشحال میشویم از ما بپرسید
با کمال میل در خدمتتان هستیم
XTIUSD broke the trendline resistance likely will go to 70 XTIUSD has broken the trendline resistance and the price may move to 0.5 fib level of recent swing. let us see.

USOIL REACHED THE 6,900.00 SUPPORT LEVEL. WHAT'S NEXT?USOIL REACHED THE 6,900.00 SUPPORT LEVEL. WHAT'S NEXT?
As we told July 31, the price got reversed towards first support level of 6,900.00. Market participants are waiting for the OPEC+ meeting this week, expecting a significant output hike. Currently, the price sits slightly above the support level. Although, the asset trades above this level, considering the current weakness of the asset, further decline is expected. The 6,800.00 support level is the next target here.
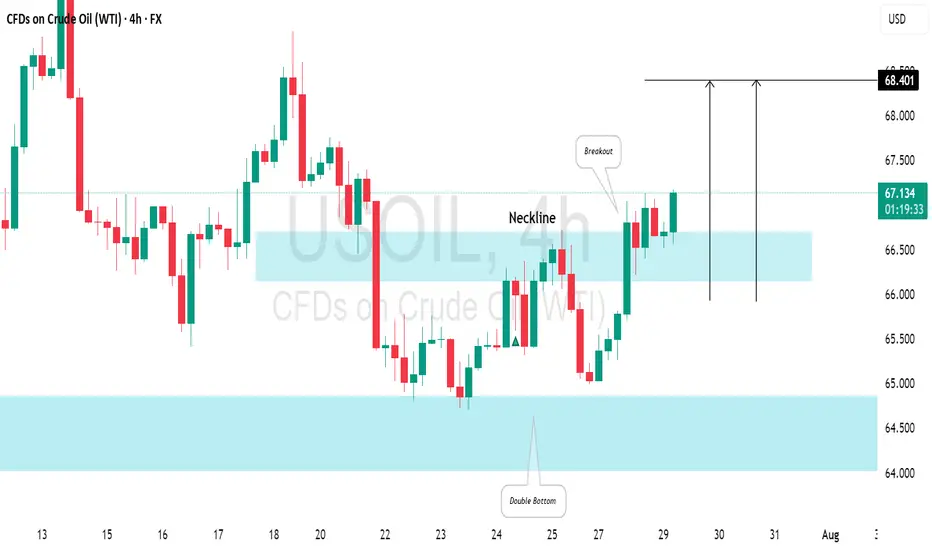
US CRUDE OIL(WTI): Very Bullish Pattern📈USOIL has reached a significant horizontal demand zone on the daily chart, leading to price consolidation and the formation of a double bottom pattern with a higher low.
Yesterday, the market rebounded, creating a new local higher high that broke above the pattern's neckline.
This suggests a typical bullish reversal, and the oil price is expected to rise towards 64.40.
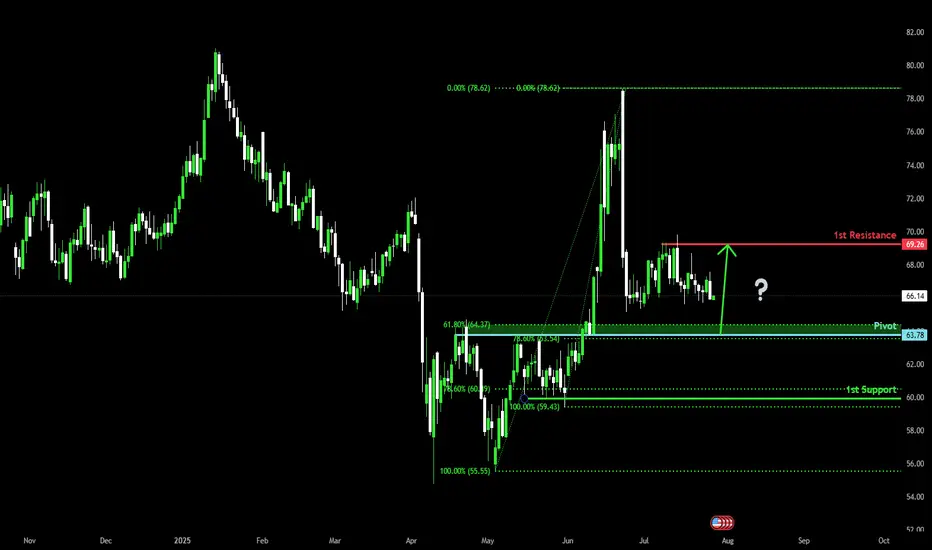
Bullish bounce off pullback support?WTI Oil (XTI/USD) is falling towards the pivot, which has been identified as a pullback support and could bounce to the 1st resistance.
Pivot: 63.78
1st Support: 59.94
1st Resistance: 69.26
Risk Warning:
Trading Forex and CFDs carries a high level of risk to your capital and you should only trade with money you can afford to lose. Trading Forex and CFDs may not be suitable for all investors, so please ensure that you fully understand the risks involved and seek independent advice if necessary.
Disclaimer:
The above opinions given constitute general market commentary, and do not constitute the opinion or advice of IC Markets or any form of personal or investment advice.
Any opinions, news, research, analyses, prices, other information, or links to third-party sites contained on this website are provided on an "as-is" basis, are intended only to be informative, is not an advice nor a recommendation, nor research, or a record of our trading prices, or an offer of, or solicitation for a transaction in any financial instrument and thus should not be treated as such. The information provided does not involve any specific investment objectives, financial situation and needs of any specific person who may receive it. Please be aware, that past performance is not a reliable indicator of future performance and/or results. Past Performance or Forward-looking scenarios based upon the reasonable beliefs of the third-party provider are not a guarantee of future performance. Actual results may differ materially from those anticipated in forward-looking or past performance statements. IC Markets makes no representation or warranty and assumes no liability as to the accuracy or completeness of the information provided, nor any loss arising from any investment based on a recommendation, forecast or any information supplied by any third-party.