USOILBullish senaorio
"BUY Call / Long – Strong upside trend across most timeframes, supported by disrupted supply, elevated oil prices due to real production losses, and renewed geopolitical risk."
SPOTCRUDE trade ideas

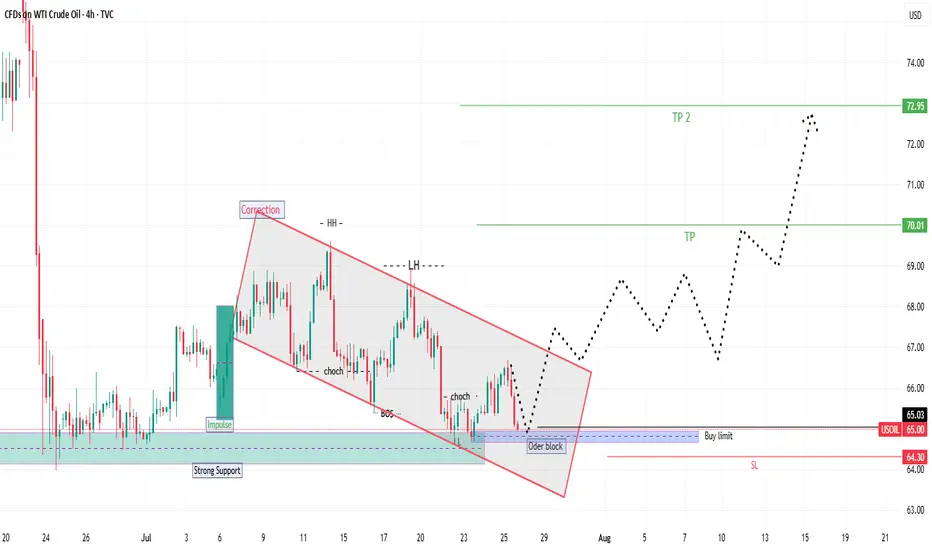
USOIL BUY Smart Money + trend analysis expecting bullish Smart Money + Elliott Wave analysis expecting bullish move after corrective wave (C) completes at demand zone with Order Block, FVG, and liquidity sweep confluence
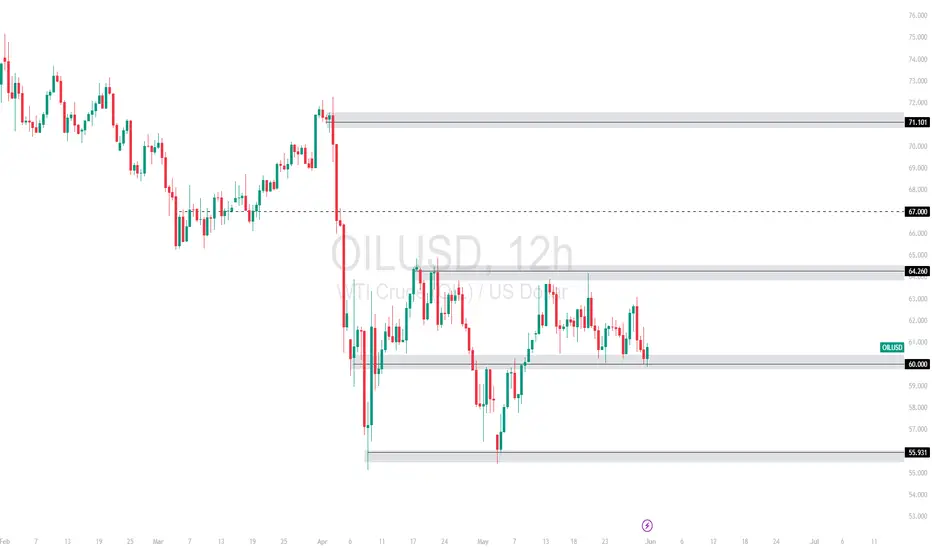
OILUSD Range Between 60–64.26 – Will Support Hold or Break?WTI Crude has been in a sideways range after the sharp drop in early April. Price recently tested resistance at 64.260 but failed to break higher, pulling back into the 60.000 support zone. This level has held multiple times, forming a key pivot.
Support at: 60.000 🔽, 55.931 🔽
Resistance at: 64.260 🔼, 67.000 🔼, 71.101 🔼
🔎 Bias:
🔼 Bullish: A strong rejection from the 60.000 zone followed by a breakout above 64.260.
🔽 Bearish: A daily/12H close below 60.000 opens the path to retest 55.931, and potentially lower.
📛 Disclaimer: This is not financial advice. Trade at your own risk.
USOIL: Next Move Is Up! Long!
My dear friends,
Today we will analyse USOIL together☺️
The market is at an inflection zone and price has now reached an area around 65.029 where previous reversals or breakouts have occurred.And a price reaction that we are seeing on multiple timeframes here could signal the next move up so we can enter on confirmation, and target the next key level of 65.579.Stop-loss is recommended beyond the inflection zone.
❤️Sending you lots of Love and Hugs❤️

USOIL My Opinion! BUY!
My dear friends,
Please, find my technical outlook for USOIL below:
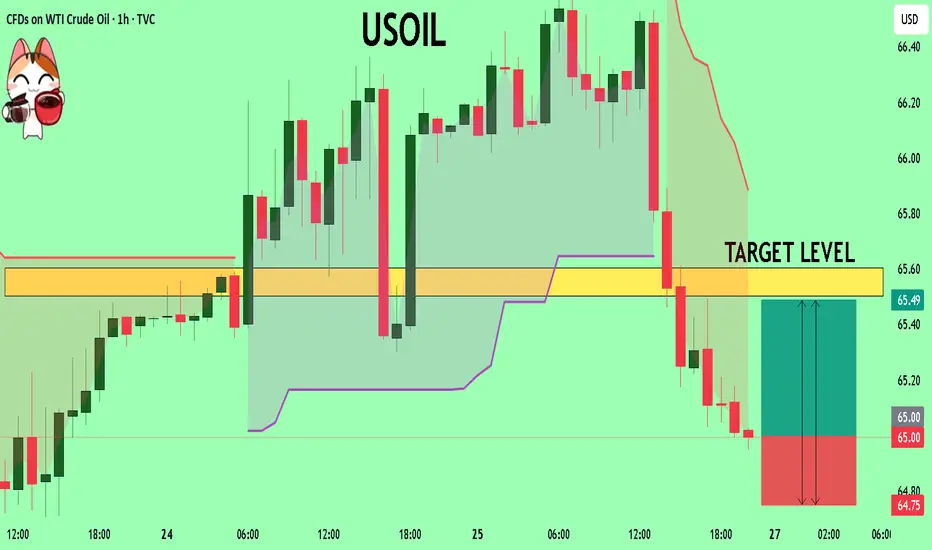
The instrument tests an important psychological level 65.00
Bias - Bullish
Technical Indicators: Supper Trend gives a precise Bullish signal, while Pivot Point HL predicts price changes and potential reversals in the market.
Target - 65.50
Recommended Stop Loss - 64.75
About Used Indicators:
Super-trend indicator is more useful in trending markets where there are clear uptrends and downtrends in price.
Disclosure: I am part of Trade Nation's Influencer program and receive a monthly fee for using their TradingView charts in my analysis.
———————————
WISH YOU ALL LUCK
USOIL--SHORT
--unabled to move up, price will move down
--three horizantal line: starting from top, entry,TP1,TP2

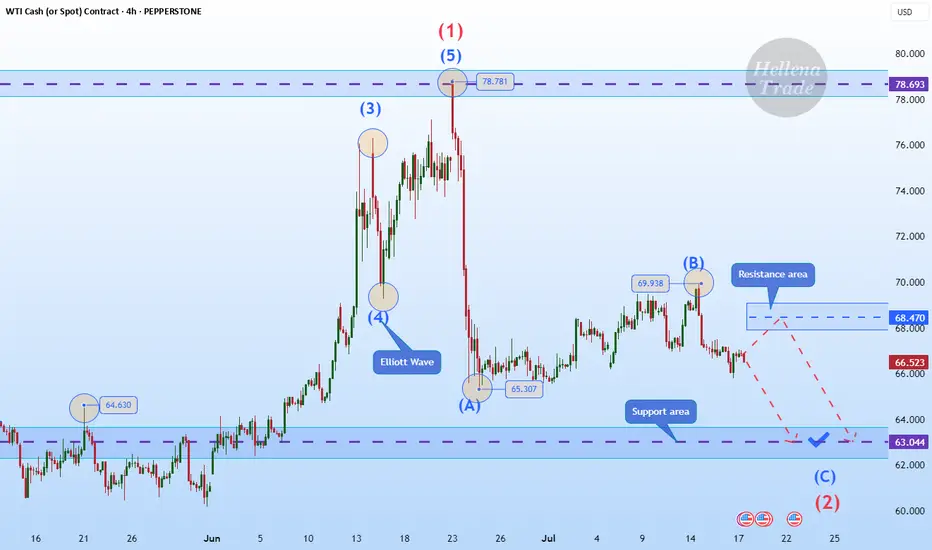
Hellena | Oil (4H): SHORT to support area of 63.000.Colleagues, I believe that wave “B” has formed at the level of 69.938, and now we expect the downward movement to continue with the aim of completing wave ‘C’ of the middle order and wave “2” of the higher order in the support area of 63,000.
It is quite possible that the price could reach the 60,000 level, but I think that for now it is worth focusing on the nearest targets.
Manage your capital correctly and competently! Only enter trades based on reliable patterns!
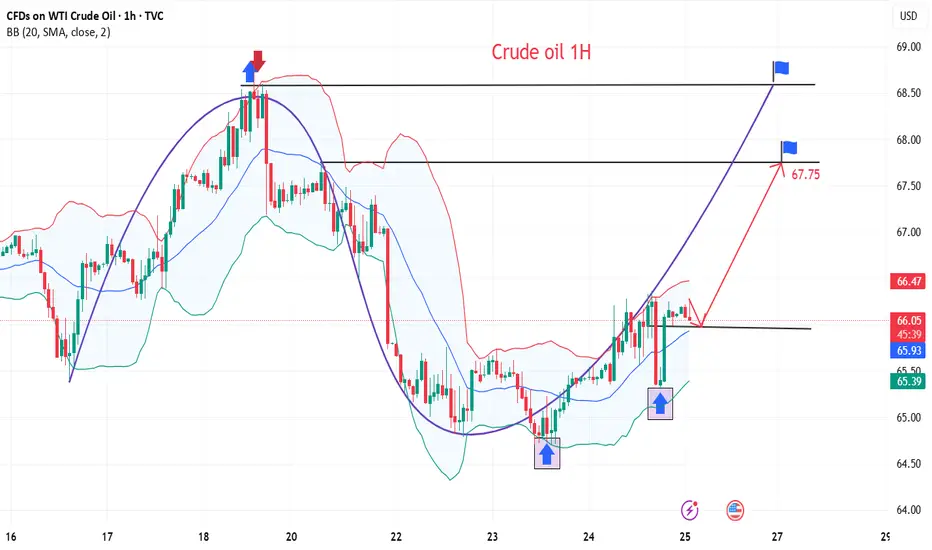
Crude oil trading reminder: triple positive support
💡Message Strategy
After three consecutive days of sluggishness, both U.S. and Brent crude oil remained above the 100-day moving average on Thursday (July 24). U.S. crude oil is currently up 0.4%, trading around 65.46; Brent crude oil is currently up 0.1%, trading around US$68.67 per barrel. The three engines of trade negotiations, unexpected decline in inventories, and geopolitical games are ignited at the same time. Oil prices showed signs of stabilizing, allowing bulls to "smell" the long-awaited rebound opportunity.
1. The trade war breaks the ice: the US, Japan and Europe have reached a series of agreements to ignite market hopes.
2. Inventories plummeted by 3.2 million barrels! The balance of supply and demand suddenly tilted.
3. Geopolitical black swan: The war between Russia and Ukraine burns the energy supply chain
📊Technical aspects
The short-term (4H) trend of crude oil fluctuated upward slightly. The moving average system gradually formed a bullish arrangement, and the short-term objective trend direction was upward. In terms of momentum, the MACD indicator opened upward above the zero axis, and the bullish momentum was sufficient.
In terms of form, the oil price broke through the neckline, and the head and shoulders bottom reversal pattern was established. It is expected that after the intraday crude oil trend retests the neckline position, the probability of forming another upward rhythm is high.
💰Strategy Package
Long Position:65.50-66.50,SL:64.00,Target:67.75-68.00
WTI crude: $65 floor holds again as bulls test 50-day MAAfter nine failures to break and close beneath $65 per barrel over the past month, you have to wonder how much longer bears will persist in attempting to take out the level. Following a nice pop higher on Thursday, completing a morning star pattern and closing above the 50-day moving average, it may be time for WTI bulls to have their day in the sun.
For those eyeing long setups, positions could be initiated above the 50-day moving average with a stop beneath for protection against reversal.
As for potential targets, the contract had little luck breaking cleanly above the 200-day moving average earlier this month, making it screen as a suitable level. It’s found just below $68 per barrel today.
Good luck!
DS
USOIL-LONG--severel times attemted to break the green channel's bottom side and failed
--price seems to go higher and push the upper side of green channel
-

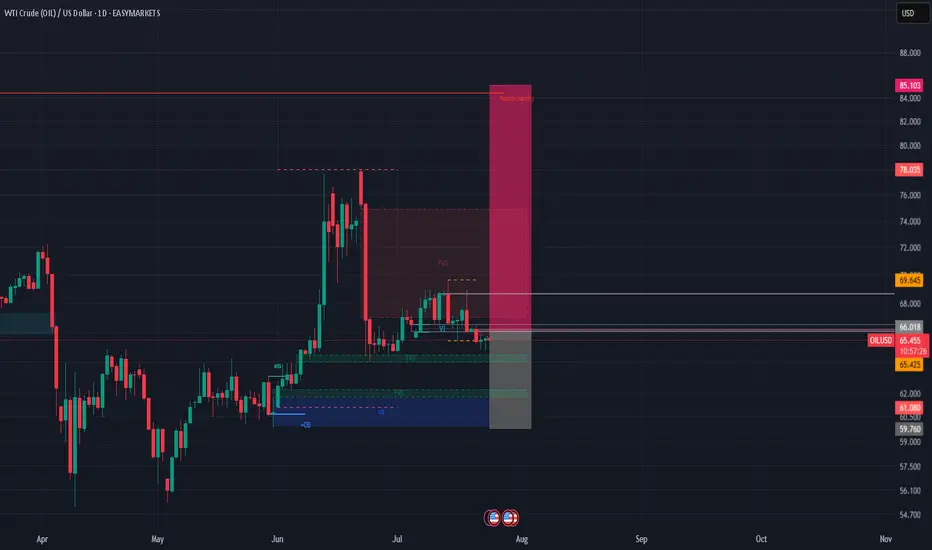
CRUDE OIL (LONG IDEA)🛢️ OILUSD (WTI Crude Oil) – LONG SETUP 🛢️
🚦 Bias: BULLISH (Long)
💰 Entry: Market @$65.408 (or buy dips)
🛑 Stop Loss:$60.00 (HTF protection)
🎯 Take Profits:
• TP1:$69.65
• TP2:$72.00
• TP3:$85.00 🚀 (HTF buy-side liquidity)
🔍 Why This Trade?
✨ Multi-Timeframe Confluence:
📈 Weekly: Bullish structure shift, liquidity sweep
🟩 Daily: Strong bounce from order block + FVG
⏰ 4H: BOS, FVG tap, higher lows = bullish flow
🔥 Fundamentals:
🏦 EIA: Big crude inventory drawdown
🌍 OPEC/IEA: Q3 demand rising
⚡ Geopolitics: Middle East/Red Sea risk premium
💵 Macro: USD weakness = oil tailwind
🧠 Sentiment:
🧑💻 Retail: Still net short
🏦 Managed money: Adding longs
🚀 Fuel for upside!
🛠️ Execution Plan:
💸 Buy now @$65.408 or scale in on dips $64.50–63.50)
🛡️ Stop Loss:$59.780 (HTF structure)
🎯 Targets:
TP1:$69.65
TP2:$72.00
TP3:$85.00 🚀
❌ Invalidation:
Weekly close <$60.00 = exit
⚡ Summary:
All signals GO! 🚦 Multi-timeframe bullish structure, strong demand, and fundamentals + sentiment all align for a high-conviction long. Risk defined at $60.00 for max protection. Targeting major buy-side liquidity at $85.00!
#OILUSD #CrudeOil #Long #SmartMoney #TradeSetup 🚀
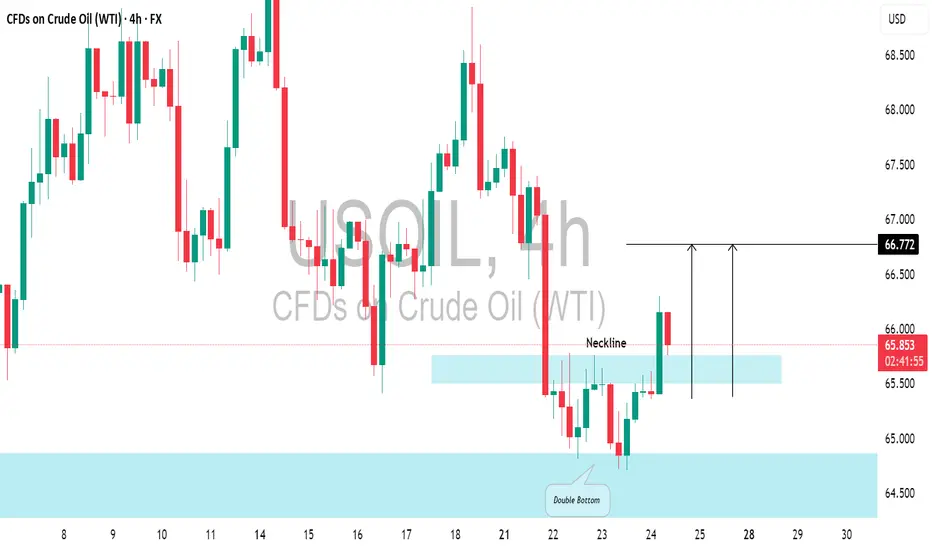
US CRUDE OIL (WTI): Pullback From Support📈USOIL responded well to the highlighted daily support level.
The price formed a double bottom pattern on that and broke above its neckline.
There's a strong likelihood that the price will continue to increase and reach 66.72 shortly.
Crude Oil Short Setup
Entry: 66.40
SL: 67.20
TP: 64.85
Risk to Reward: 1.93
Bias: Bearish
I expect mid-term downside pressure on crude oil prices, mainly due to the following reasons:
The U.S. is mitigating the impact of energy tariffs by increasing domestic supply.
Pressure on OPEC to boost production is rising.
Global demand growth remains uncertain.
These factors may keep energy prices capped in the medium term and support bearish scenarios.

Oil weekly bear flagPresetly: seeing a weekly bear flag spotted on oil
Expecting: next weekly candle to be continuation red candle

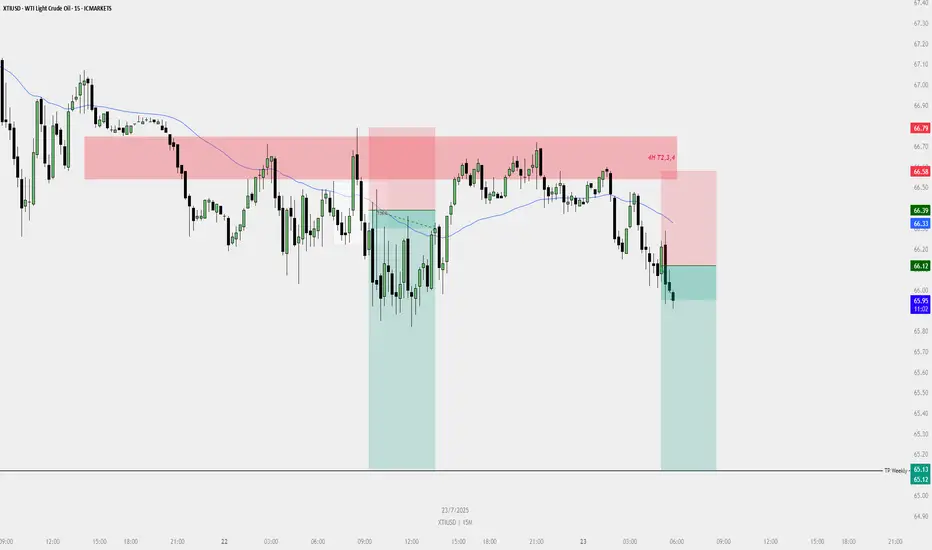
SELL PLAN – XTIUSD (15M)📉 SELL PLAN – XTIUSD (15M)
🗓️ Date: 23 July 2025
⏱️ Timeframe: 15-Minute
🔍 Context & Reasoning:
HTF Supply Zone (Red Zone)
Price entered the red HTF zone (noted as “4H T2,3,4”) and showed rejection.
This zone aligns with potential 4H Fair Value Gaps / Supply.
Sweep & Rejection
Liquidity sweep above previous highs followed by immediate bearish reaction.
Entry Confirmation
Bearish engulfing candle formed inside the HTF zone.
Price closed below 15M EMA (blue line) showing bearish momentum.
Dealing Range Valid
DR formed after rejection of the HTF zone.
Short-term bullish FVG created and violated.
Bearish FVG confirms continuation.
🎯 Entry Details:
Entry Price: ~66.12
Stop Loss: ~66.58 (Above HTF rejection zone)
Take Profit: ~65.12 (Near Weekly TP level)
🧠 Confluences:
Rejection from 4H Supply
Price closed below EMA
Clear swing failure / liquidity grab
DR confirmation on 15M
Multiple FVGs and breaker structure supporting the move
📌 Risk Management:
Risk-to-Reward: 1:2+
Risk per trade: Max 1%
If in drawdown: Use 0.5%
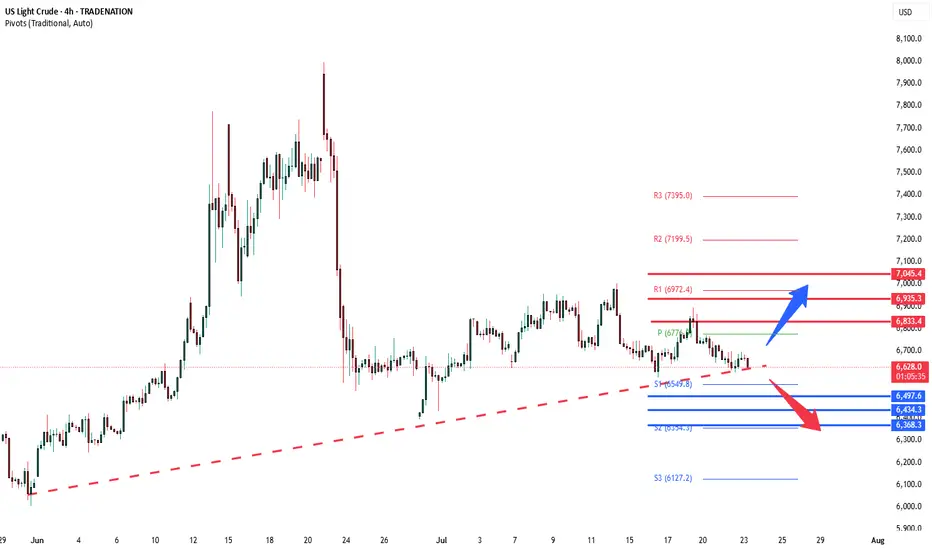
WTI crude consolidation ahead of US Inventory figuresWest Texas Intermediate (WTI) crude futures hovered near $66.30 during Wednesday’s European session, trading in a narrow range as investors awaited the latest US EIA crude inventory report. Market expectations point to a 1.4 million barrel drawdown, which would signal stronger demand and potentially support prices.
However, crude failed to rally despite confirmation of a US-Japan bilateral trade agreement, announced by President Trump via Truth Social. While the deal is seen as a positive for global trade sentiment, broader oil demand concerns persist—especially if US-EU trade negotiations stall, which could dampen growth in major consuming regions.
Conclusion:
Oil markets remain in consolidation mode, with near-term direction likely hinging on EIA inventory results. A larger-than-expected draw could offer upside momentum, but macro-level trade uncertainties continue to cap gains.
Key Support and Resistance Levels
Resistance Level 1: 6830
Resistance Level 2: 6940
Resistance Level 3: 7045
Support Level 1: 6500
Support Level 2: 6435
Support Level 3: 6370
This communication is for informational purposes only and should not be viewed as any form of recommendation as to a particular course of action or as investment advice. It is not intended as an offer or solicitation for the purchase or sale of any financial instrument or as an official confirmation of any transaction. Opinions, estimates and assumptions expressed herein are made as of the date of this communication and are subject to change without notice. This communication has been prepared based upon information, including market prices, data and other information, believed to be reliable; however, Trade Nation does not warrant its completeness or accuracy. All market prices and market data contained in or attached to this communication are indicative and subject to change without notice.
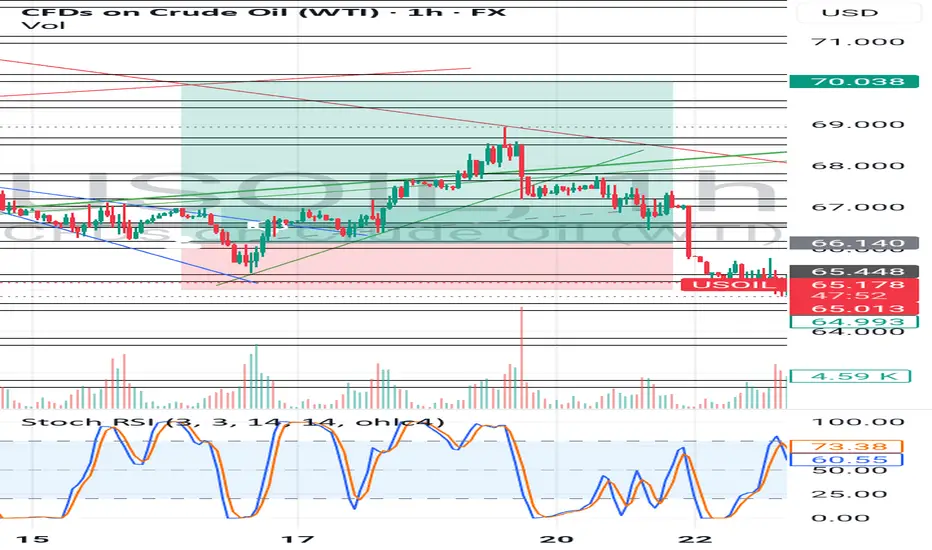
US OIL LONG RESULT Oil price was in a major Ascending Channel side and then created a broadening falling wedge indicating signs to the upside and I executed the short and price moved up as predicted.
Just overextended our TP without taking not of the resistance Trendline and previous supply zone 🤦
Still Closed as a Break Even trade though, but with Bett ler TP estimation could've been a good Trade.
We keep learning and improving together 💪🙏
_THE_KLASSIC_TRADER_.
USOIL POTENTIAL LONG|
✅CRUDE OIL has retested a key support level of 65.00$
And as the pair is already making a bullish rebound
A move up to retest the supply level above at 66.27$ is likely
LONG🚀
✅Like and subscribe to never miss a new idea!✅
Disclosure: I am part of Trade Nation's Influencer program and receive a monthly fee for using their TradingView charts in my analysis.

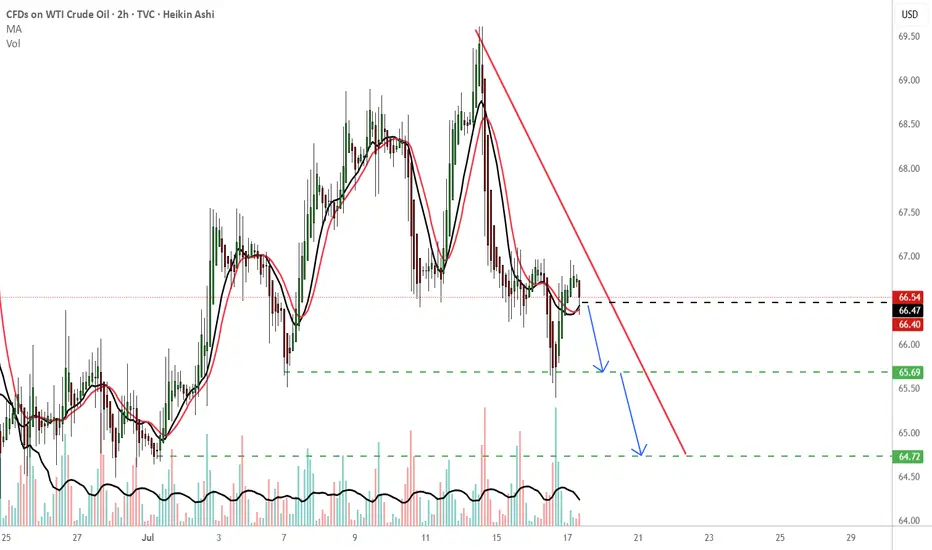
USOILShort short short !!!
-65.69 TP
-64.72 TP2
As long as it's bearish and doesn't close above the red line, assume bearish. The green dotted lines also can suggest demand zones which could suggest a change in direction (bullish soldiers) will enter the battlefield. Trade with focus and follow your trading plan.
THOUGHTS???????
USOIL Long From Support! Buy!
Hello,Traders!
USOIL made a retest of
The horizontal support
Level of 64.86$ from where
We are already seeing a bullish
Reaction so we will be expecting
A further local move up
Buy!
Comment and subscribe to help us grow!
Check out other forecasts below too!
Disclosure: I am part of Trade Nation's Influencer program and receive a monthly fee for using their TradingView charts in my analysis.

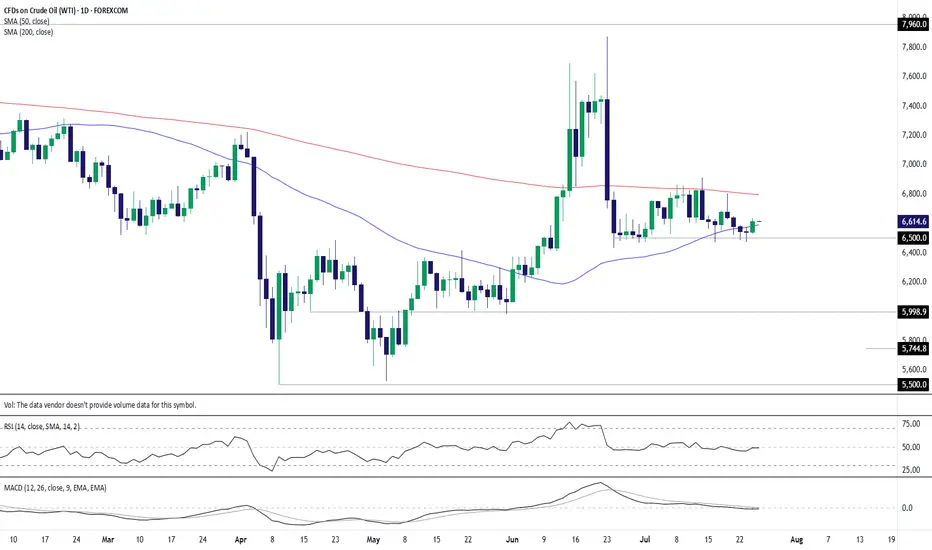
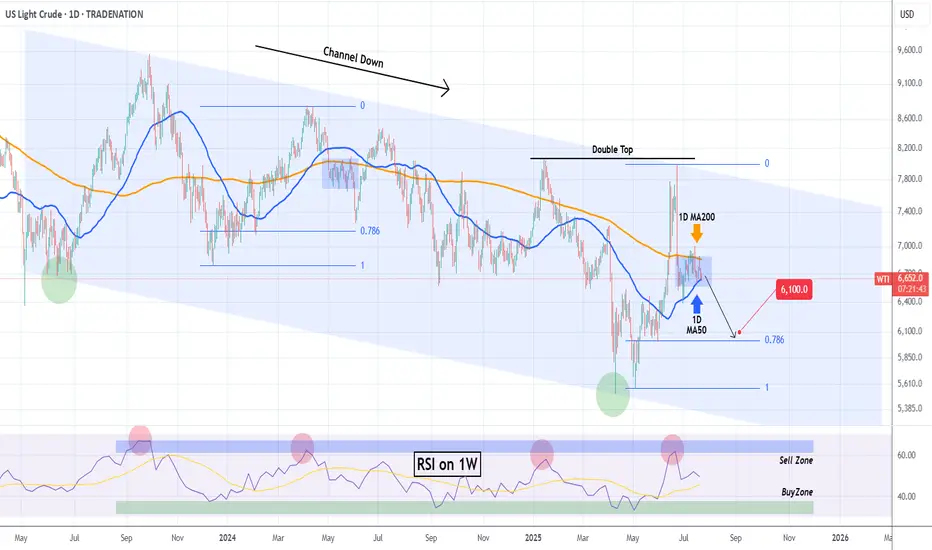
WTI OIL Extreme 1D MA50-200 squeeze to deliver break-out!WTI Oil (USOIL) has been consolidating for almost the past 30 days within the 1D MA50 (blue trend-line) and 1D MA200 (orange trend-line). The squeeze is now so tight that the trend will be revealed soon with a break-out.
Based on the 2-year Channel Down, that should be bearish, resembling the May 2024 consolidation that broke downwards and almost hit the 0.786 Fibonacci retracement level. Notice also the similar Sell Zone rejection on the 1W RSI.
As a result, we expect WTI to decline and target $61.00.
-------------------------------------------------------------------------------
** Please LIKE 👍, FOLLOW ✅, SHARE 🙌 and COMMENT ✍ if you enjoy this idea! Also share your ideas and charts in the comments section below! This is best way to keep it relevant, support us, keep the content here free and allow the idea to reach as many people as possible. **
-------------------------------------------------------------------------------
Disclosure: I am part of Trade Nation's Influencer program and receive a monthly fee for using their TradingView charts in my analysis.
💸💸💸💸💸💸
👇 👇 👇 👇 👇 👇
LONG ON USOIL OIL has just completed a sweep of sell side liquidity, leaving behind lots of BUY side liquidity.
DXY is falling on top of economic news stating trump will possibly fire Jerome Powell.
All this with OPEC increase oil production.
I expect oil to make a $5-$10 move throughout the rest of the week.
That's 500-1000 pips!

OIL - shortOil back to $ 64.68 (conservative target) and possibly to $ 58 area (optimal target).
Stop loss above 67.32.
Trade with care.
