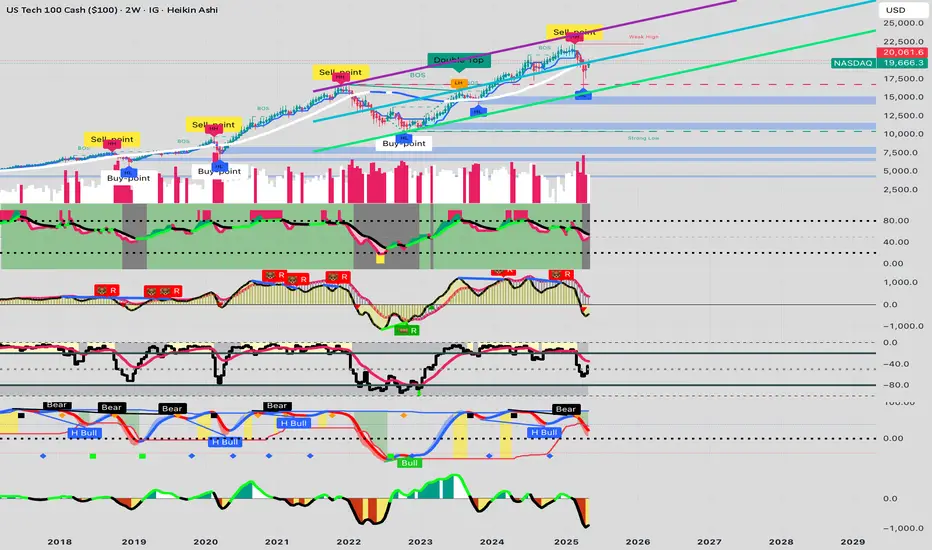
will the technical indicators catch up for the great melt up?!its my first published chart where i look at the broader picture. Weekly+ indicators dont seem to support the popular melt up, although the market is moving up but the TA isnt backing up the rocket rise. Maybe another flush on the way to finalize it!
NDX trade ideas
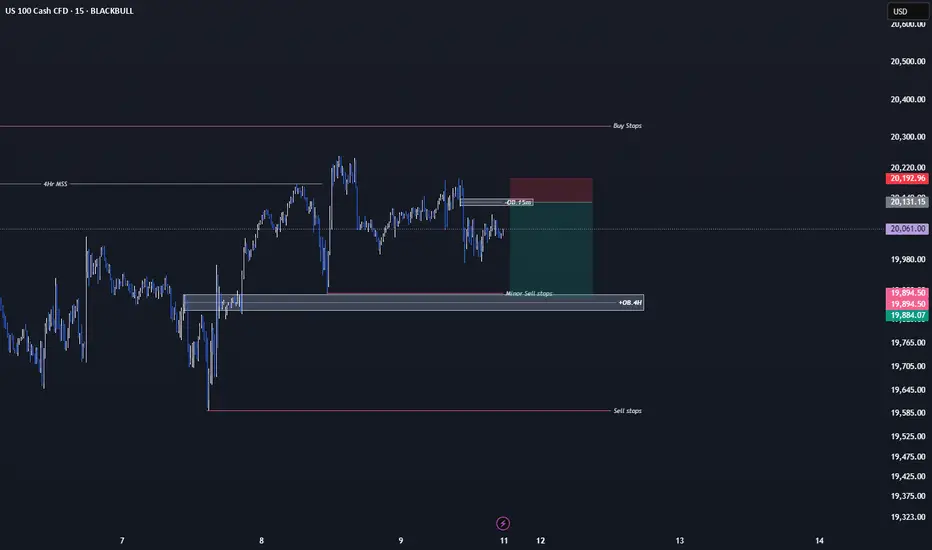
swing entry modellooking into a range gives you access to directions. proper selection of the valid liquidity pull allowing access to opposing liquidity pull. This works in both bullish and bearish cases. This is also known as market structure
Fingers didn't want to work today with typing my apologies

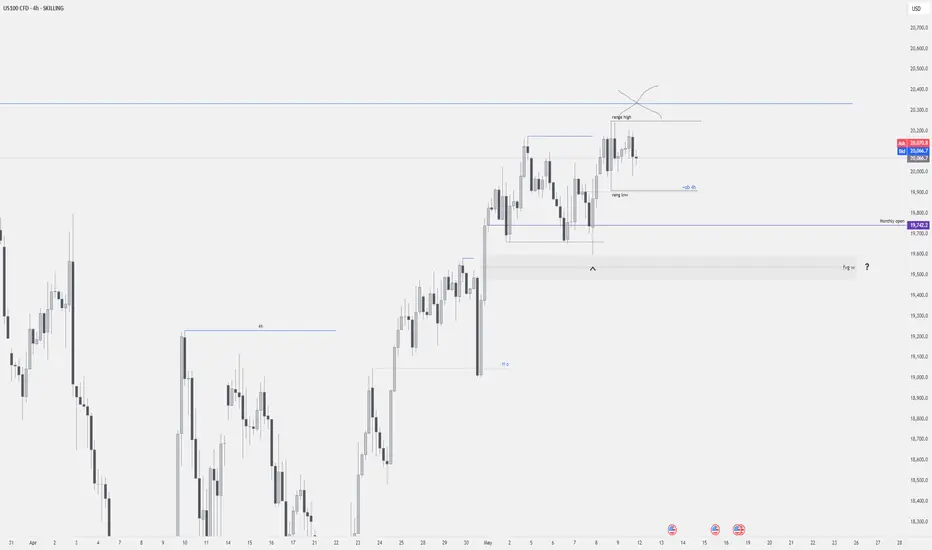
4h Range - 1h raid and m5 PAMy standard model of the flow. Accumulation / Manipulation/ Distribution
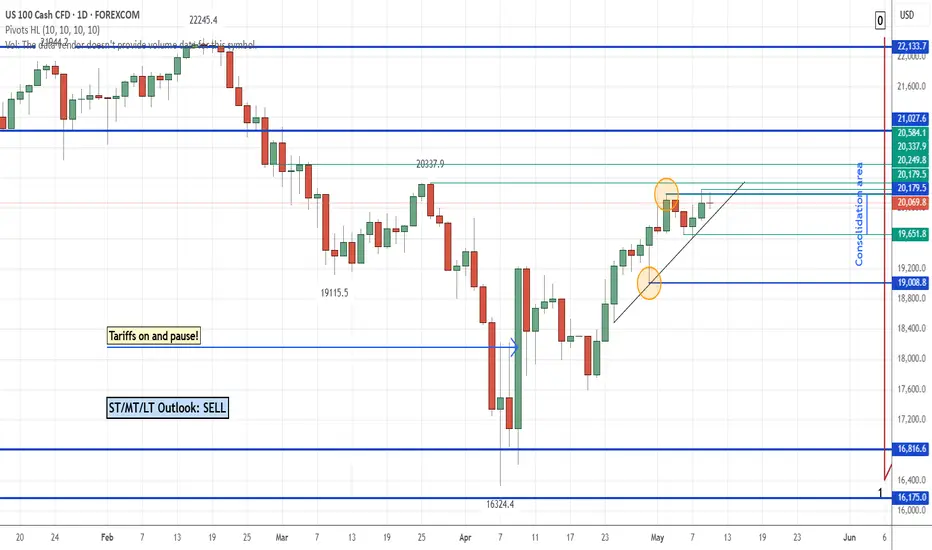
NQ: Upcoming Weekly Analysis!FA Analysis:
1- We have two forces (Trump's team, policy and tweets and the FED) as market movers.
2- Trump's Team: Maintaining the UNCERTAINTY
- Minimum tariffs is 10% which is at least 500% of the original tariffs.
- Have a clear strategy: One screaming very high and the other one, the nice guy, offers 10-25% tariffs
- All the deals won't be binding deals; so they might change at any time. So uncertainty is still there.
- It's all about PR and looking good and winning
- Market understands very well what is happening. Market sees the 10% tariffs as a huge barrier.
=) So all what Trump is doing, including the final/big deals, are bad for stocks and equities.
3- The FED:
- Last FED did not provide any hint about June rate cut. FED is data related.
- Last macro-economic data did not help the FED Rate cut. Hence, the upcoming data is very relevant.
- This week, we have key inflation data: CPI and PPI. Higher Inflation data means NO June Cut which is very bad for stocks and equities. Inline and lower inflation data will help FED Cut which is good for stocks and equities.
=) From now on, Good macro-economic data is bad for stocks and equities and vice-versa.
TA Analysis:
Weekly TF:
- From weekly perspective, we got a bullish weekly candle than closed inside a bullish candle.
- Price seems exhausted and toppish. There is no need to go further up. But in any case, the chart shows two higher levels that price might reach in the case of bad economic data.
Daily TF:
- Friday candle was unable to close above the latest HH.
- Price always closed inside the consolidation area.
- Price will test the previous swing low (highlighted by a circle) in case Monday or US-China talks does not close above the latest HH.
=) From weekly and daily TF, NQ should go south.
Wish you a green week Everyone! GL!
(Note: I won't be around this week beside quick in and out; So I won't post most likely)
REPEATING 2022 PATTERN?We humans love to see patterns so we can try to understand our own existence and our perception of almost everything.
Very interesting comparison between 2022 and 2025. Though market conditions seem different we can see clearly the failed attempt to break above de 200 SMA in 2022. It may repeat again.

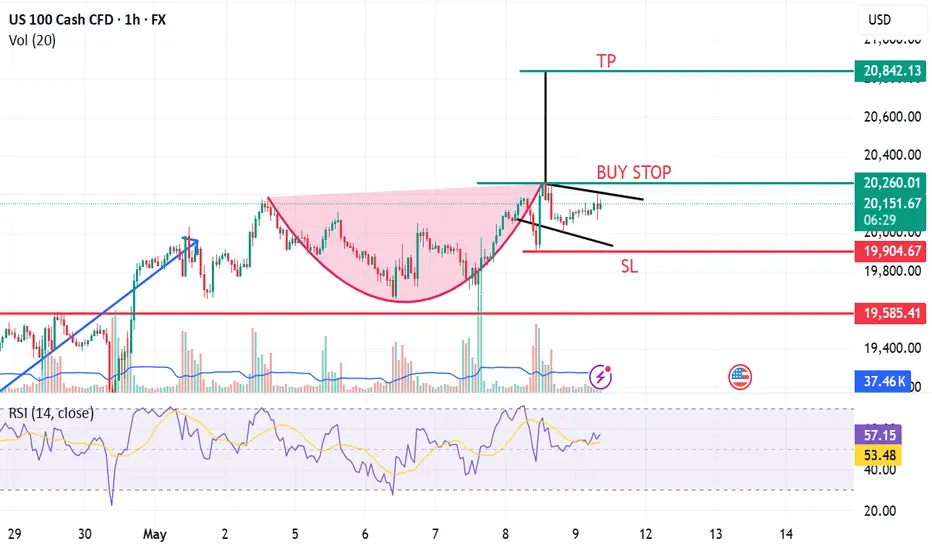
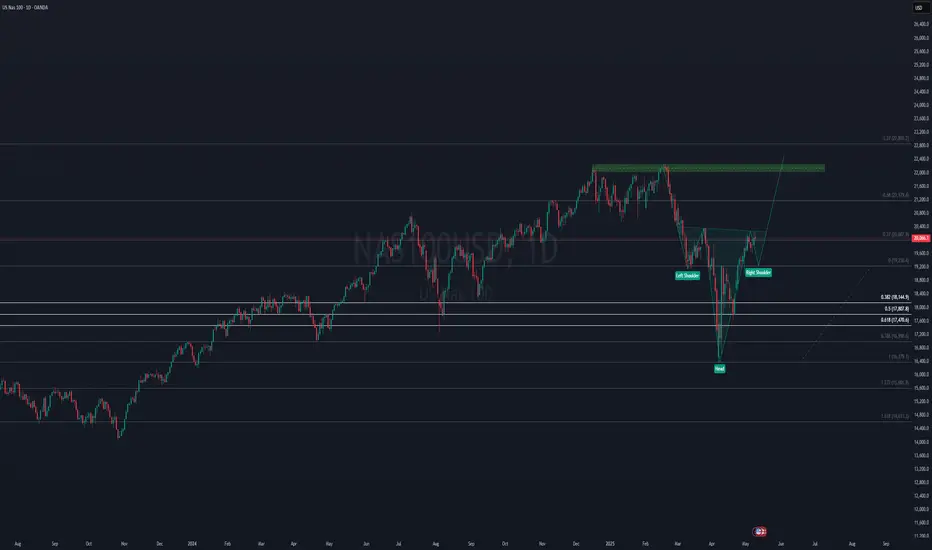
NASDAQ 100 on dayly This NASDAQ 100 chart shows an inverted Head and Shoulders pattern. The "head" is near 18,800, with the "left shoulder" and "right shoulder" around 19,200-19,400. The neckline is at approximately 19,800, and the price has broken above it, indicating a bullish reversal. The measured target is around 22,800, based on the pattern's height projected upward.
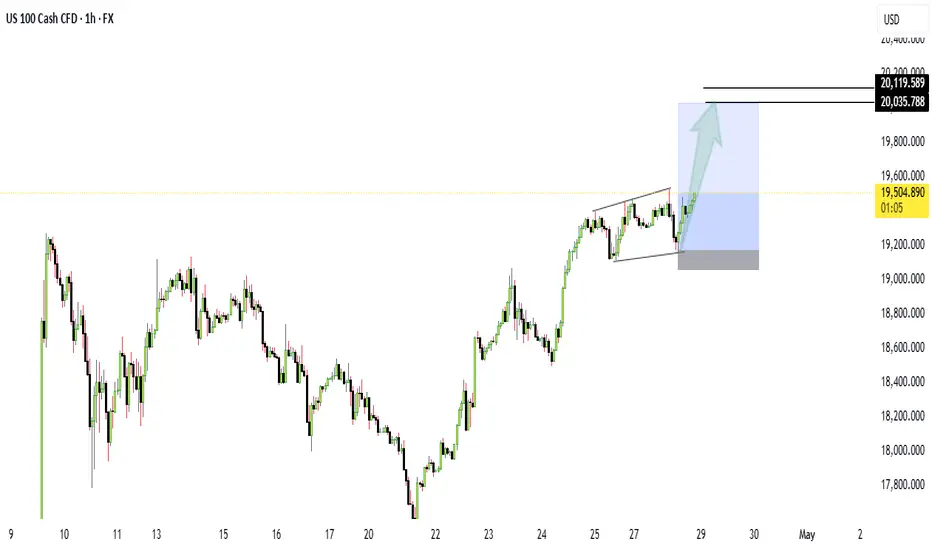
nas100 next move? 📈 NAS100 Market Update
NAS100 is currently trading around 19,500 and is forming a running flat wave pattern.
This structure is setting up for a potential move towards the 20,000 target.
Stay alert — the breakout could be strong!
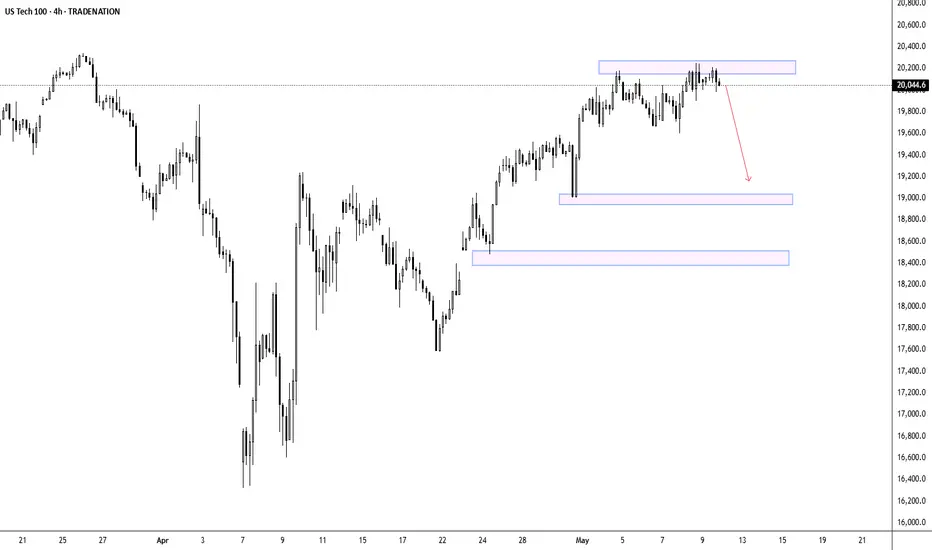
US100 - Correction Required Before Next Major Rally PhaseThe US Tech 100 index is showing signs of exhaustion after a strong recovery rally from April lows, with price action now facing resistance at the upper blue box around 20,200. The index appears to be forming a short-term top as momentum wanes, evidenced by recent candle patterns displaying indecision and inability to sustain new highs. The downward-pointing red arrow suggests a likely move toward the middle support zone around 19,000, which would represent a healthy correction of about 5-6% from current levels. This pullback would help reset overbought technical indicators and potentially shake out weak hands before establishing a stronger foundation for the next leg higher. Given the sharp rally we've witnessed from the April lows near 16,400, this correction would be technically justified and provide a more sustainable launching pad for continuation of the longer-term uptrend once complete.
Disclosure: I am part of Trade Nation's Influencer program and receive a monthly fee for using their TradingView charts in my analysis.
US NAS100Preferably suitable for scalping and accurate as long as you watch carefully the price action with the drawn areas.
With your likes and comments, you give me enough energy to provide the best analysis on an ongoing basis.
And if you needed any analysis that was not on the page, you can ask me with a comment or a personal message.
Enjoy Trading ;)
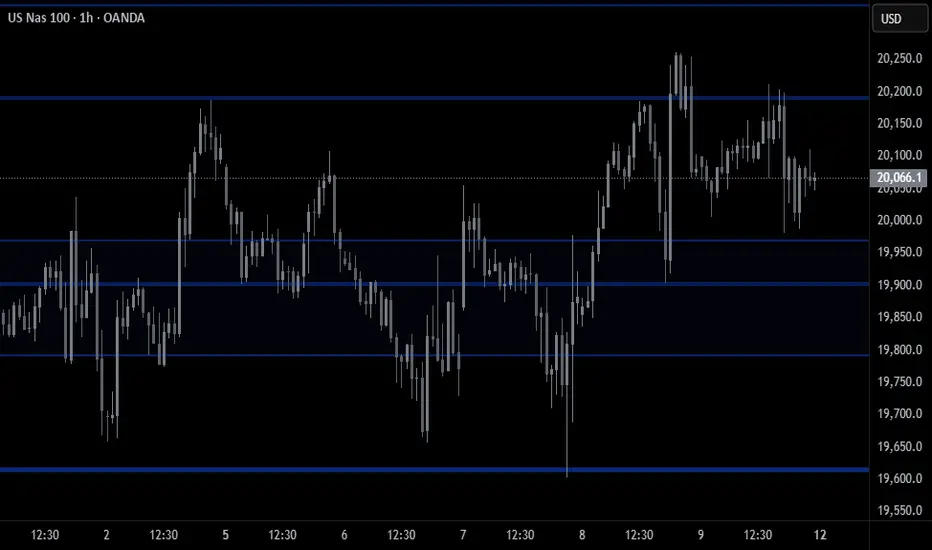
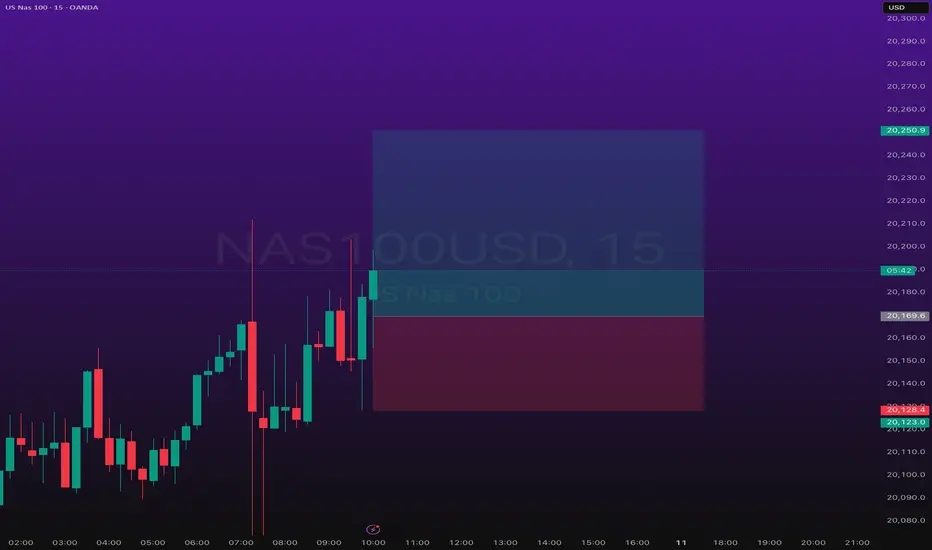
The RangeThe area at which Nas100 is ranging is a very manipulative area whereby there is a high possibility that continuation of buys might occur, induction of sellers by sweeping lows within a premium area might cause us trouble

US100 BEARS ARE STRONG HERE|SHORT
US100 SIGNAL
Trade Direction: short
Entry Level: 20,075.8
Target Level: 19,221.3
Stop Loss: 20,643.2
RISK PROFILE
Risk level: medium
Suggested risk: 1%
Timeframe: 9h
Disclosure: I am part of Trade Nation's Influencer program and receive a monthly fee for using their TradingView charts in my analysis.
✅LIKE AND COMMENT MY IDEAS✅

US100 continues its bullish TrendUS100 continues its bullish Trend. Fundamental & sentiments after FOMC meeting appears to be favorable for equity markets.


X2: NQ/US100/NAS100 Long - Day Trades 1:2X2:
Risking 1% to make 2%
NAS100, US100, NQ, NASDAQ Long for day trade, with my back testing of this strategy, it hits multiple possible take profits, manage your position accordingly.
Risking 1% to make 2%
Use proper risk management
Looks like good trade.
Lets monitor.
Use proper risk management.
Disclaimer: only idea, not advice