SPX 25 Apr 2025Is US stocks really crashing? Everyone is saying so.....
Using wave analysis, it still lack the 5th wave, so do not be surprise if another new high come
SPX trade ideas

Is This a Massive AB=CD? I first joined this site under the "HoleyProfit" username in 2021 to give my warnings of potential bear markets. Obvious bear setups forming in the meme mania and I also though this would extend into the indices given a bit of time.
I was a bit early on the indices but over the following months all the tops were made and the drops came to pass.
Late 2022 I began to pivot back to bull when there was signs of bear trend failure and by early 2023 I was fully in the bull camp.
At the time I started to talk about a blow off top move. One which was exactly similar in size and style as the 2021 rally but the angle of the rally for a bit sharper.
This would have predicted a parabolic run to somewhere around 6000 - which has since come to pass.
Read the original post below.
If my thesis that we were heading into a giant D leg was correct, then that would mean we have a top made.
And we'd enter into super ugly market conditions over the coming months.

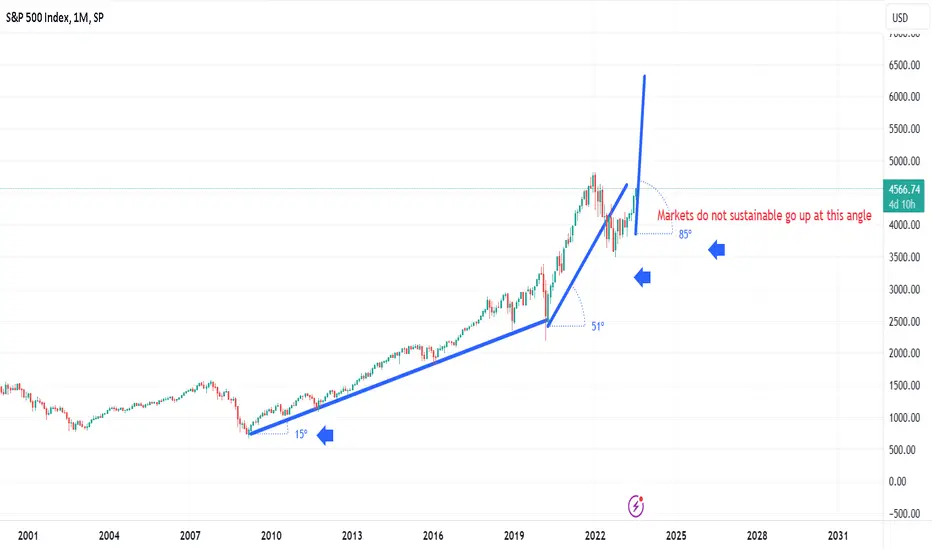
Unsustainable Market Trends I'm overall a bear but I think we'll probably make a new high. I've explained previously how a new high does not annul the bear thesis since there are various spike out patterns. Let's now talk about the unsustainable nature of what we're currently seeing.
First things first - trendlines going up at angles of over 70 degrees is not good! 35 - 45 degrees, good. That's quite sustainable. It can keep doing that. 70+, not good. It can not keep doing that.
I hate to speak in absolutes, but we can be fairly sure markets can not rise at this angle indefinitely without something really bad happening. Were this to happen, it would have to be a result of devaluation of the currency and although stock markets would be higher, everyone would be hurting. Especially average people.
A highly optimistic forecast of how this can end well would be after making gains markets go into a prolonged period of contraction. There's no more straight up price action but there's also nothing terrible to the downside. I can't really think of any examples of this ever happening. I guess the closest would be the big range before the 80s/90s breakout (But that was not like this into the high).
The most common outcome of markets going up at angles of over 70 degrees is they come down at angles of over 70 degrees!
I feel the moves of 2021 and 2023 have made the market exceptionally more risky. Markets looked extended in 2018 - 2019, but what felt like mania in 2018 was dwarfed in the following years with full years of rallies at angles above what is sustainable. It'd be highly uncommon for these moves to resolve without spiking out the low of where they started.
The tendency of parabolic moves to resolve themselves by trading under where the move started becomes increasingly worrying as we move further from that level. It's around 2,200 in SPX. Even if it came from the current high this would forecast a move worse than 2008. Were it to come from a bit higher, this would start to forecast a move on the scale of depression crashes (At least 80% and lasting at least 10 yrs without a new high).
What I am trying to say here is, if markets keep going up at angles of over 70 (And SPX really isn't far off 100 right now), something very bad is likely to happen. And it's looking likely SPX may do this. Markets may break and make a blow-off without further major retracements and this style of blow-off can be 20 - 25% above the last high.
This would give us estimates for a blow-off ending 6,000 area in SPX and just under 20,000 area in Nasdaq. Both of these would be drawing down at least 70% to break the low of where the excessive angle of buying started. While this is nothing earthshattering in terms of charting norms (What goes up comes down), this would be significant in the real world.
If this big spike out is coming, I think we're seeing the grand final act of the bull market. It will be the best it has ever been and it will be the best we're going to see it in a significant amount of time.
If markets continue higher at the same or steeper angles than the recent climbs (Especially if there's no big pullbacks) I think we'll have seen every single major warning signal there was at the top of rallies that would turn into multiple decade bears.
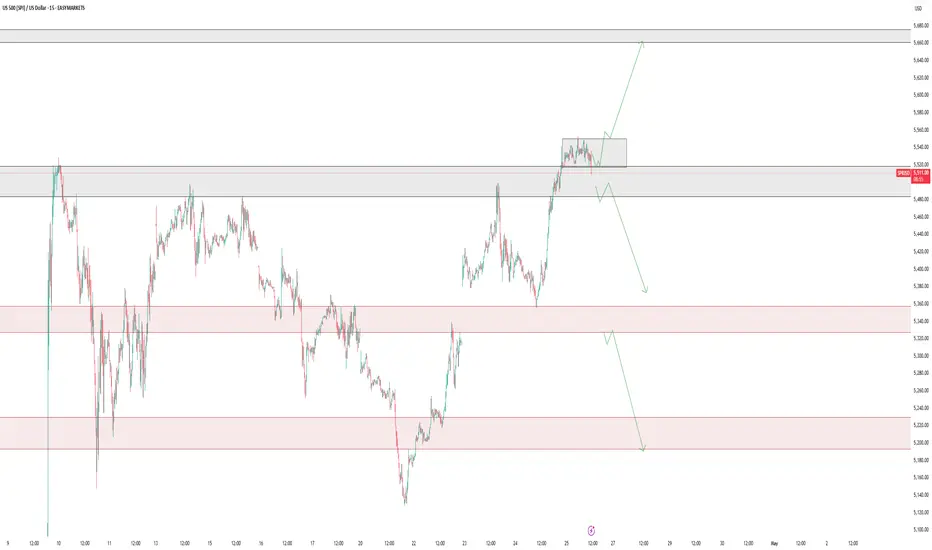
S&P 500 Intra-day Analysis 25-Apr 2025The markets currently are showing some relief after China's decision to exempt certain U.S. goods from tariffs.
Potential scenarios for intra-day moves:
• Price recently touched the lower end of the range around $5,520 and then moved up. If this upward move continues, it could test the top of the range near $5,550. If that level is passed, the next area to keep an eye on might be around $5,660.
• If the price drops below $5,500, it could mean sellers are gaining strength, and the next level to watch could be around $5,360.
• If the price also goes below $5,320, then the $5,200 level might become the next important zone to monitor.
Disclaimer: easyMarkets Account on TradingView allows you to combine easyMarkets industry leading conditions, regulated trading and tight fixed spreads with TradingView's powerful social network for traders, advanced charting and analytics. Access no slippage on limit orders, tight fixed spreads, negative balance protection, no hidden fees or commission, and seamless integration.
Any opinions, news, research, analyses, prices, other information, or links to third-party sites contained on this website are provided on an "as-is" basis, are intended only to be informative, is not an advice nor a recommendation, nor research, or a record of our trading prices, or an offer of, or solicitation for a transaction in any financial instrument and thus should not be treated as such. The information provided does not involve any specific investment objectives, financial situation and needs of any specific person who may receive it. Please be aware, that past performance is not a reliable indicator of future performance and/or results. Past Performance or Forward-looking scenarios based upon the reasonable beliefs of the third-party provider are not a guarantee of future performance. Actual results may differ materially from those anticipated in forward-looking or past performance statements. easyMarkets makes no representation or warranty and assumes no liability as to the accuracy or completeness of the information provided, nor any loss arising from any investment based on a recommendation, forecast or any information supplied by any third-party.
The Bear Is Dead. Long Live the Bull.From Fakeout to Full Send - SPX Flips Bullish
You could almost hear the financial media pop champagne today.
“Markets Surge Amid Easing Trade Tensions” they yelled.
“Global confidence returns!” they assured.
And sure, that’s a cute story.
But for us, Wednesday’s bear push now looks like a feint. A setup. A spring.
By Friday, the bull had not only taken the ball - it ran with it.
That V-shaped reversal pattern on the daily chart? It’s live. And it’s loud.
Technically, it’s now pointing to a projected upside of 6106.
That’s not just some random number. That’s the prior range high zone coming back into focus.
And in case you needed a reminder…
The bear is dead. Long live the bull. (until it isn't)
---
SPX Market View - Bullish Flip Confirmed
Wednesday gave us a classic tease.
Bearish energy. A flicker of downside. But it fizzled fast.
Then came Thursday - and with it, a clean sweep into Friday.
The V-shaped daily reversal triggered.
Price pushes off the lows
Sentiment flipped
And a new upside target emerged at 6106
It’s not just technical fluff. This level marks a structural return to the previous range highs - a natural magnet for bullish continuation.
Meanwhile, I’ve done a bit of chart housekeeping myself.
After two months of letting bias sneak in and lines and notes multiply like rabbits, I’ve hit the reset button.
🧹 Clean charts. Clean mind. Just the essentials.
The direction has changed - and I’m treating it with fresh eyes.
One line I am keeping?
5400. It’s been the pivot point for weeks. A battle-tested zone. It now serves as the bull’s first major checkpoint.
If price respects that level on any dip, it’s game on.
And if we breach it? That’s when the doubt returns.
---
💡Expert Insights: Common Trading Mistakes & How to Avoid Them
MISTAKE: Letting cluttered charts and old bias cloud current decisions.
FIX:
Regularly clean your charts — strip them down to what matters.
Use setups that speak for themselves (like the V-shape).
Don’t bring yesterday’s opinion into today’s trade.
A new direction demands a new perspective. And as price shifts, so must your lens.
---
🗞️Rumour Has It…
BREAKING:
Powell Declares Bull Market, Blames Moon Phase for Midweek Bear Tease
Financial news outlets were caught scrambling when the SPX reversed higher through thursday despite Wednesday’s doom-and-gloom.
“Clearly the moon was in retrograde,” Powell reportedly muttered, while clutching a Fibonacci ruler.
In other news, China's trade delegation released a statement saying, “We’re not sure what’s happening either.”
(This section is entirely made-up satire. Probably.)
---
🤯Fun Fact - The Original “Clean Chart” Addict Was… Jesse Livermore
Before indicators, algos, and triple-screen madness, Jesse Livermore – the OG speculator – was famous for trading from price and price alone.
In fact, he refused to use charts with clutter.
He would manually draw his price levels, log his trades by hand, and sometimes go days without placing a trade – waiting for the market to tip its hand.
His trading edge?
Patience.
Price action.
And a clean, unobstructed read.
One of his favourite tricks?
He’d mentally mark key inflection levels (like your 5400) and wait until price either exploded past or rejected hard before acting.
So next time you reset your chart – you’re not just decluttering…
You’re channelling Livermore.

S&P 500: The Indicator to Watch Right NowWith US stocks bouncing on Trump’s backtracking over tariffs — just weeks after a 20% correction — it’s fair to say caution is the name of the game. Even though the headline risk has eased slightly, markets are still navigating through a fog of geopolitical noise and economic uncertainty.
In moments like these, where the fundamental picture feels muddy at best, objective technical analysis can offer clarity — not crystal-ball predictions, but structure and focus.
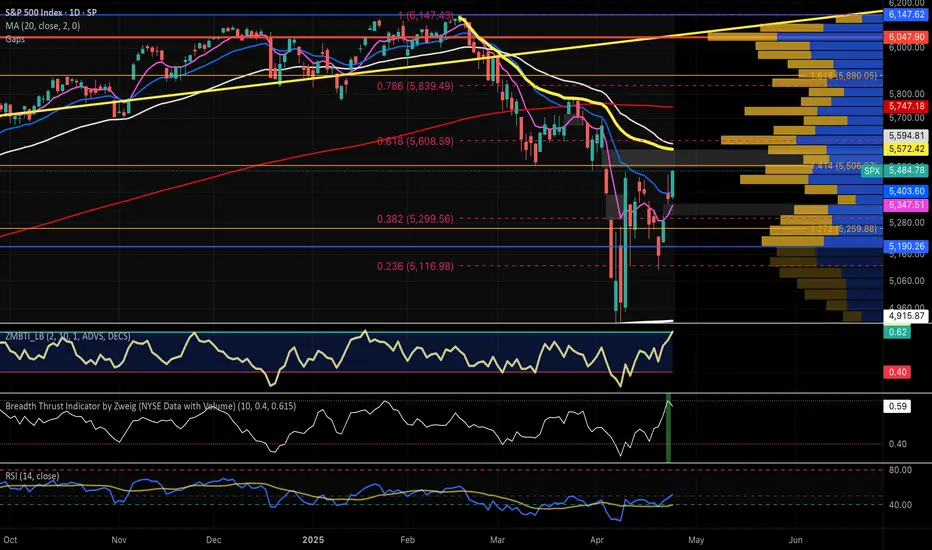
The Traditional Technical Backdrop
Traditional technical analysis isn’t about magic lines on a chart — it’s about mapping out price behaviour with tools that help us stay grounded. Structural levels, trendlines, and a couple of moving averages might seem basic, but they’ve stood the test of time because they do something incredibly useful: they make sense of chaos.
In the case of the S&P 500, several key structural levels should anchor any serious analysis. We’ve got the pre-sell-off highs from February, the April lows, and two interim levels — broken support levels that flipped to resistance during retracement rallies between February and April. These levels now act like milestones in the market’s memory.
Drawing a downward-sloping trendline through the swing highs during the correction gives us a good sense of the broader downtrend. More recently, we’ve also started to see a modest uptrend emerge from the April lows. That creates something of a wedge formation — a narrowing range that’s coiling tighter as buyers and sellers battle it out.
Simple moving averages like the 50-day and 200-day are useful additions here. While they’re lagging by nature, they give us immediate context for where price sits in relation to recent momentum and long-term sentiment.
US500 Daily Candle Chart
Past performance is not a reliable indicator of future results
The Indicator to Watch
There’s a good argument to be made that the most important indicator to watch right now, with the S&P 500 trying to claw back ground, isn’t a moving average or RSI — it’s Anchored VWAP.
Anchored Volume-Weighted Average Price (VWAP) is one of the most effective ways to cut through the noise and see who’s really in control — buyers or sellers. It tells you the average price that traders have paid for the index, weighted by volume, since a specific event or turning point. And unlike regular VWAP that resets daily, Anchored VWAP lets us choose a significant date and track how price interacts with that “anchor.”
If we anchor the VWAP to the February highs, we’re essentially tracking how the market has performed relative to that peak. This anchored VWAP line becomes a kind of gravity — it reflects the average cost basis of those who bought just before the sell-off. If price remains below it, it tells us those buyers are still underwater, and therefore less likely to add risk. Sellers, in that case, still hold the advantage.
On the flip side, if we anchor VWAP to the April lows, we get the average cost basis of the recent bounce. This line reflects where more optimistic, bottom-fishing buyers stepped in. If price holds above this level, it suggests those participants remain in profit — and potentially willing to buy dips.
Right now, the S&P 500 is stuck in a battle between these two anchored VWAP levels. One tracks the pain, the other tracks the hope. It’s a VWAP funnel, and it won’t last forever. Eventually, price will break above one and leave the other behind — and when it does, we’ll have an objective answer as to which side is winning.
Will it be the late bears holding on from February’s highs, or the early bulls from the April lows? The answer is coming. Keep your eyes on the anchored VWAPs — they’re telling the real story.
US500 Daily Candle Chart
Past performance is not a reliable indicator of future results
Disclaimer: This is for information and learning purposes only. The information provided does not constitute investment advice nor take into account the individual financial circumstances or objectives of any investor. Any information that may be provided relating to past performance is not a reliable indicator of future results or performance. Social media channels are not relevant for UK residents.
Spread bets and CFDs are complex instruments and come with a high risk of losing money rapidly due to leverage. 83% of retail investor accounts lose money when trading spread bets and CFDs with this provider. You should consider whether you understand how spread bets and CFDs work and whether you can afford to take the high risk of losing your money.

Another AB=CD formation for the S&P 500?Following a low of 4,835 on 7 April – which touched gloves with an ‘alternate’ AB=CD support (1.272% Fibonacci projection ratio) at 4,983 – the S&P 500 index is on course to pencil in an ‘equal’ AB=CD resistance (100% projection ratio) at 5,746. Notably, the 5,746 level is accommodated by a 1.618% Fibonacci projection ratio at 5,718, as well as a nearby 61.8% Fibonacci retracement ratio at 5,652.
Also of technical relevance, the market index has completed the dreaded ‘Death Cross’, which is the 50-day SMA at 5,645 crossing below the 200-day SMA at 5,746 (converges with the above-noted resistance zone), and suggests that a longer-term downtrend could be on the cards.

S&P500 Index End of Day Trend AnalysisS&P 500 Index Outlook:
The index may experience bearish momentum starting around April 25th or 28th, with key support at 5160. If this level holds and bearish confirmation does not emerge, the bullish trend is expected to continue toward the target of 6109.
Traders should wait for a confirmed short signal before considering bearish positions. Otherwise, the ongoing bullish momentum is likely to persist. The MastersCycle indicator has signaled a buy, with a suggested stop-loss at 5100.
Disclaimer: This is a personal market view. Traders are encouraged to rely on their own technical analysis and always trade with an appropriate stop-loss.

SPX with 2 Zweig breadth thrust indicatorsMost argue that Zweig breadth thrust was triggered on 4/24. 2 indicators for interested people to check it out.
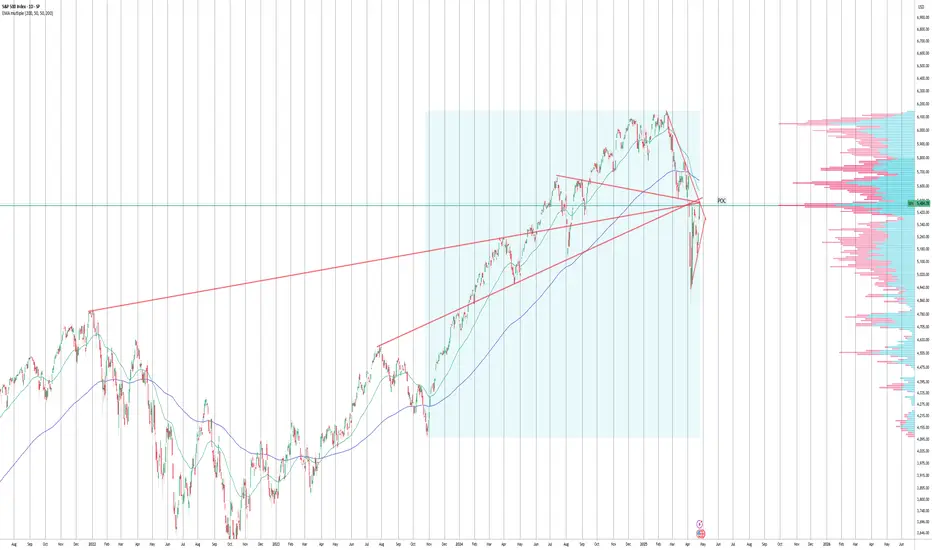
SPX on threshold of bullish breakout? I am cautiously bullishNations may be lining up to kiss Trump's a??? but SPX has come to kiss a confluence of trendline resistance as well as POC
Also markets we approaching month end. You only need to look at the past month ends and see what happens to the price, yes they tend to reverse very often if not always, specially if the prices are below 200 ema as it is now.
I would be watching how the market behaves next week. Soft economic data are pointing to weaker economy and the underlying problem of highly leveraged Hedge Funds remain. I wonder if they begin to deleverage some more at this level.
Any future decline would be a good entry point
US500 LIVEHello friends
Given the price rise and correction we had, we can open a position with capital and risk management.
*Trade safely with us*

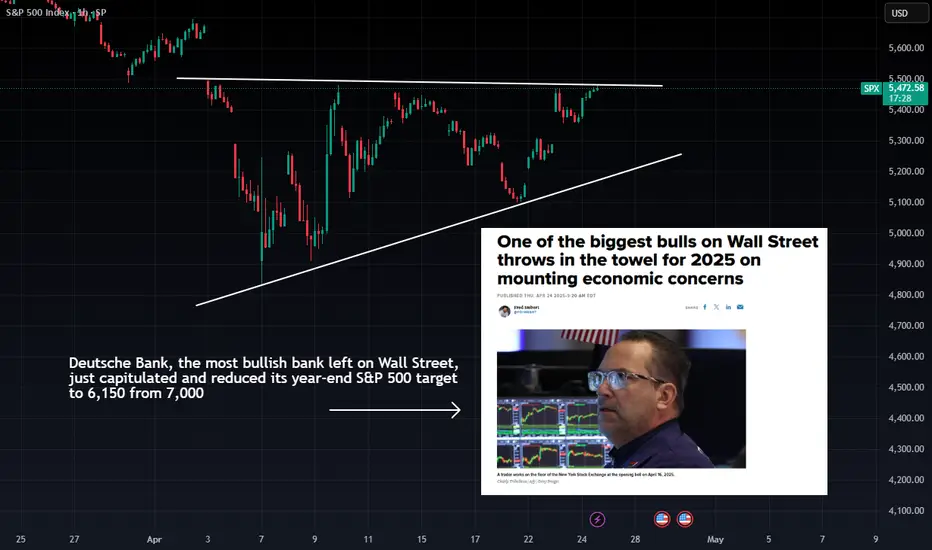
$SPX Bull/Bear Line in the Sand – Fireworks Ahead?The S&P 500 ( SP:SPX ) is sitting just below a clear resistance level—a true bull/bear line in the sand.
On the one hand, bulls are eyeing a potential breakout into the weekend that could ignite a short squeeze or continuation rally. 🎆 On the other, Deutsche Bank, the last of the major bulls, has thrown in the towel—cutting their year-end target from 7,000 to 6,150 amid economic concerns.
This is where things get interesting. If we break above this resistance with volume, expect upside momentum. If not… this could be the start of a deeper rollover.
👉 Watch that overhead line closely. It's the fuse. 💣
🟢 Breakout = bull party
🔴 Rejection = potential for bearish reversal
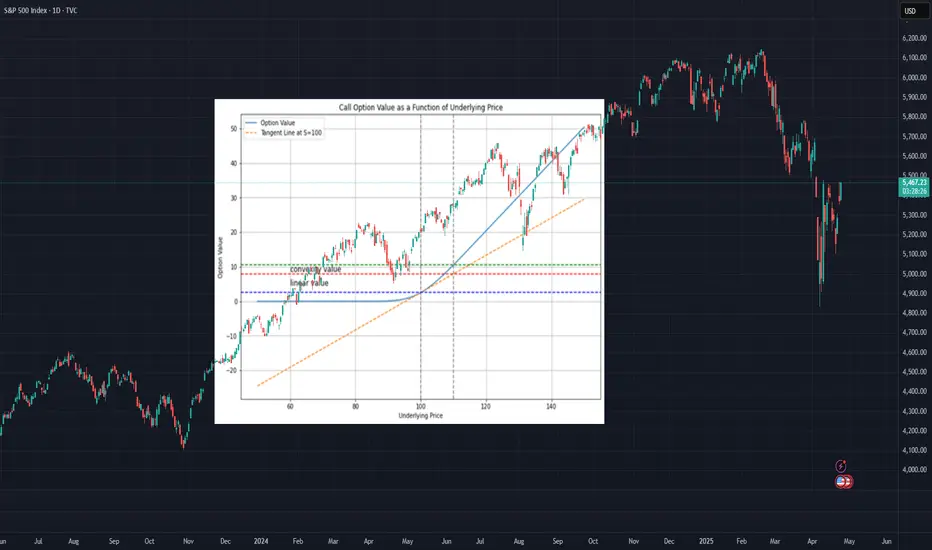
Option Insights – Trading the Greeks (Part 2 of 4):Gamma Effects# Option Insights – Trading the Greeks (Part 2 of 4)
## Option Convexity and Gamma Effects
### Gamma – The Convexity of Options
Gamma measures how much the Delta of an option changes in response to movements in the underlying asset’s price. Mathematically, it is the second derivative of the option’s value with respect to the price of the underlying. In simpler terms, Gamma quantifies the curvature—or convexity—of the option’s price sensitivity.
- Positive Gamma: Accelerating Delta as the underlying moves.
- Negative Gamma: Decelerating Delta as the underlying moves.
This convexity becomes especially important for traders managing exposure. A directional trader might seek:
- Positive Gamma near anticipated breakouts to increase exposure during favorable moves.
- Negative Gamma in areas where they want to taper exposure, such as in covered call setups (where the short call reduces gains as price rises).
---
## Gamma and Delta Hedging
Traders who Delta hedge their option positions using the underlying (or a Delta-1 instrument) face the reality of nonlinearity: Delta changes as the market moves, and Gamma determines how fast.
In practice, this means hedgers must adjust frequently to maintain a neutral Delta—Gamma tells them how often and how aggressively.
---
## Hedging a Position with Positive Gamma
When hedging and holding positive Gamma:
- If the underlying price rises → Delta increases → Sell the underlying.
- If the underlying price falls → Delta decreases → Buy the underlying.
This results in countercyclical trading, i.e., trading against the market trend.
**Advantages:**
- Potentially dampens volatility.
- Allows for limit order execution (e.g., sell at offer when price rises), capturing bid-offer spreads.
- Automated or semi-automated setups possible.
---
## Hedging a Position with Negative Gamma
With hedging and holding negative Gamma, the adjustments are procyclical:
- Price rises → Delta drops → Buy more underlying.
- Price falls → Delta rises → Sell more underlying.
**This means:**
- You're chasing the market, increasing exposure in the direction of the move.
- You likely cross the spread to ensure execution (lifting the offer or hitting the bid).
- This behavior tends to amplify volatility and incurs transaction costs.
---
## Summary: Gamma's Impact on Hedging
- Long Gamma → Hedge countercyclically, dampen market movements, and potentially profit from spreads.
- Short Gamma → Hedge pro-cyclically, amplify market movements, and pay the spread.
This distinction underscores a critical point: hedging Delta is not just about neutralizing exposure—it’s about managing how that exposure evolves, which is precisely what Gamma represents.
---
## Can You Hedge Delta Without Gamma Risk?
**In theory?** Yes.
**In practice?** Not really.
Hedging an option (a nonlinear instrument) with the underlying (a linear one) means you’re using a linear approximation of a curved payoff structure. This hedge is only locally accurate—it must be rebalanced frequently to remain effective.
While it’s theoretically possible to hedge both Delta and Gamma using other options, this introduces complexity:
- Other Greeks (like Theta and Vega) enter the equation.
- Option hedges are often illiquid, expensive, or difficult to scale.
For most traders, hedging Delta with the underlying remains the simplest, most liquid, and most cost-effective approach—despite the need for Gamma-based adjustments.
---
## Gamma Trading & Gamma Scalping
Even in non-directional strategies, Gamma has value.
Gamma scalping involves actively trading the underlying around an options position to exploit short-term price swings:
- You buy low and sell high as the underlying fluctuates,
- Profiting from volatility, not direction.
This is a powerful technique for monetizing Gamma, particularly when implied volatility is elevated relative to realized moves.
---
## Coming Up Next:
📘 Part 3: Gamma Scalping – Monetizing Convexity Through Active Hedging
by parsifaltrading
Option Insights – Trading the Greeks (Part 1 of 4): Delta Target# Option Insights – Trading the Greeks (Part 1 of 4)
## Delta Targeting
Options are often utilized by traders as a leveraged tool, akin to generating lottery tickets. By selecting the appropriate expiration time and strike price, it's possible to achieve significant leverage on an underlying asset, potentially yielding high profits in percentage terms, albeit with a low probability of occurrence.
However, trading options offers more than just directional bets on the underlying asset. Due to their dependence on various factors with distinct characteristics, option strategies enable flexible exposure management and innovative risk profiles.
To fully exploit the potential of options, risk factors are quantified using the **Greeks** – Greek letters (not all of them) that assess the sensitivity of option prices to changes in different risk factors ("primary Greeks") or second-order effects ("secondary Greeks").
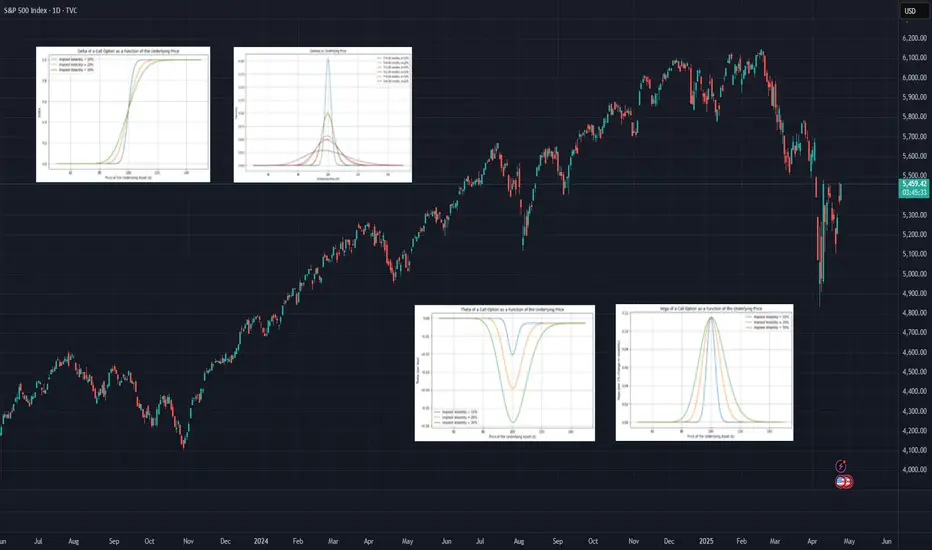
### Primary Greeks:
- **Delta** – sensitivity to changes in the underlying price
- **Theta** – sensitivity to changes in time
- **Vega** – sensitivity to changes in implied volatility
- **Rho** – sensitivity to changes in interest rates
### Secondary Greeks:
- **Gamma** – rate of change of Delta with respect to the underlying
- **Vanna** – rate of change of Delta with respect to implied volatility
- **Charm** – rate of change of Delta with respect to time
- **Volga** – rate of change of Vega with respect to implied volatility
For trading purposes, **Delta, Gamma, Theta, and Vega** are the most critical Greeks.\
They are depicted in the introductory graphs for Call Options, showing their behavior as a function of the underlying price across various levels of implied volatility.
*(Graphs not shown here — you can add screenshots as image uploads if needed.)*
---
## Trading the Greeks: Delta
The art of trading options is fundamentally the art of managing an option portfolio by **trading the Greeks**. For short-term options (from same-day expiration, or 0DTE, up to about three months), **Delta** is the dominant risk factor. The influence of other Greeks is limited to a narrow range around the strike price — this range becomes even narrower as expiration approaches.
When managing an options position, **controlling Delta is the first and most critical step**.
- Delta values range from 0% to 100% for long calls and short puts
- From -100% to 0% for long puts and short calls
- Delta represents the participation rate of an option in the underlying asset’s price movement
Example:\
If an option has a Delta of 40% and the underlying asset moves by 10 points, the option’s price will typically move by approximately 4 points in the same direction.
Delta can also be loosely interpreted as the **implied probability** that the option will expire in the money — though this is only an approximation.
---
## Delta-Neutral Strategy
The most common Delta-targeting strategy is the **Delta-neutral strategy**.
It aims to hedge the Delta of an options position by taking an **offsetting position in a Delta-1 instrument**. These instruments replicate the price movements of the underlying asset (e.g., the underlying itself, ETFs, futures, or CFDs).
### Example:
- If an options position has a Delta of 40% and a notional exposure of 100 units
- → Take a short position in 40 units of the underlying (or equivalent Delta-1 instrument)
But:\
Delta is **not constant** — it evolves over time (**Charm**), with price changes (**Gamma**), and with changes in implied volatility (**Vanna**).\
This means the hedge must be **adjusted regularly** to maintain Delta neutrality.
Adjustments are typically:
- Made at discrete intervals (e.g., daily)
- Or when Delta changes by a set amount (e.g., more than 5%)
---
## Delta Target Strategy (More General)
The Delta-neutral strategy is a **specific case** of a broader **Delta target strategy**, where the Delta target is explicitly set to zero.
### Who uses Delta target strategies?
- Option **market makers** to hedge inventory
- Traders aiming to **isolate other risk factors** (e.g., volatility premium strategies like short strangles)
These traders seek to:
> **Capture the volatility premium** — the difference between implied volatility at entry and realized volatility after
Delta target strategies with **non-zero targets** are used for managing portfolio-level risk when options are used alongside other instruments.
---
## Why Adjust Delta Target Strategies?
The main reasons for adjusting:
- **Gamma (convexity)**: Delta changes as the underlying moves
- **Time decay**:
- For OTM options: Delta decreases (calls), increases (puts)
- For ITM options: Opposite behavior
- **Changes in implied volatility or skew**: also affect Delta
---
## Coming Up Next:
📘 *Part 2: The Concept of Convexity and the Role of Gamma in Managing Delta Target Strategies*
---

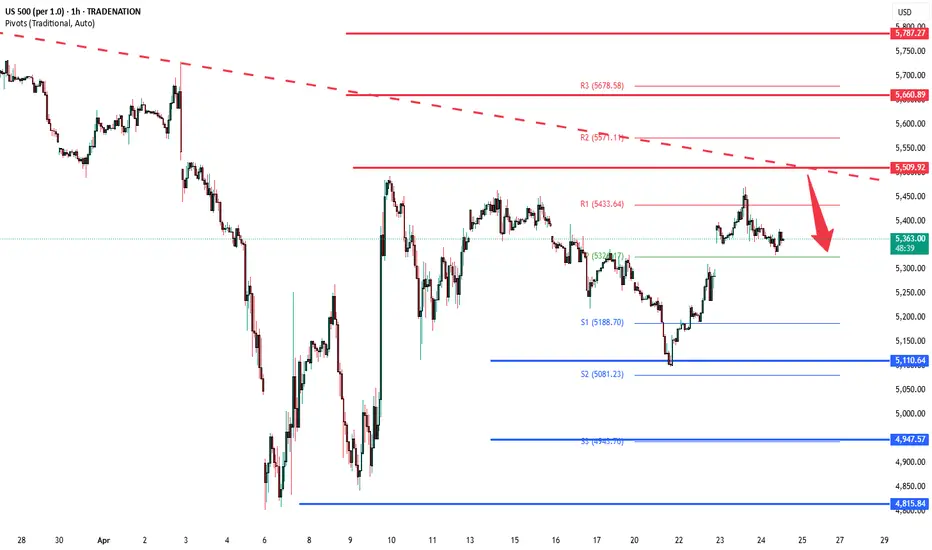
S&P500 INTRADAY resistance at 5510Stocks are pulling back after Wednesday’s rally, pressured by renewed trade tensions. China stated that no deal talks are underway, and Treasury Secretary Scott Bessent expressed scepticism over resolving the trade dispute. US futures slipped, the dollar weakened, and gold rose as investors sought safety.
Jefferies strategist Christopher Wood warned that US equities, Treasuries, and the dollar may face further downside, noting the market has likely peaked. Deutsche Bank also trimmed its S&P 500 target, citing the negative impact of ongoing tariffs on US companies.
It’s a packed earnings day: PepsiCo, Procter & Gamble, and American Airlines report before the open, while Alphabet and Intel are set to release results after the close.
Key Support and Resistance Levels
Resistance Level 1: 5510
Resistance Level 2: 5660
Resistance Level 3: 5790
Support Level 1: 5110
Support Level 2: 4950
Support Level 3: 4815
This communication is for informational purposes only and should not be viewed as any form of recommendation as to a particular course of action or as investment advice. It is not intended as an offer or solicitation for the purchase or sale of any financial instrument or as an official confirmation of any transaction. Opinions, estimates and assumptions expressed herein are made as of the date of this communication and are subject to change without notice. This communication has been prepared based upon information, including market prices, data and other information, believed to be reliable; however, Trade Nation does not warrant its completeness or accuracy. All market prices and market data contained in or attached to this communication are indicative and subject to change without notice.