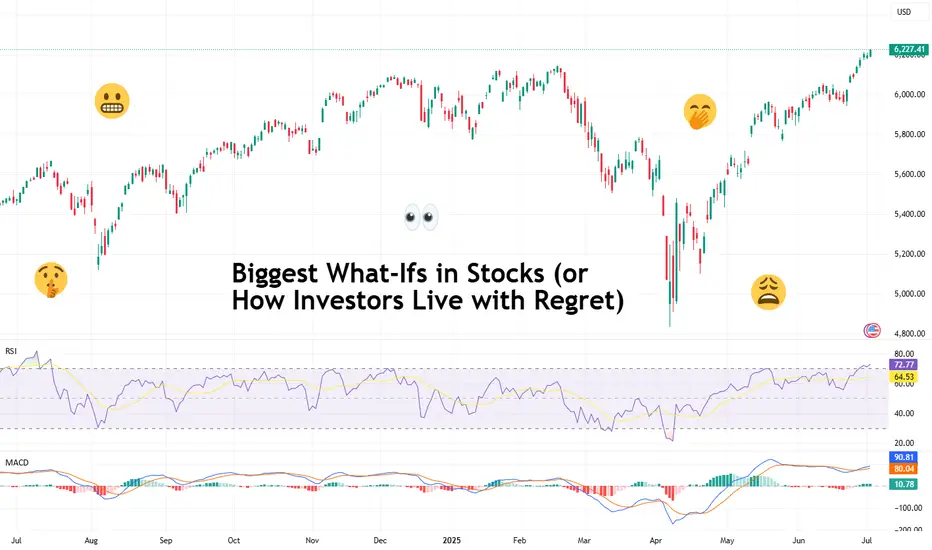
Biggest What-Ifs in Stocks (or How Investors Live with Regret)You think you’ve got regrets because you didn’t buy Nvidia NASDAQ:NVDA at $50 or sold Tesla NASDAQ:TSLA at $420? Join the club.
The stock market’s history is littered with “almost” trades, missed deals, and facepalm-worthy decisions that turned out to be trillion-dollar pivots.
This is the hall of fame for what didn’t happen — and what those stories teach us about how markets (and human nature) actually work. Call it a free masterclass in greed, fear, FOMO, and the priceless value of just sitting tight sometimes.
Take it easy today, grab your cold brew and read up on the biggest what-ifs in stock market history.
🍏 Ronald Wayne: The Patron Saint of “Oops”
Our first inductee needs no introduction. But let’s do it anyway. Ronald Wayne, the third Apple NASDAQ:AAPL co-founder, sold his 10% stake back in 1976 for the princely sum of $800. He wanted to avoid any debts if things went south. Sensible, right?
That $800 stake today would be worth more than $300 billion. That’s more than the GDP of Finland — and about 1.2 million new iPhones every single day for pretty much the rest of his life. Wayne has since said he doesn’t regret it. Which is probably the biggest lie he’s ever told.
🍿 Blockbuster’s Netflix “Pass”
In 2000, Netflix NASDAQ:NFLX was a DVD-by-mail startup with spotty profits. Reed Hastings, Netflix’s founder, knocked on Blockbuster’s door and offered to sell the whole thing for $50 million — about the price of a Hollywood production.
Blockbuster’s execs reportedly laughed him out of the room. “People will always want to drive to a store to rent a VHS,” they said, basically. Fast forward: Netflix is worth around $560 billion, and Blockbuster is down to one store that’s mostly a selfie museum for millennials who miss rewinding tapes.
💻 Microsoft’s Lifeline That Saved Apple
In 1997, Apple NASDAQ:AAPL was broke. Steve Jobs had returned but was days away from the company flat-lining for good. Enter Bill Gates.
Microsoft NASDAQ:MSFT wrote Apple a $150 million check, partly to keep antitrust regulators off its back. Jobs even appeared on stage with Gates beaming in on a giant screen like Big Brother — a moment that made every Apple fan cringe.
But that deal saved Apple’s hide. The iMac was born. The iPod followed. Then the iPhone. That $150 million is now a rounding error on Apple’s $3 trillion valuation. Sometimes your greatest rival is also your best frenemy.
🔍 Google: The $750K “Meh”
Before “Google it” became a verb, Larry Page and Sergey Brin tried to sell their little search engine to Excite — the Yahoo-lite portal that dominated the ‘90s web. The price? $750,000.
Excite’s CEO said search “wasn’t that important” — one of the worst calls in tech history. Today, Alphabet NASDAQ:GOOGL is worth over $2.1 trillion and always flashing bright on the Stock Heatmap , and Excite is a footnote in a forgotten Web 1.0 graveyard.
The lesson? Never dismiss a side project just because it doesn’t fit the spreadsheet.
💸 Masayoshi Son’s $200 Billion Slip
SoftBank’s Masayoshi Son is known for his giant, risky bets . And in 2017, he made a pretty good one: his Vision Fund scooped up a 5% chunk of Nvidia stock worth about $4 billion. He called GPUs the backbone of the AI revolution. He was right.
But by 2019, SoftBank was under pressure to tidy up its books. So Son sold the whole position for a tidy short-term profit. That stake today would be worth nearly $200 billion, given Nvidia’s rocket-fuel AI rally .
“We can cry together,” CEO Jensen Huang told Masa Son at an AI Summit in Tokyo last year. Early doesn’t always mean patient. And being “kind of right” can be the most painful lesson of all.
📊 Berkshire Hathaway: A Textile Mill’s Rebirth
Think of Berkshire Hathaway NYSE:BRK.A now — a $1 trillion behemoth. Insurance, utilities, railroads, huge piles of Apple shares . But back when Warren Buffett bought it, Berkshire was a dying textile business in New England.
Buffett only bought control because he was annoyed at the CEO’s lowball tender offer. It turned into his permanent holding company. The textile side eventually went extinct — but the insurance side became the cash-printing machine Buffett used to buy everything else.
Sometimes your best trade starts with pure pettiness.
🚀 Tesla: The Short Sellers’ Pain Cave
Here’s a more recent tale. Tesla was not long ago the most shorted stock on Earth. Everyone from hedge funds to your uncle at Thanksgiving was betting on Elon’s dream to fail.
Every now and then, the short-sellers get slapped with billions of dollars in losses, because the stock shoots up out of nowhere. The most recent example? November 12, when those naysayers nursed $7 billion in wiped out cash . Bears have been torched so many times, they might as well switch sides and sell Tesla hoodies instead.
🌌 Yahoo’s Double Miss: Google and Facebook
If you think blowing one chance is bad, try blowing two. Yahoo turned down the chance to buy Google for less than a million bucks. Then years later, they offered $1 billion for Facebook (now META NASDAQ:META ) — but bungled the negotiations and tried to lower the price. Zuck said “nope.”
But back to Google, because the story didn’t end there. In 2002, Yahoo said it wanted to buy Google for $3 billion. Brin and Page said $5 billion and Yahoo said no. Then Microsoft was ready to pay $40 billion to acquire Yahoo in 2008. But Yahoo said no.
Today, Google, Microsoft, and Meta are trillion-dollar titans. Yahoo? Sold itself for $4.5 billion, mostly for its patents, in 2016 to Verizon. Talk about slipping on the same banana peel more than once.
🧃 Apple: The Splits that Keep Giving
Want a reason to love boring old “buy and hold”? Apple NASDAQ:AAPL has split its stock five times since its 1980 IPO. If you’d bought 100 shares back then, you’d now have over 56,000 shares, plus mountains of dividends.
Next time you want to swing trade every squiggle, remember: sometimes the slowest route is the sweetest.
📝 Regret: The Only Universal Asset Class
Every trader has a “coulda, shoulda, woulda.” It’s the cost of doing business in a market that only makes sense in hindsight. Even the pros — billionaires, boards, hedge funds — have stories that make yours look tame.
Ronald Wayne reminds you that selling too soon can cost you your own island. Masayoshi Son proves being right but impatient is still being wrong. Yahoo shows that “almost” is worth exactly zero on a balance sheet.
What these stories prove is that the market’s biggest edge isn’t necessarily timing, genius, or inside scoops — it’s discipline, resilience, and sometimes a stubborn refusal to touch the sell button.
🤗 Bonus Story: Ballmer Regrets Nothing
But not every story has to be a regret story. Just look at Steve Ballmer, Microsoft ‘s former CEO. Since the early 2000s, he’s been holding his 4% stake in the software maker and that’s now worth more than $130 billion. No regrets found.
👉 What’s Your “One That Got Away”?
Now your turn : What’s your personal what-if story? Which ticker haunts you in your sleep? Drop your best missed trade or worst sell in the comments — we promise to laugh with you, not at you. Probably. Stay sharp. Stay patient!
SPX500 trade ideas
The market bias stays up, MJ stocks may be a buy here. The market continues to be biased up, and the target is likely the weekly B. MJ stocks are showing technical signs that a reversal may come. There may be other sectors similar as I think the summer bottom gamblers will start appearing now that everything else is at the highs. Gold looks like it will eventually go lower. Nat gas lost support and is likely to go lower. USOIL is bear flagging.

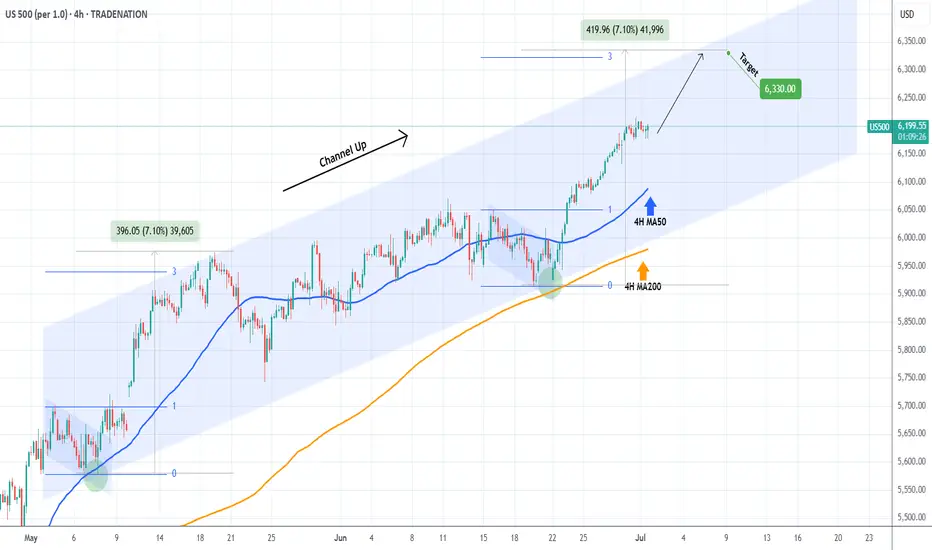
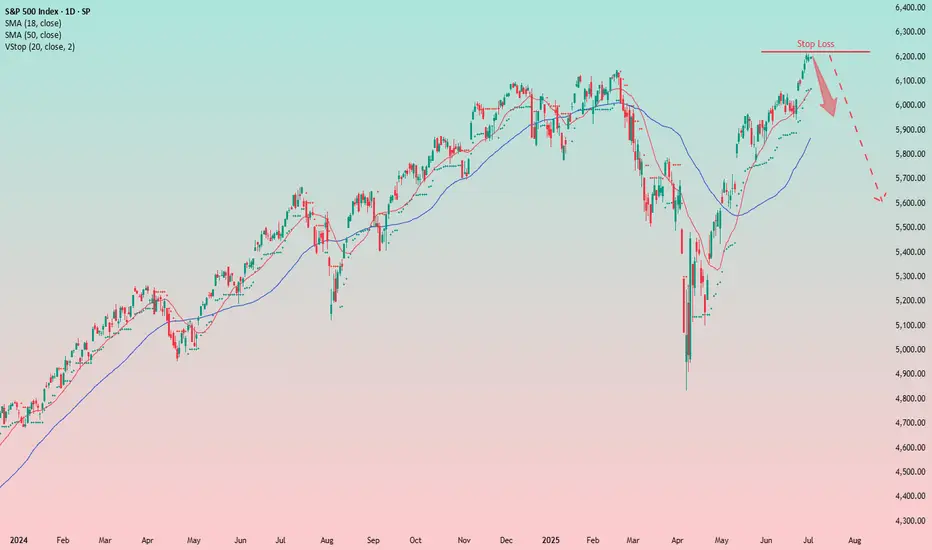
S&P500 Bullish Leg not over yet.The S&P500 index (SPX) has been trading within a Channel Up since the May 07 Low and is currently unfolding the latest Bullish Leg.
As you can see, it is far from having topped, not just by a plain trend-line (Higher Highs) perspective but also based on the Fibonacci and % rise terms relative to the previous Bullish Leg.
That peaked after a +7.10% rise, a little above the 3.0 Fibonacci extension. As a result, a 6330 Target on the short-term is more than fitting.
-------------------------------------------------------------------------------
** Please LIKE 👍, FOLLOW ✅, SHARE 🙌 and COMMENT ✍ if you enjoy this idea! Also share your ideas and charts in the comments section below! This is best way to keep it relevant, support us, keep the content here free and allow the idea to reach as many people as possible. **
-------------------------------------------------------------------------------
Disclosure: I am part of Trade Nation's Influencer program and receive a monthly fee for using their TradingView charts in my analysis.
💸💸💸💸💸💸
👇 👇 👇 👇 👇 👇
Stocks Are Crushing It at Record Highs. What’s Behind the Rally?Happy record highs, everyone — confetti, champagne, and yet another all-time high. The Nasdaq NASDAQ:IXIC and the S&P 500 SP:SPX just did it again — notched fresh closing records that have traders flexing their P&Ls like it’s 1999.
If you’ve been on the sidelines, you’re probably staring at the chart asking: How did we add trillions to market cap while my grocery bill still looks like a high-yield bond payment?
Good question. Because these days, stocks are behaving like they live on a separate planet from the actual economy (looking at you, Nvidia NASDAQ:NVDA ).
Let’s pop the hood and see what’s revving this record-breaking machine — and what potholes might lurk ahead.
🤫 Nasdaq: The Comeback Kid of 2025
Take the Nasdaq Composite NASDAQ:IXIC — your favorite tech playground — up a mind-boggling 32% since the April lows . One-third of its total value was minted in three months — as much as $7 trillion added in.
What happened? Well, start with the obvious: the Magnificent Seven are doing the heavy lifting again. Nvidia NASDAQ:NVDA , Microsoft NASDAQ:MSFT , Apple NASDAQ:AAPL , Amazon NASDAQ:AMZN , Alphabet NASDAQ:GOOGL , Meta NASDAQ:META , Tesla NASDAQ:TSLA — they’re the gym rats of this rally.
But here’s the kicker: while the headlines are all “index record highs,” the Mag 7 as a whole are actually down slightly for the year. The hero’s cape belongs mostly to a few standouts: Meta, up 21% this year. Microsoft, up 17%. And Nvidia? Not bad: up a whopping 65% since the April swoon.
When the generals lead, the army follows — at least until they don’t?
🤖 S&P 500: Powered by 7, Dragged by 493
The broad-based S&P 500 also clocked a new record close at 6,173.07 . Everyone loves to toast a new all-time high, but here’s your buzzkill: the “500” in S&P 500 is a bit of a myth these days.
The Magnificent Seven alone account for more than 30% of the index’s total weight. Last year, this elite club rose 57% while the other 493 stocks crawled up just 13%. Strip out the hyper-scalers, and you’ll find most stocks are still limping along, wrestling with tepid growth and stubborn inflation.
So yes — the S&P 500 is soaring. But the S&P 493? Not partying at the same rooftop bar.
💼 Conflicting Data: This Economy Ain’t It (Yet)
Here’s where it gets spicy: GDP actually shrank last quarter — down 0.5% year over year. Inflation is still running hot with May’s PCE figure at 2.7% (the Fed’s target is 2%).
Fed boss Jay Powell and the central bank squad are trying to thread the world’s tiniest policy needle: cut rates enough to juice the economy, but not so much that they stoke a fresh inflation flare-up.
Meanwhile, job numbers are a mixed bag , and corporate revenue hasn’t been setting new records to match those ceiling-high stock valuations.
In short, the disconnect between equity prices and economic reality is growing wider than the spread on your favorite meme coin during an illiquid Sunday afternoon.
👨🏻💻 Tariffs, Tweets, and the Trump Factor
And who could forget the wildcard factor? Trump’s new tariffs. The “reciprocal tariffs,” as he likes to pitch them. One day he’s threatening to slap 50% duties on everything from French wine to German cars. The next, he’s cozying up for “productive” chats with Brussels.
This policy whiplash makes supply chains sweat, but so far, equity traders are shrugging it off — and even cheering. Why? Because in Trump’s world, chaos means central banks might cut rates to cushion the blow. And nothing says “rocket fuel” for risk assets like lower borrowing costs.
Add to that the weird paradox that tariffs — while inflationary in the short run — can also weaken the dollar if the Fed turns dovish. A weaker greenback means US tech giants look cheaper to global investors. So… up we go.
🏛️ The Great Fed Cut Watch
Speaking of cuts: the Fed’s next meeting is in late July, and Wall Street is holding its breath. Rate cuts mean cheaper money — which often means traders load up on risk.
The market is currently pricing in a 90% chance of a cut in September (and an 80% chance of a hold in July). Meanwhile, gold OANDA:XAUUSD — the non-yielding safe haven — is selling off while traders are flocking toward the risk-end of the boat, leaving the safe-haven corner gathering dust.
👀 What’s Next? The Inevitable Hand-Wringing
So — should you pop champagne? Depends.
If you’re a trend follower, record highs are record highs. Momentum is your friend. But if you’re a value purist, these multiples probably make your eye twitch.
Big question: when does this all get too frothy? Will the next earnings season justify these valuations? Markets are forward-looking anyway — even if big tech’s revenue flops, that doesn’t mean money will flow out of the market cap.
After all, we’re halfway through the year and that means it’s time to pop open the Earnings calendar for those spring reports.
Any dip right now may very well be seen as an opportunity to swoop in at a lower price, not as something that indicates there’s something fundamentally wrong with the business.
🫶🏻 The Takeaway: Celebrate, but Stay Focused
The rally is real. The headlines are dazzling. But the same lessons apply: trends don’t last forever, risk doesn’t disappear just because the chart is green, and the Magnificent Seven won’t carry the world on their backs indefinitely.
So have your stop losses placed right, your position sizes sensible , and your eyes on the macro backdrop. Because record highs are fun, but holding the bag isn’t.
Off to you : Are you riding this rocket or waiting for the next dip? Drop your take below — are we so back, or about to crack?

Let’s talk about technical analysis & stops.Technical analysis is not your decision-making process — it’s a tool to help you structure better trading decisions by studying past price movements to anticipate likely future moves.
👉 Every time you look at a chart, you should decide:
✅ Do I want to trade at all?
✅ What’s my entry?
✅ Where’s my stop (when does my thesis fail)?
✅ What’s my target (where will I take profits)?
________________________________________
🛑 Where to put your stop?
Take the S&P 500 daily chart. It’s been trending up strongly. Many traders use an exponential moving average (EMA) as a dynamic stop.
But:
• A 9 EMA often stops you out too early on strong trends.
• Adjusting to a 15 or 16 EMA could keep you in the trade longer, letting your winners run.
In tools like TradingView, you can visually adjust the EMA and see in real time how it would have kept you in or taken you out.
________________________________________
💡 Key takeaway:
When price closes below your EMA stop — that’s your signal to exit and lock in profits.
Use TA to structure your trades, not just spot pretty patterns.
________________________________________
💬 What’s your favourite method for setting stops?
Disclaimer:
The information posted on Trading View is for informative purposes and is not intended to constitute advice in any form, including but not limited to investment, accounting, tax, legal or regulatory advice. The information therefore has no regard to the specific investment objectives, financial situation or particular needs of any specific recipient. Opinions expressed are our current opinions as of the date appearing on Trading View only. All illustrations, forecasts or hypothetical data are for illustrative purposes only. The Society of Technical Analysts Ltd does not make representation that the information provided is appropriate for use in all jurisdictions or by all Investors or other potential Investors. Parties are therefore responsible for compliance with applicable local laws and regulations. The Society of Technical Analysts will not be held liable for any loss or damage resulting directly or indirectly from the use of any information on this site.

$SPX500 Most Hated Rally to Continue?FOREXCOM:SPX500 continues into price discovery suggesting a wave (3) is still underway but nearing a its minimum target of the 1.618 Fibonacci extension target $6310. Overextension of this target will demonstrate an even stronger bullish outlook.
Long term terminal targets remains above $7000 for me.
A short term pull back is a high probability but markets can stay irrational longer than participants can stay liquid.
Safe trading
Bearish Outlook on the S&P 500: Time to Get ReadyFrom a long-term perspective, I see a short setup building on the S&P 500 index. The anticipated rate cuts in the U.S. — which I believe are coming soon — have historically led to market declines, despite the common perception that lower rates are bullish for equities.
Additionally, the market appears overheated: P/E ratios are at extreme highs, more than 50% above historical averages.
Given this, I expect we’ll see a downside move soon.
Since markets tend to rise slowly but fall quickly, I’m beginning to build a short position in advance. Stops may get hit, and re-entries might be necessary, but overall I see more reasons supporting this thesis than contradicting it.
$100 to $1k to $10k to $100k: TRADING MASTERCLASSHow I approach trading:
Trading is a mostly psychological endeavor
You will not WIN LONGTERM in trading until you WIN YOURSELF (i.e. master your emotions)
I use Technical Analysis to help me determine overall Market Direction and Entry/Exit points
I do not use ANY fundamental analysis in my trading
I use Elliott Wave Theory to understand MARKET STRUCTURE
I use a combination of Anchored Volume Weighted Average Price (AVWAP), Fixed Range Volume Point of Control (VPOC) and custom coded Momentum indicators to pinpoint Entry/Exit points
Risk Management:
I will generally aim for 2%-5% percent stop loss but price structure will dictate as well
Position sizing will be fluid
Targets will be fluid but will generally target key Fib Extensions, VWAPs or VPOCs..or a combination of all of the above
Starting Account Size:
$100
Goal:
Grow a small $100 account to $1k then $10k then $100k
Every trade will be public...wins and losses
I will be looking to make my first trade(s) shortly and will show Entry level, Stop Loss and Target
NONE OF THIS CONSTITUTES FINANCIAL ADVICE
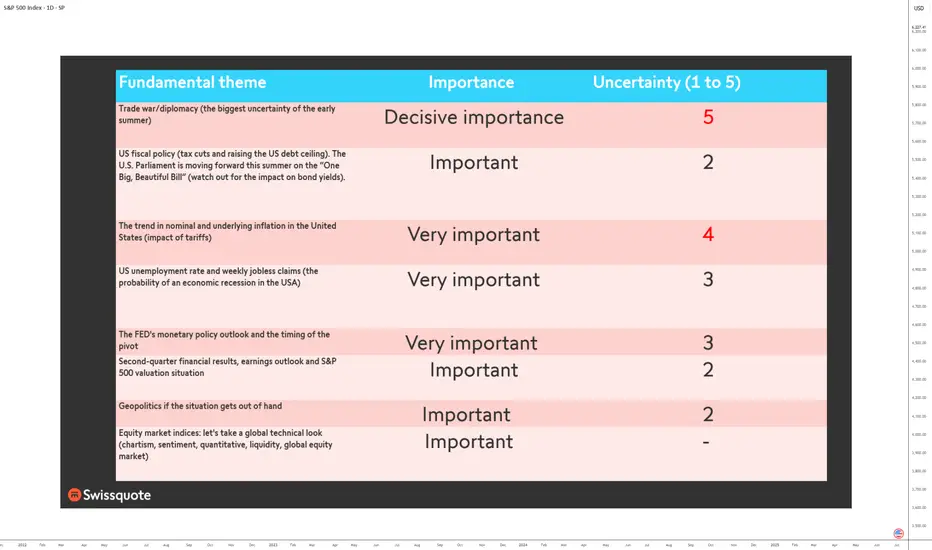
Top fundamentals that will shape the S&P 500 this summer 2025The summer of 2025 is characterized by a combination of macroeconomic and microeconomic factors that will shape the trajectory of the US equity market. While the S&P 500 is trading close to its all-time highs and at a valuation comparable to that at the end of 2021, the strength of the upward momentum will depend on the conjunction of several key variables. Understanding these fundamentals is crucial to grasping the potential and risks awaiting investors over the coming months.
1) The trade war and economic diplomacy, the main source of uncertainty
The trade issue remains the most unpredictable at the start of the summer. The July 9 deadline for the conclusion or failure of tariff negotiations is crystallizing tensions between the United States and its main partners. The prospect of a new wave of tariffs could have a direct impact on production costs, inflation and business confidence. Trade diplomacy is thus the variable most likely to provoke volatility jolts and challenge positive earnings growth expectations. If trade agreements are signed, then this will help to sustain the S&P 500's uptrend.
2) US fiscal policy: the “One Big, Beautiful Bill”
The Trump administration's major tax bill is another hotspot. This piece of legislation calls for an extension of the tax cuts initiated in 2017 and a dramatic increase in the public debt ceiling, to the tune of $5,000 billion. While these measures potentially support consumption and private investment, their medium-term impact on public finances is uncertain. The real issue for the equity market is to assess whether these decisions will lead to a surge in long-term US bond yields. A slippage in US Treasury yields would increase corporate financing costs and undermine currently high valuation multiples. Conversely, if yields remain contained, the equity market's upward momentum could continue.
3) Inflation and the Fed's monetary policy: a delicate balance
The trajectory of inflation, in particular that of the PCE index, will be a major determinant. US inflation is currently slightly below the Fed's target. Several components, notably the services sector, which accounts for almost two-thirds of the PCE basket, are proving relatively stable. Inflationary risks are more likely to come from commodities, particularly if trade tensions reignite. Oil, which accounts for around 11% of the PCE basket, is currently showing no major warning signs, benefiting from a geopolitical calm. Real estate and healthcare are also showing reassuring indicators. Against this backdrop, the Federal Reserve is adopting a cautious stance: while several major Western central banks are moving towards a neutral rate, the Fed is stalling and conditioning its monetary pivot on visibility regarding tariffs and corporate behavior.
The timing of rate cuts is one of the biggest sticking points. According to recent signals, the first rate cut could take place as early as September. However, influential members of the FOMC, appointed by the Trump administration, are arguing for earlier easing. The political pressure is strong: Trump is calling for immediate cuts, but Chairman Powell remains in control of the agenda, taking care to preserve a consensus within the committee.
4) The job market and the likelihood of a recession
The US employment situation is an advanced barometer of the economic cycle. Weekly jobless claims and the aggregate unemployment rate are closely monitored. Historically, a significant rise in unemployment signals that the economic slowdown is already underway. For the time being, the labor market is proving resilient, but the slightest deterioration could alter investors' central scenario and reinforce recessionary expectations. This risk is one of the potential dampeners to the prevailing optimism, unless it were to accelerate the timetable for resuming the cut in the federal funds rate.
5) Second-quarter results and earnings outlook
The second-quarter earnings season is of particular importance. US companies must demonstrate their ability to deliver earnings growth in line with forecasts, even as valuation multiples remain stretched. Maintaining high price levels on the S&P 500 assumes robust earnings growth and confident guidance from management. Failing this, the risk of a correction would be high, especially as the market has already incorporated many positive factors. The weakness of the US dollar and the price of oil, as well as the current momentum in AI, could hold out some pleasant surprises for second-quarter results.
6) Geopolitics and oil, potential sources of volatility
Finally, global geopolitics is a second-order variable, but one that could suddenly become a priority. A rapid deterioration in the international situation, particularly in the Middle East or the China Sea, could affect trade flows and oil prices, fuelling renewed inflation and financial volatility.
Conclusion :
The summer of 2025 promises to be a period of strategic transition for the US equity market. Between trade diplomacy, fiscal policy, inflation, the trajectory of interest rates and earnings momentum, investors will have to deal with an accumulation of uncertain factors. If these uncertainties gradually dissipate, the uptrend could continue. Conversely, the combination of a geopolitical shock, a rebound in inflation and a political stalemate over the federal budget would have the potential to weaken the current rally.
DISCLAIMER:
This content is intended for individuals who are familiar with financial markets and instruments and is for information purposes only. The presented idea (including market commentary, market data and observations) is not a work product of any research department of Swissquote or its affiliates. This material is intended to highlight market action and does not constitute investment, legal or tax advice. If you are a retail investor or lack experience in trading complex financial products, it is advisable to seek professional advice from licensed advisor before making any financial decisions.
This content is not intended to manipulate the market or encourage any specific financial behavior.
Swissquote makes no representation or warranty as to the quality, completeness, accuracy, comprehensiveness or non-infringement of such content. The views expressed are those of the consultant and are provided for educational purposes only. Any information provided relating to a product or market should not be construed as recommending an investment strategy or transaction. Past performance is not a guarantee of future results.
Swissquote and its employees and representatives shall in no event be held liable for any damages or losses arising directly or indirectly from decisions made on the basis of this content.
The use of any third-party brands or trademarks is for information only and does not imply endorsement by Swissquote, or that the trademark owner has authorised Swissquote to promote its products or services.
Swissquote is the marketing brand for the activities of Swissquote Bank Ltd (Switzerland) regulated by FINMA, Swissquote Capital Markets Limited regulated by CySEC (Cyprus), Swissquote Bank Europe SA (Luxembourg) regulated by the CSSF, Swissquote Ltd (UK) regulated by the FCA, Swissquote Financial Services (Malta) Ltd regulated by the Malta Financial Services Authority, Swissquote MEA Ltd. (UAE) regulated by the Dubai Financial Services Authority, Swissquote Pte Ltd (Singapore) regulated by the Monetary Authority of Singapore, Swissquote Asia Limited (Hong Kong) licensed by the Hong Kong Securities and Futures Commission (SFC) and Swissquote South Africa (Pty) Ltd supervised by the FSCA.
Products and services of Swissquote are only intended for those permitted to receive them under local law.
All investments carry a degree of risk. The risk of loss in trading or holding financial instruments can be substantial. The value of financial instruments, including but not limited to stocks, bonds, cryptocurrencies, and other assets, can fluctuate both upwards and downwards. There is a significant risk of financial loss when buying, selling, holding, staking, or investing in these instruments. SQBE makes no recommendations regarding any specific investment, transaction, or the use of any particular investment strategy.
CFDs are complex instruments and come with a high risk of losing money rapidly due to leverage. The vast majority of retail client accounts suffer capital losses when trading in CFDs. You should consider whether you understand how CFDs work and whether you can afford to take the high risk of losing your money.
Digital Assets are unregulated in most countries and consumer protection rules may not apply. As highly volatile speculative investments, Digital Assets are not suitable for investors without a high-risk tolerance. Make sure you understand each Digital Asset before you trade.
Cryptocurrencies are not considered legal tender in some jurisdictions and are subject to regulatory uncertainties.
The use of Internet-based systems can involve high risks, including, but not limited to, fraud, cyber-attacks, network and communication failures, as well as identity theft and phishing attacks related to crypto-assets.
Major resistance level for the S%P 500the s and p 500 have been on an uptrend but reems some correction might take place soon
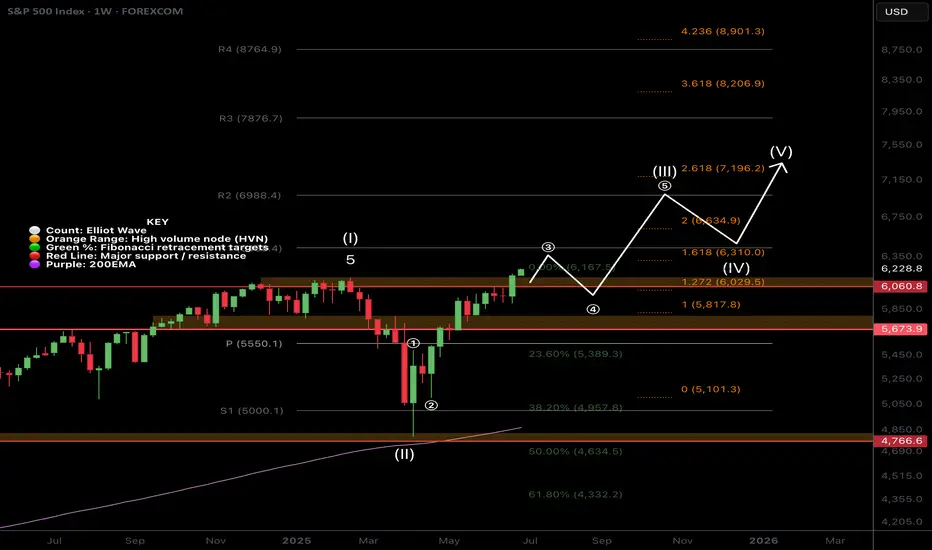
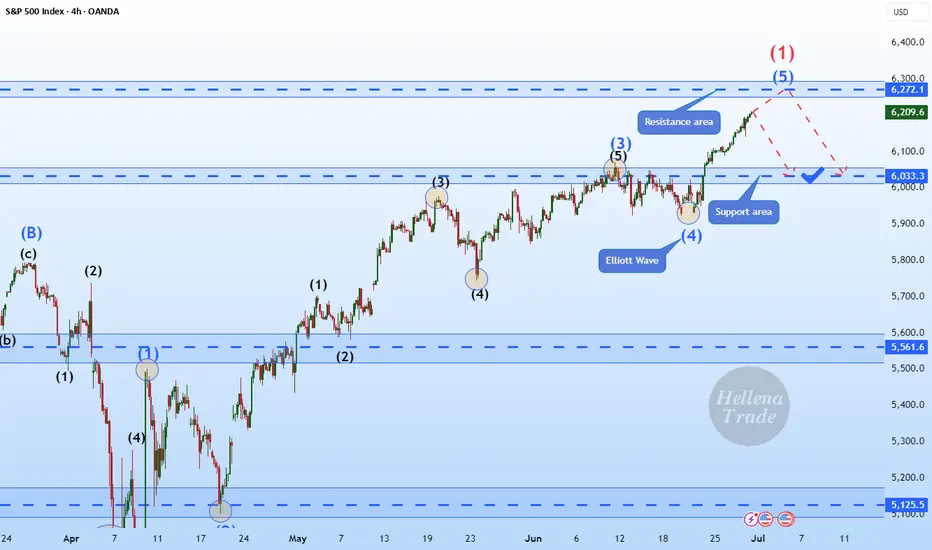
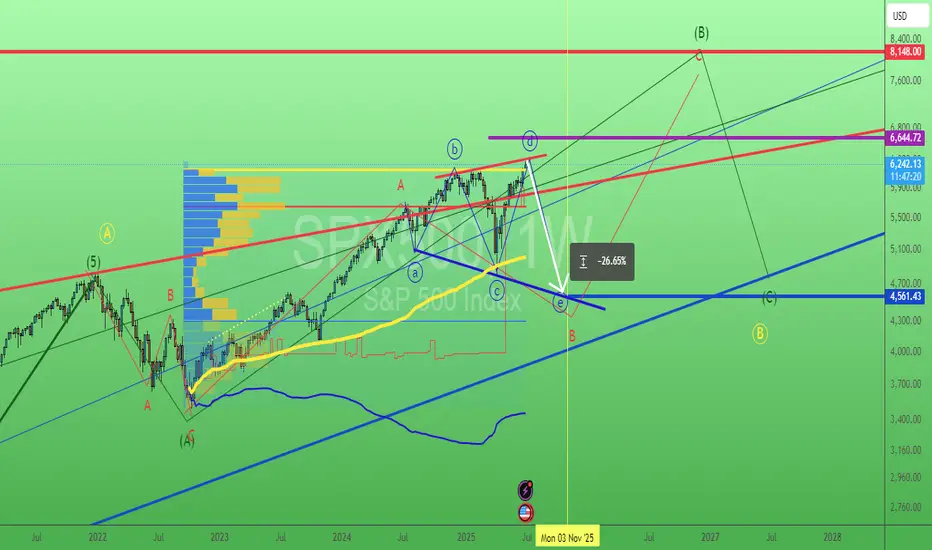
Hellena | SPX500 (4H): SHORT to support area of 6033.Colleagues, I assume that wave “1” completes the upward movement and somewhere around here a major correction ‘2’ should begin, which will consist of waves “ABC” and may continue to the level of 5700. But for now, I think we need to focus on the nearest targets.
I see the support area of 6033 as the first target.
Manage your capital correctly and competently! Only enter trades based on reliable patterns!
S&P500 bullish ahead of US employment- NFP numbersHouse Republicans moved Trump’s major tax and spending bill closer to a final vote, which could happen before his July 4 deadline. The package includes tax cuts, immigration funding, and the rollback of green energy incentives. Gamblers are raising concerns about a tax increase in the bill that could affect them.
In trade news, the US eased export rules on chip design software to China as part of an ongoing deal. China’s tone has shifted more positively, with a top official saying he’s hopeful about US-China relations and that conflict between the two is “unimaginable.”
At the Fed, Chair Jerome Powell hasn’t said if he’ll step down when his term ends in May, adding uncertainty. Trump, who wants a loyal replacement, has called for his resignation after a federal agency accused Powell of giving misleading testimony about expensive Fed building renovations.
On Wall Street, value investing made a comeback last quarter. Over 60% of active value fund managers beat their benchmarks by buying cheap industrial stocks and avoiding underperforming sectors like utilities and consumer staples.
Conclusion:
US equities are steady but cautious. Uncertainty around Fed leadership and Trump’s economic plans is keeping markets in check, while improving US-China trade relations and a shift toward value stocks are offering support.
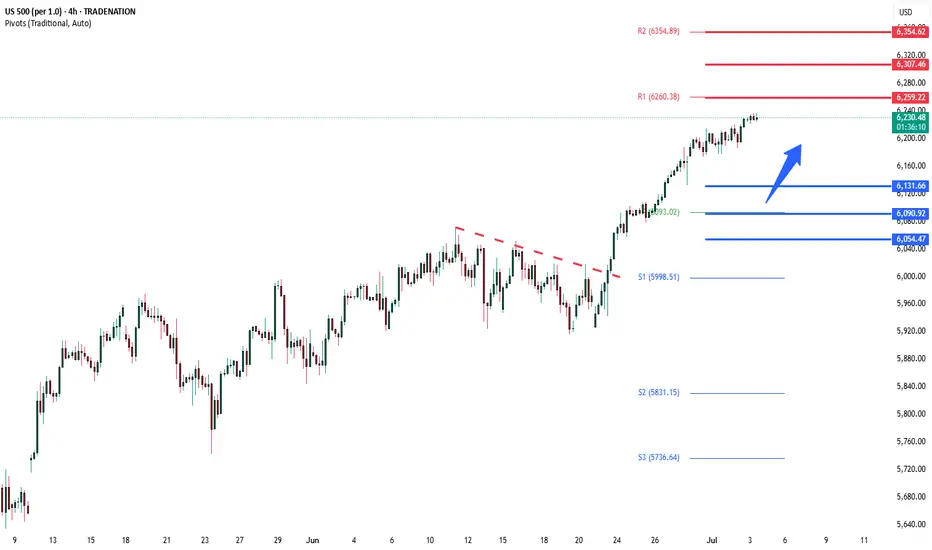
Key Support and Resistance Levels
Resistance Level 1: 6260
Resistance Level 2: 6307
Resistance Level 3: 6355
Support Level 1: 6130
Support Level 2: 6090
Support Level 3: 6055
This communication is for informational purposes only and should not be viewed as any form of recommendation as to a particular course of action or as investment advice. It is not intended as an offer or solicitation for the purchase or sale of any financial instrument or as an official confirmation of any transaction. Opinions, estimates and assumptions expressed herein are made as of the date of this communication and are subject to change without notice. This communication has been prepared based upon information, including market prices, data and other information, believed to be reliable; however, Trade Nation does not warrant its completeness or accuracy. All market prices and market data contained in or attached to this communication are indicative and subject to change without notice.
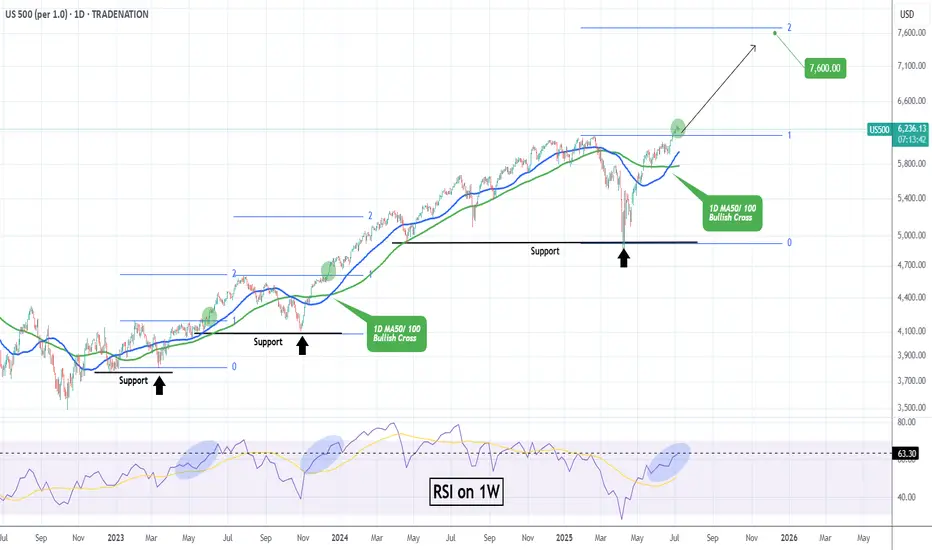
S&P500 Strong Buy Signal flashed for the 3rd time in 2 years!The S&500 index (SPX) is comfortably trading above its previous All Time High (ATH) and shows no signs of stopping here. Coming off a 1D MA50/ 100 Bullish Cross, we expect the 1D MA50 (blue trend-line) to turn now into the first long-term Support going towards the end of the year.
The last 1D MA50/ 100 Bullish Cross (December 15 2023) was nothing but a bullish continuation signal, which extended the uptrend all the way to the 2.0 Fibonacci extension, before a pull-back test of the 1D MA100 (green trend-line) again.
The 1W RSI is now on the same level (63.30) it was then. In fact it is also on the same level it was on June 05 2023, which was another such bullish continuation signal that peaked on the 2.0 Fib ext.
This suggests that we have a rare long-term Buy Signal in our hands, only the 3rd time in 2 years that has emerged. Based on that, we should be expecting to see 7600 as the next Target before it hits the 2.0 Fib ext and pulls back to the 1D MA100 again and there is certainly enough time to do this by the end of the year, assuming the macroeconomic environment favors (trade deals, potential Fed Rate cuts etc).
-------------------------------------------------------------------------------
** Please LIKE 👍, FOLLOW ✅, SHARE 🙌 and COMMENT ✍ if you enjoy this idea! Also share your ideas and charts in the comments section below! This is best way to keep it relevant, support us, keep the content here free and allow the idea to reach as many people as possible. **
-------------------------------------------------------------------------------
Disclosure: I am part of Trade Nation's Influencer program and receive a monthly fee for using their TradingView charts in my analysis.
💸💸💸💸💸💸
👇 👇 👇 👇 👇 👇
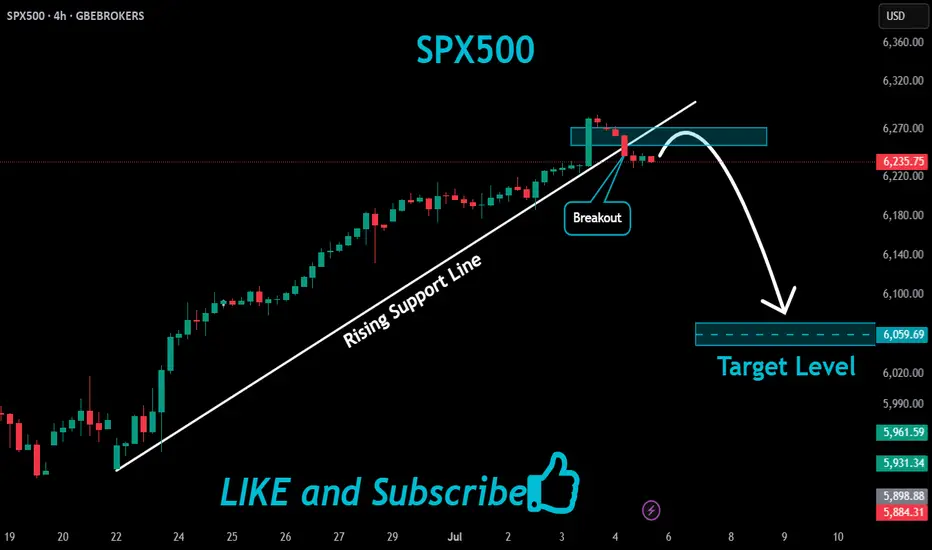
SPX500 Bearish Breakout!
HI,Traders !
#SPX500 was trading along
The rising support line but
Now we are seeing a bearish
Breakout so we are bearish
Biased and we will be expecting
A further bearish move down !
Comment and subscribe to help us grow !
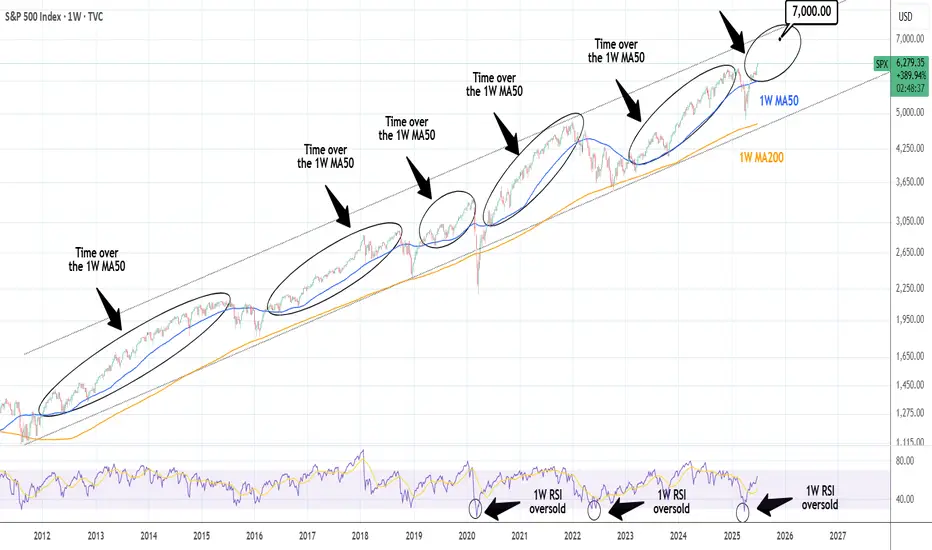
S&P500: Once it breaks the 1W MA50, it doesn't look back.S&P500 has turned overbought on its 1D technical outlook (RSI = 75.570, MACD = 96.940, ADX = 23.950) and rightly so as it is extending the rally after crossing above the 1W MA50. The Channel Up since late 2011 shows that when the index crosses above its 1W MA50, it tends to spend a notable time over it (and every contact is a buy opportunity), with the most recent example being the March 2023 - December 2024 period. The shortest such period has been in 2019, which was suddently disrupted by the black Swan event of COVID. We may have gotten out of a similar situation as Trump's tariffs disrupted the uptrend earlier this year with a huge, unexpected correction. There 1W MA200 supported and this brings us to a new 'above the 1W MA50 bullish phase', which even if it is as short as 2019, it can still target 7,000.
See how our prior idea has worked out:
## If you like our free content follow our profile to get more daily ideas. ##
## Comments and likes are greatly appreciated. ##
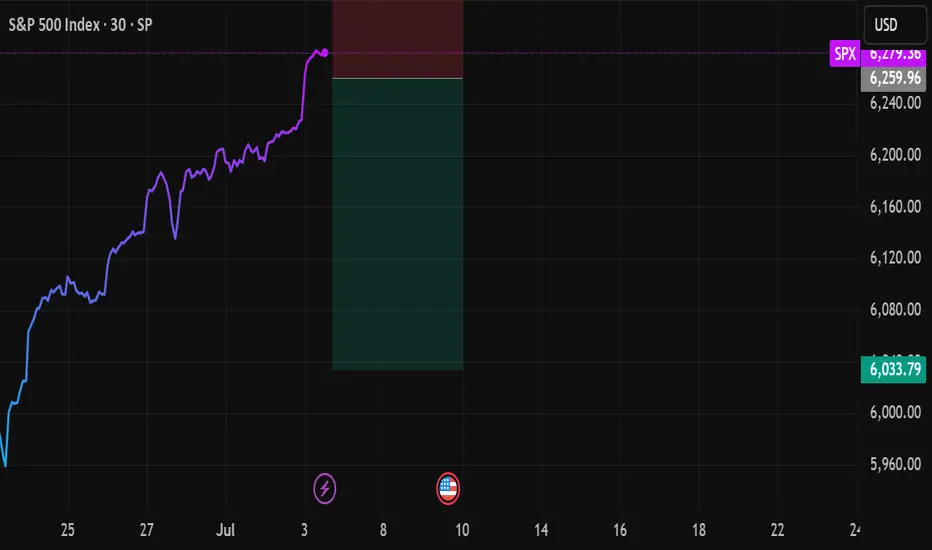
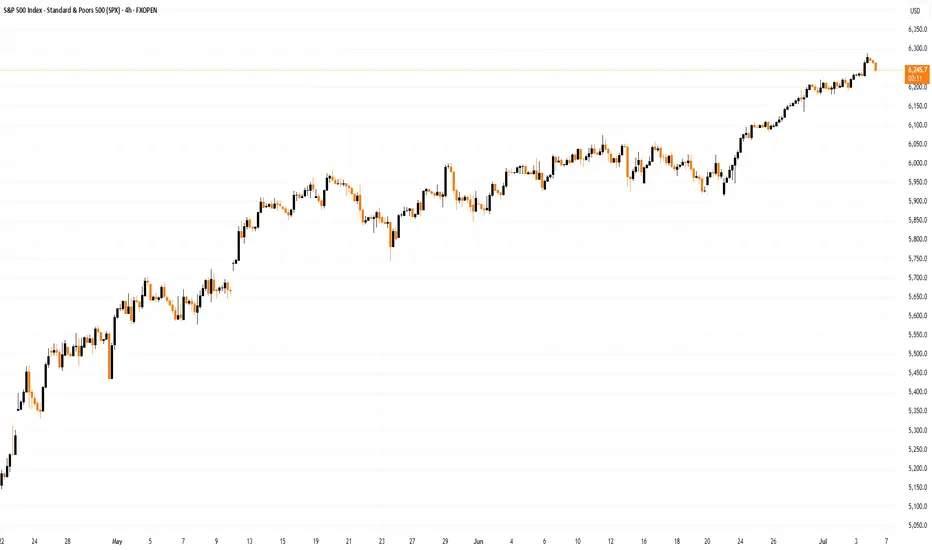
S&P 500 Hit Record High Ahead of Holiday BreakS&P 500 Hit Record High Ahead of Holiday Break
Today, financial markets in the United States are closed in observance of Independence Day. Investor sentiment was likely buoyed by the latest rally in the S&P 500 index (US SPX 500 mini on FXOpen), which set a new all-time high yesterday, surpassing 6,280.
The bullish momentum has been driven by robust labour market data in the US. According to ForexFactory, analysts had anticipated a rise in the unemployment rate from 4.2% to 4.3%, but instead, it unexpectedly declined to 4.1%.
Can the stock market continue to climb?
Technical Analysis of the S&P 500 Chart
Analysing the 4-hour chart of the S&P 500 index (US SPX 500 mini on FXOpen)on 30 June, we observed the following:
→ An ascending channel was formed (indicated in blue);
→ A developing bullish impulse (marked with an orange line) suggested the price would move towards the upper boundary of the channel – a scenario that materialised with yesterday’s rally (as shown by arrow 1).
However, from a price action perspective, the recent downward move (arrow 2) has now gained significance. It may indicate that sellers are becoming more active around the identified resistance level.
Should the price decline towards the lower orange line, this could negate the current bullish impulse altogether, effectively reflecting a classic bearish engulfing pattern.
Given the above, there is reason to believe that bears are attempting to regain control after the S&P 500 (US SPX 500 mini on FXOpen) surged over 5% in the past 10 days. As such, a potential breakout below the orange line cannot be ruled out, with price action possibly targeting the median of the blue ascending channel.
What happens next?
The market’s trajectory will largely hinge on developments related to tariffs. Trade policy will remain in the spotlight next week, as key deadlines set by the White House approach — events that traders will be closely monitoring.
This article represents the opinion of the Companies operating under the FXOpen brand only. It is not to be construed as an offer, solicitation, or recommendation with respect to products and services provided by the Companies operating under the FXOpen brand, nor is it to be considered financial advice.
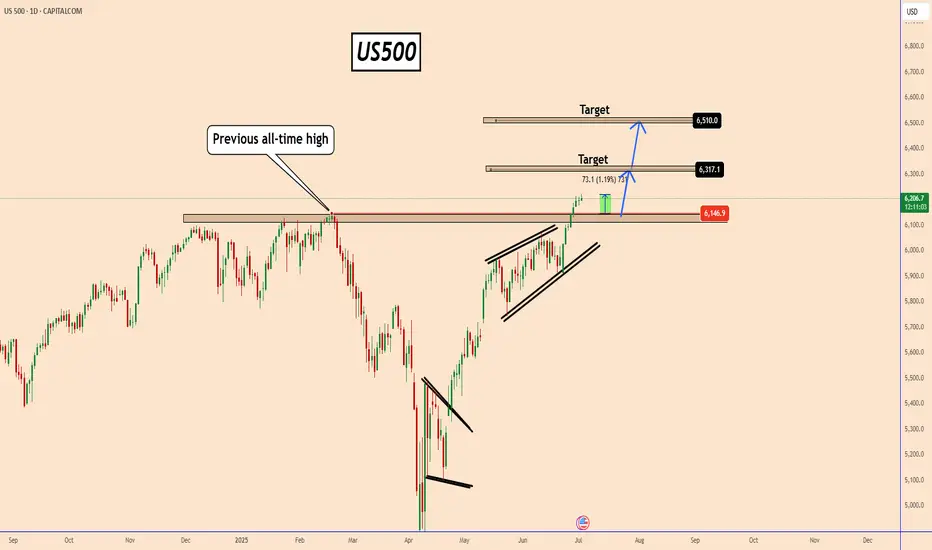
US500 Eyes 6317 and 6510 After Historic BreakoutUS500 Eyes 6317 and 6510 After Historic Breakout
The US500 has broken out above its previous all-time high near 6147, following news of a ceasefire agreement between the U.S., Israel, and Iran.
Since then, equity markets have surged, with indices leading the rally.
US500 has now reached a fresh all-time high at 6220, confirmed by a strong weekly candle close above the former peak, adding technical value to the breakout.
Looking ahead, the US500 appears poised to extend its gains toward the 6317 and 6510 levels on the daily chart.
A stronger-than-expected Non-Farm Payroll (NFP) report could further fuel this bullish momentum.
You may find more details in the chart!
Thank you and Good Luck!
PS: Please support with a like or comment if you find this analysis useful for your trading day
SP500 rock & roll with Trump.. 4/July/25SPX500 breaking ATH again are we in bullish stage? Or again Donald Trump "Inviting" us come to his WWE stage for his favourite "wrestling" games.. Jumping up and down or up side down.( expanding triangle) ......
SPX: highly optimisticThe US market celebrated on Friday the US Independence Day, after highly optimistic last two weeks. Almost every day, the S&P 500 was reaching new all time highest levels, finishing Thursday trading session at 6.279. At this moment this is officially treated as a new ATH for the index. The optimism was supported by better than expected US jobs data posted during the previous week. The NFP added 147K new jobs in June, which beated market expectations. The strong US payrolls reinforced market confidence despite concerns over trade tariffs. With inflation remaining sticky and solid jobs growth, markets have increased expectations of the Fed's rate cut in September. Currently, there is relatively low odds that the next rate cut might occur at the Julys FOMC meeting.
Tech companies were again those who led the index to the upside. The leader was for one more time Nvidia, with a weekly surge of 9,7%. AMZN was traded higher by 6,3%, MSFT by 3,9%. TSLA was struggling a bit, ending the week 0,33% higher from the week before.
Weekly news regarding trade tariffs include a US-Vietnam trade deal of 20% tariffs on imports from Vietnam. At the same time, the US exports to Vietnam will be tariffs-free. However, markets are still concerned regarding the final resolution of imposed 90-days delay of implemented tariffs for almost 180 countries around the world, a period which expires in July. On the other hand, Trump's tax mega bill was passed by the US Senate on Tuesday, and is currently awaiting final approval from the House. There were many discussions during the previous period that this tax mega bill might further increase US debt levels, which will be negatively reflected in the economy.
S&P500 and Nasdaq Short: Wave 5 <= Wave 3Based on the Elliott Wave rule that wave 3 is not the shortest wave, I gave a projection on where the peak of both S&P500 and Nasdaq could be. Based on these peaks, the stop is set above and the take profit target is where wave 4 was.

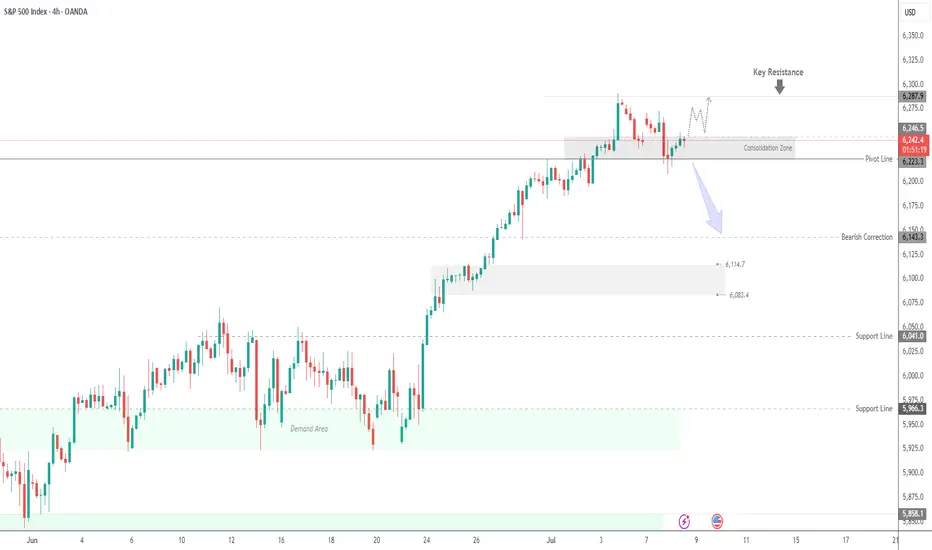
SPX500 Range-Bound Between 6223–6246 |Breakout Will Define TrendSPX500 – Technical & Fundamental Outlook
The SPX500 is currently trading within a narrow consolidation zone between 6223 and 6246.
A 1H or 4H candle close below 6223 would confirm a bearish breakout, with downside targets at 6191 and 6143.
Conversely, a 1H close above 6246 would signal bullish continuation, potentially driving the price toward the next resistance at 6287, followed by 6305.
Support: 6223 / 6191 / 6143
Resistance: 6287 / 6305
Fundamental Note:
The tariff situation remains a major driver.
Successful negotiations would likely boost bullish sentiment across indices.
Lack of progress may trigger renewed bearish momentum.
July Doesn't Disappoint - S&P Nasdaq Dow Russell All RunningS&P All Time Highs
Nasdaq All Time Highs
Dow Jones closing in on All-Time Highs (and outperforming both S&P and Nasdaq recently)
Russell 2000 playing catch up and moving higher
This is melt-up at its finest
Since US/China Trade Agreement and Middle East Ceasefire Agreement, markets have used
these two events as further catalysts to continue the upside runs
Stochastic Cycle with 9 candles suggesting a brief pause or pullback in the near-term, but
a 3-5-10% pullback is still an opportunity to position bullish for these markets
I'm only bearish if the markets show that they care with price action. The US Consumer isn't breaking. Corporate Profits aren't breaking. Guidance remains upbeat. Trump is Pro Growth and trolling Powell on the regular to run this economy and market HOT demanding cuts (history says that's a BUBBLE in the making if it's the case)
Like many, I wish I was more aggressive into this June/July run thus far, but I'm doing just fine with steady gains and income trades to move the needle and still having plenty of dry powder
on the sidelines for pullbacks
Markets close @ 1pm ET Thursday / Closed Friday for 4th of July
Enjoy the nice long weekend - back at it next week - thanks for watching!!!

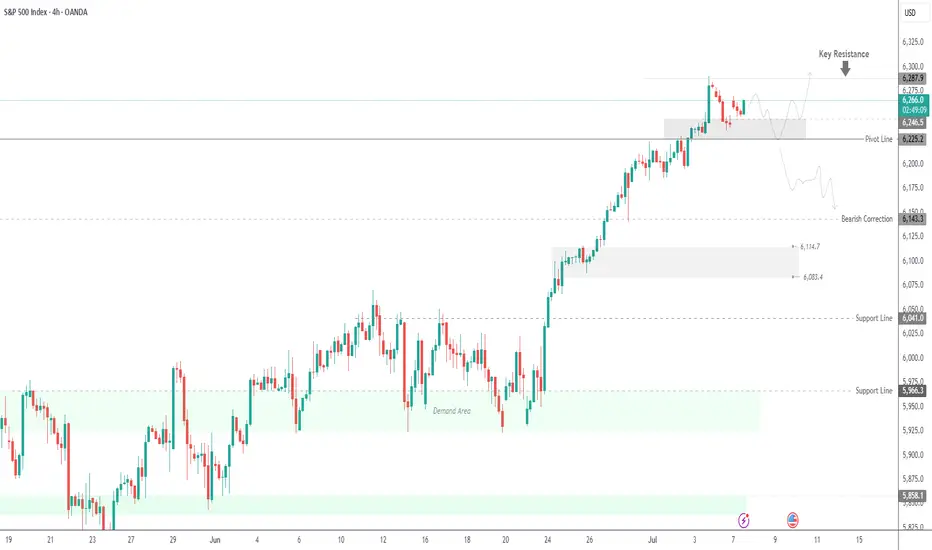
SPX500 Holding Bullish Structure – Eyes on 6287 BreakoutSPX500
The price maintains bullish momentum as long as it remains above 6225 and 6246.
Currently, the market is approaching the 6287 resistance level. A confirmed 4H candle close above 6287 is required to validate continuation of the bullish trend toward 6325.
However, a rejection from 6287 may trigger a short-term bearish correction, with potential pullbacks toward 6246 and 6225.
A sustained break below 6225 would shift the momentum to the downside, targeting the 6143 support level.
Pivot Level: 6264
Resistance: 6287 – 6325
Support: 6246 – 6225 – 6143