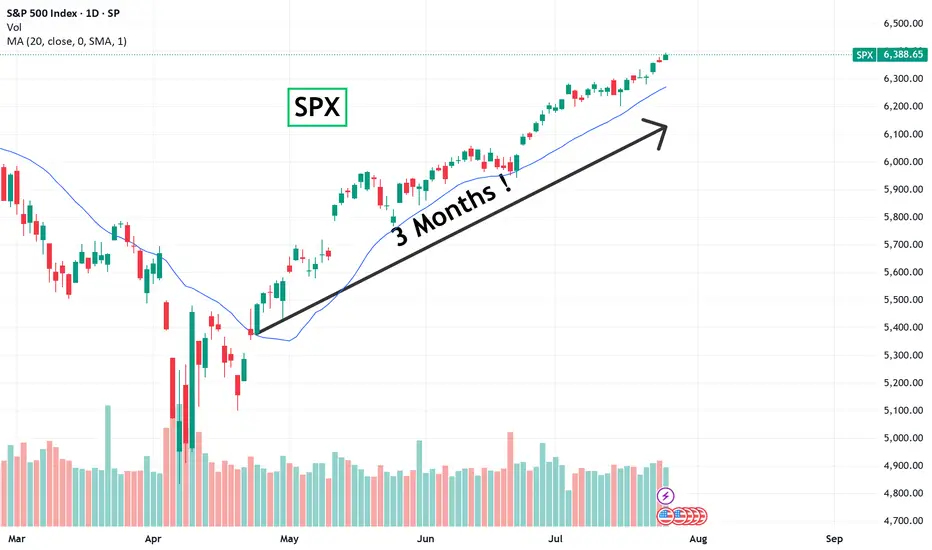
New All-Time Highs for S&P 500 – No Resistance AheadThe S&P 500 is officially in price discovery mode, printing new all-time highs with clean higher highs and higher lows.
Each old resistance flipped into strong support—textbook bullish market structure.
As long as this trend holds, there's no ceiling in sight. Bulls are fully in control.
SPX500 trade ideas

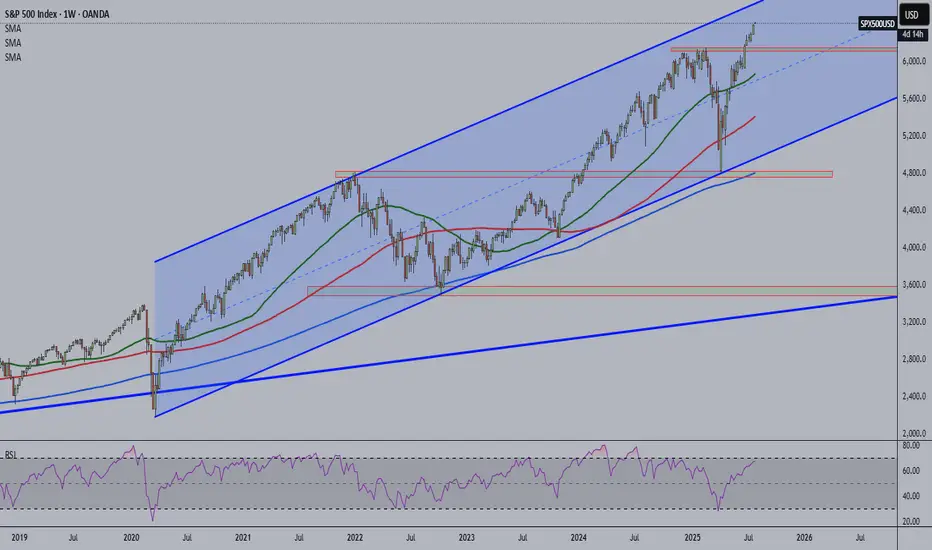
Overbought alert? The S&P500 is nearing weekly and monthly bullish channel resistance. Price has remained within this channel since 2020.
PEPPERSTONE:US500 VANTAGE:SP500
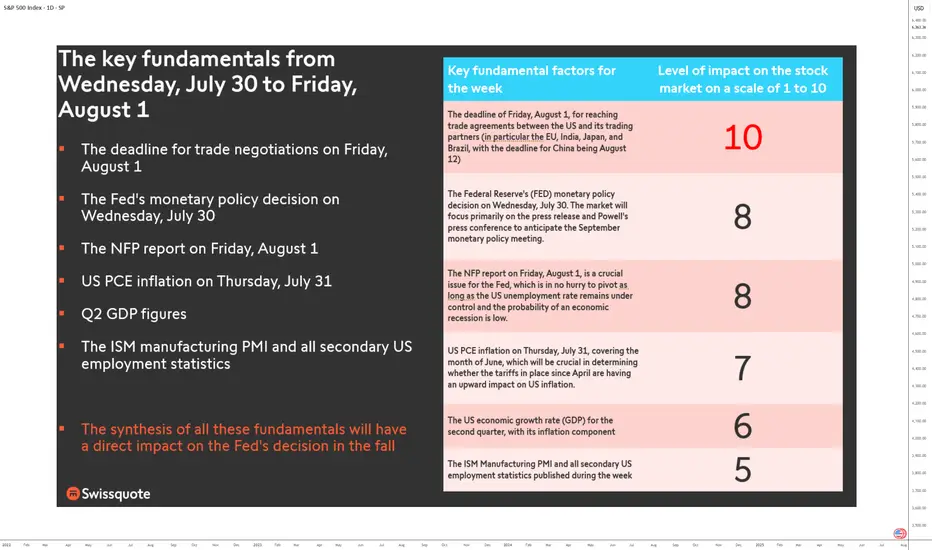
FUNDAMENTALS: THE WEEK OF TRUTH IS COMING!This is a high-stakes, high-pressure week for markets as the final days of July approach. Between Wednesday, July 30, and Friday, August 1, all the market-moving fundamentals are concentrated in a three-day window. It’s a stress test for the U.S. equity market: either it extends its bullish trend, or it enters a much-needed consolidation phase.
Three days. No more. Catalysts are so tightly packed they could shake even the steadiest traders. We’re looking at a full-spectrum stress test—monetary, economic, and geopolitical. Why so crucial? Because every major macro driver is converging in an ultra-condensed timeframe: the trade deal deadline with U.S. partners, the Fed’s policy decision, GAFAM earnings, PCE inflation, the NFP jobs report, Q2 GDP figures, and key technical barometers—all as we enter the seasonally weaker August-September period.
1) Wednesday, July 30 – The Monetary Moment of Truth
The week opens with a critical event: the Fed’s monetary policy meeting. It’s not just about rates, but forward guidance. The market stands at a crossroads. Either the Fed signals a dovish pivot for late 2025, and risk appetite returns—or it delays action, and the S&P 500, already stretched (Shiller PE Ratio back to end-2021 levels), enters a correction.
At the same time, GAFAM kick off their earnings season. U.S. tech remains the market’s beating heart. If these giants disappoint, the sector will drag down the entire market. Remember, tech accounts for 35% of the S&P 500’s weight.
2) Thursday, July 31 – PCE Inflation Decides the Direction
Next up is the Fed’s preferred inflation metric: core PCE. A critical indicator. If inflation ticks up, the autumn rate-cut narrative falls apart. Add in the second estimate of Q2 GDP and earnings from the next GAFAM batch, and Thursday becomes a pivotal day for the S&P 500. The key question: will core PCE inflation rebound, possibly influenced by tariff impacts?
3) Friday, August 1 – The Verdict: NFP and Trade Talks
NFP jobs report + trade negotiation deadline = explosive combo. By Friday, markets will have priced in the Fed, inflation, and earnings. What’s left? U.S. labor. Weak numbers could revive recession fears. Strong ones might push back the Fed’s easing timeline.
Also on the radar: trade talks. The August 1 deadline could spike volatility. And let’s not forget the China-specific deadline on Tuesday, August 12.
Conclusion: No Room for “TACO”
There’s no margin for error. No room for “TACO” (Trump Always Chickens Out). This market must deliver across the board—or the current overvaluation will be left with no safety net. The July 30 week is a true fundamental stress test. And the consequences will be swift.
DISCLAIMER:
This content is intended for individuals who are familiar with financial markets and instruments and is for information purposes only. The presented idea (including market commentary, market data and observations) is not a work product of any research department of Swissquote or its affiliates. This material is intended to highlight market action and does not constitute investment, legal or tax advice. If you are a retail investor or lack experience in trading complex financial products, it is advisable to seek professional advice from licensed advisor before making any financial decisions.
This content is not intended to manipulate the market or encourage any specific financial behavior.
Swissquote makes no representation or warranty as to the quality, completeness, accuracy, comprehensiveness or non-infringement of such content. The views expressed are those of the consultant and are provided for educational purposes only. Any information provided relating to a product or market should not be construed as recommending an investment strategy or transaction. Past performance is not a guarantee of future results.
Swissquote and its employees and representatives shall in no event be held liable for any damages or losses arising directly or indirectly from decisions made on the basis of this content.
The use of any third-party brands or trademarks is for information only and does not imply endorsement by Swissquote, or that the trademark owner has authorised Swissquote to promote its products or services.
Swissquote is the marketing brand for the activities of Swissquote Bank Ltd (Switzerland) regulated by FINMA, Swissquote Capital Markets Limited regulated by CySEC (Cyprus), Swissquote Bank Europe SA (Luxembourg) regulated by the CSSF, Swissquote Ltd (UK) regulated by the FCA, Swissquote Financial Services (Malta) Ltd regulated by the Malta Financial Services Authority, Swissquote MEA Ltd. (UAE) regulated by the Dubai Financial Services Authority, Swissquote Pte Ltd (Singapore) regulated by the Monetary Authority of Singapore, Swissquote Asia Limited (Hong Kong) licensed by the Hong Kong Securities and Futures Commission (SFC) and Swissquote South Africa (Pty) Ltd supervised by the FSCA.
Products and services of Swissquote are only intended for those permitted to receive them under local law.
All investments carry a degree of risk. The risk of loss in trading or holding financial instruments can be substantial. The value of financial instruments, including but not limited to stocks, bonds, cryptocurrencies, and other assets, can fluctuate both upwards and downwards. There is a significant risk of financial loss when buying, selling, holding, staking, or investing in these instruments. SQBE makes no recommendations regarding any specific investment, transaction, or the use of any particular investment strategy.
CFDs are complex instruments and come with a high risk of losing money rapidly due to leverage. The vast majority of retail client accounts suffer capital losses when trading in CFDs. You should consider whether you understand how CFDs work and whether you can afford to take the high risk of losing your money.
Digital Assets are unregulated in most countries and consumer protection rules may not apply. As highly volatile speculative investments, Digital Assets are not suitable for investors without a high-risk tolerance. Make sure you understand each Digital Asset before you trade.
Cryptocurrencies are not considered legal tender in some jurisdictions and are subject to regulatory uncertainties.
The use of Internet-based systems can involve high risks, including, but not limited to, fraud, cyber-attacks, network and communication failures, as well as identity theft and phishing attacks related to crypto-assets.
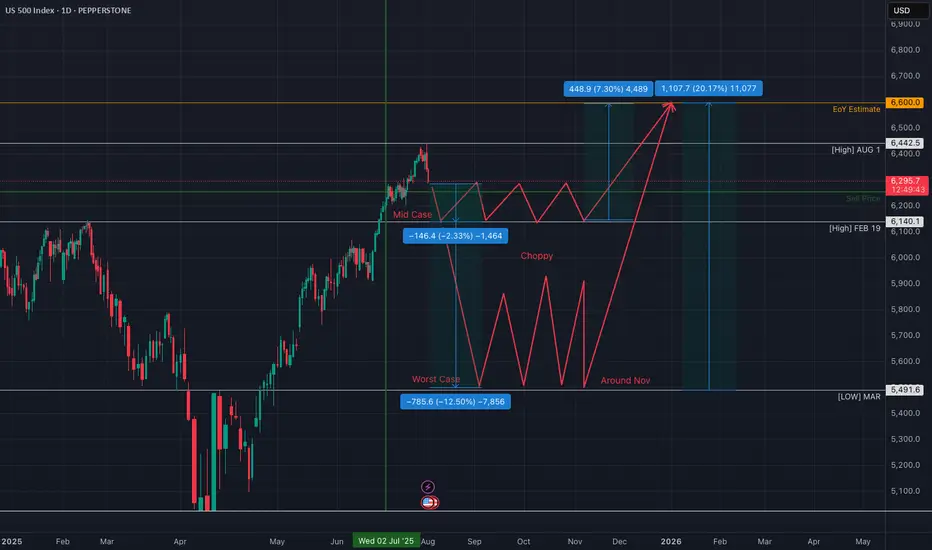
The Golden Age 7000 EOY SPXThe Golden Age (year) is here!
Have cash ready for May in April. Be heavy hedges going in to 26.
We're going to juice earnings with all the investments pouring in for just about every single industry. Once the injection is complete, we will reset while all the invested money completes projects.
GL!
Better Buy Bitcoin

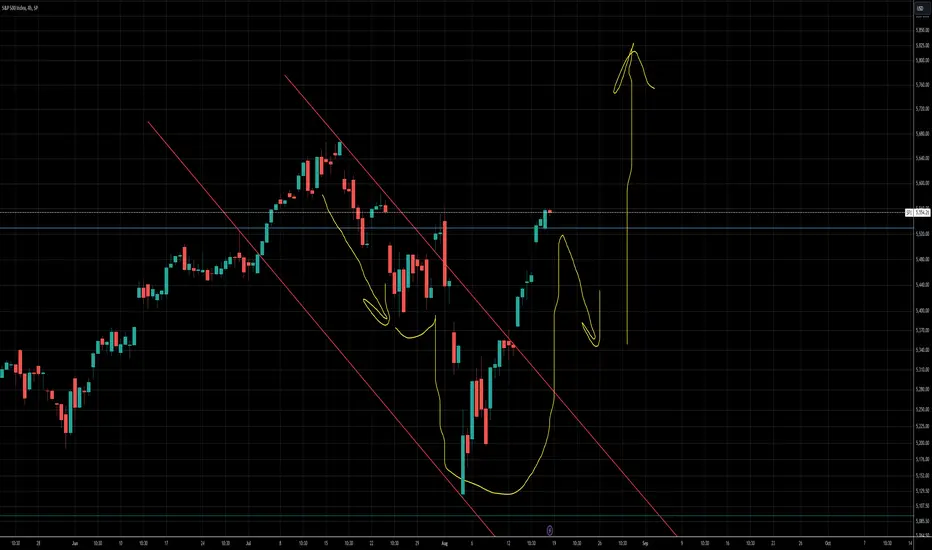
Is This the Start of a Market Drop?So, is the drop beginning? It kind of looks that way, but there’s still no solid setup for entering a short position — and there hasn’t been so far.
The trend is still upward for now, and this current pullback might just be temporary.
What I like about the short idea is that August is traditionally a weak month for stocks .
Could this be the start of a big correction on the market? Yes, it’s possible.
It’s just a pity there’s no clean setup for a short. I’d like to enter, but I’d prefer to see a bit more confirmation on the chart itself.
In general, trading the index off of chart setups isn’t easy — perfect entries are rare. That’s exactly the case now. I’m watching and wondering how and when to catch the downside. Maybe I’ll end up sitting through the entire drop without a position :)
Overall, I’m in favor of the short — but for now, I just don’t see a clear entry point.
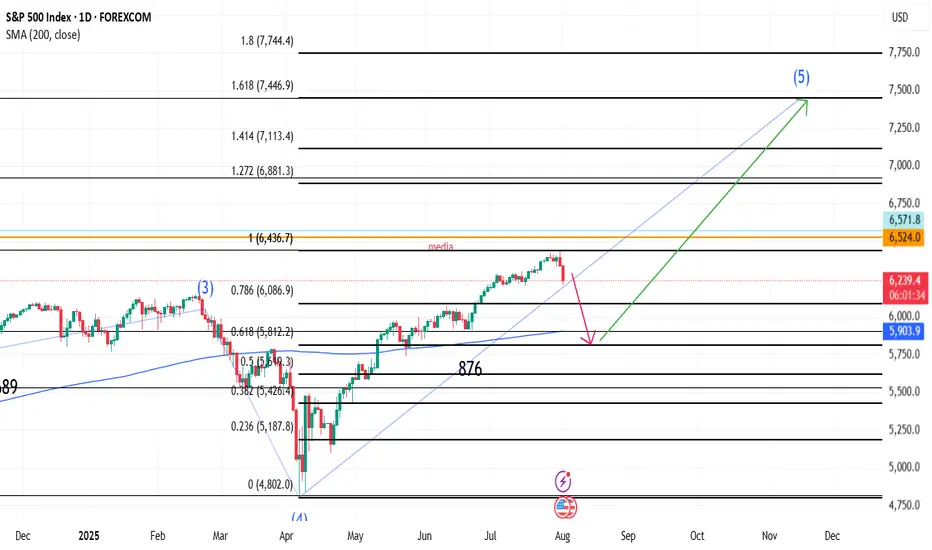
SPX correction to 5800 then 7445In my view current correction could stop in 5800 area where bullish trend could resume to target 7445 area in November
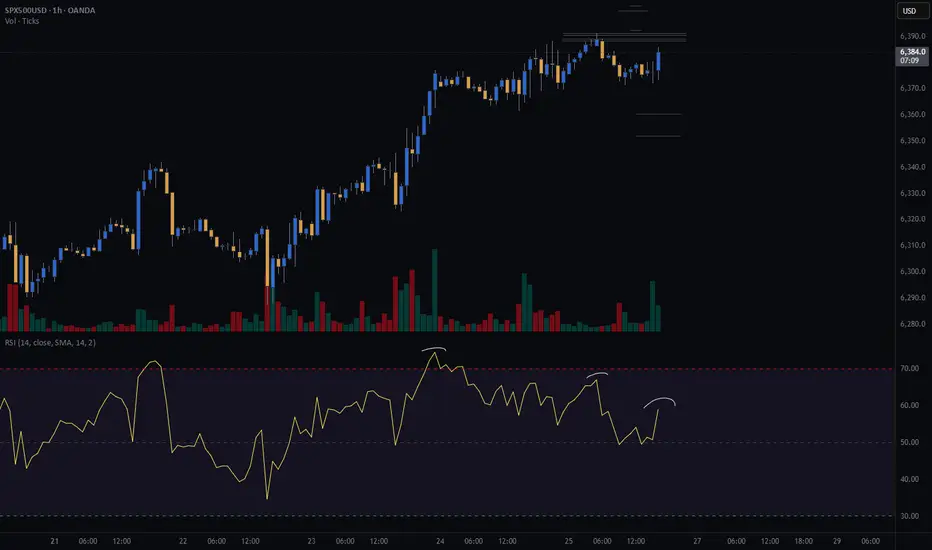
SPX500USD | Bulls Lose Steam at 6,424.5 ResistanceThe S&P 500 Index showed strong bullish momentum but is now pulling back after tagging resistance at 6,424.5. Price is currently hovering near 6,374.6, where previous structure may act as support.
Support at: 6,374.6 / 6,340.0 🔽
Resistance at: 6,424.5 🔼
🔎 Bias:
🔼 Bullish: Bounce from 6,374.6 and reclaim of 6,424.5 signals continuation.
🔽 Bearish: Break below 6,374.6 exposes 6,340.0 and lower zones.
📛 Disclaimer: This is not financial advice. Trade at your own risk.

Cup and handleTarget 1 is 5800, calculated from taking the height of the cup and handle structure divided by 2, added to the top of the handle inflection point.
SPX500 - Bearish Crab Pattern- Price completed a perfect Crab Pattern, yet we all got to August 1st (second) liberation day
- If bad mood continues, we can expect a correction:
A. (positive) down to 6150-6000
B. (negative) down to 5800
Just my humble opinion
S&P500 for the rest of 2026I am not a professional and this is based on nothing more than blind speculation and feelings.
Probably wrong
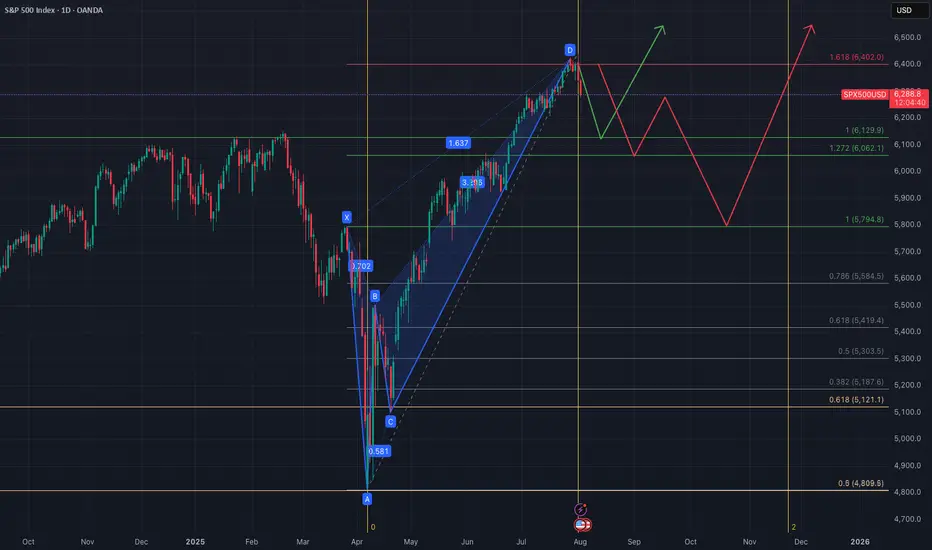
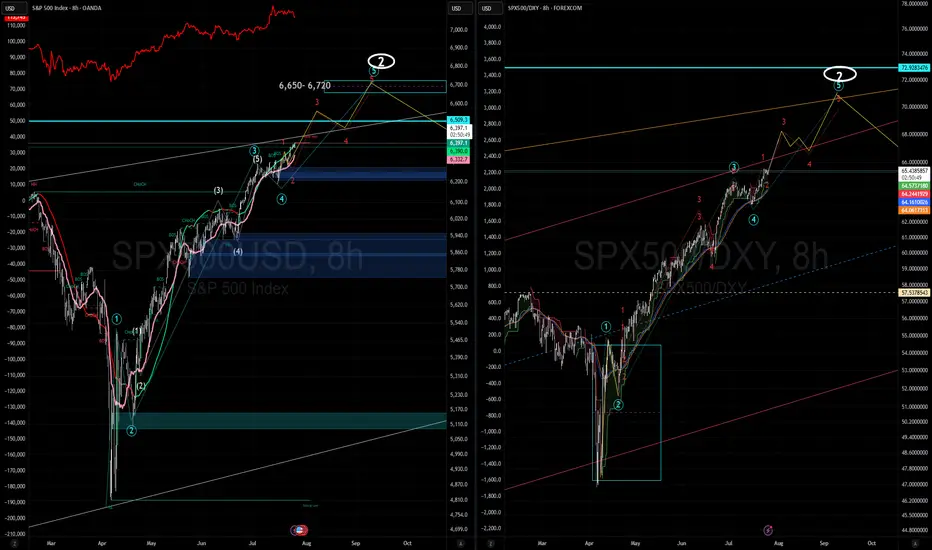
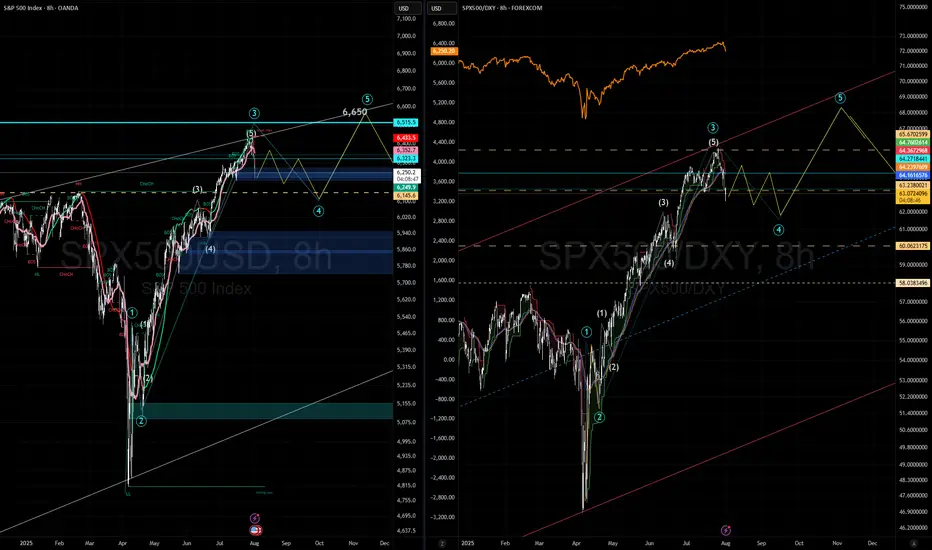
SPX More upside potentialI've revised my previous count based on recent price action. I now see a potential minor Wave 4 (of Intermediate Wave 5) forming around the 6,500 level. This could present a reasonable opportunity to take some % profits, (for the cautious or short term traders) though I recommend being prepared to re-enter, as I still believe we are ultimately headed toward the 6,650–6,720 range before a larger-scale correction sets in.
Taking some profits around 6,500 may be a prudent move, or alternatively, you can continue holding while adjusting your trailing stops accordingly.
Generally and in most cases its best to exhaust you bullish counts in Elliot .
On the right hand side i am showing SPX/ DXY which is typically a more accurate and discernable wave pattern then the SPX alone. FYI
HOW TO TRADE THE TREND WITH THE 8-STAGE "MARKET TREND MODEL"How to TRADE THE TREND ,
and decide WHEN TO GO LONG OR SHORT ,
using 8-STAGE MARKET LIFECYCLE ROADMAP
This way you will INCREASE YOUR WIN RATE ,
avoid getting stopped out by BEING COMPLETELY AGAINST THE MARKET ,
while seeing BIG MISSED MARKET OPPORTUNITIES
The Methodology is:
1. Simple & Systematic - so it is easy to learn
2. Works across all Markets
3. Works across all Timeframes
4. Can be combined with existing methodologies..

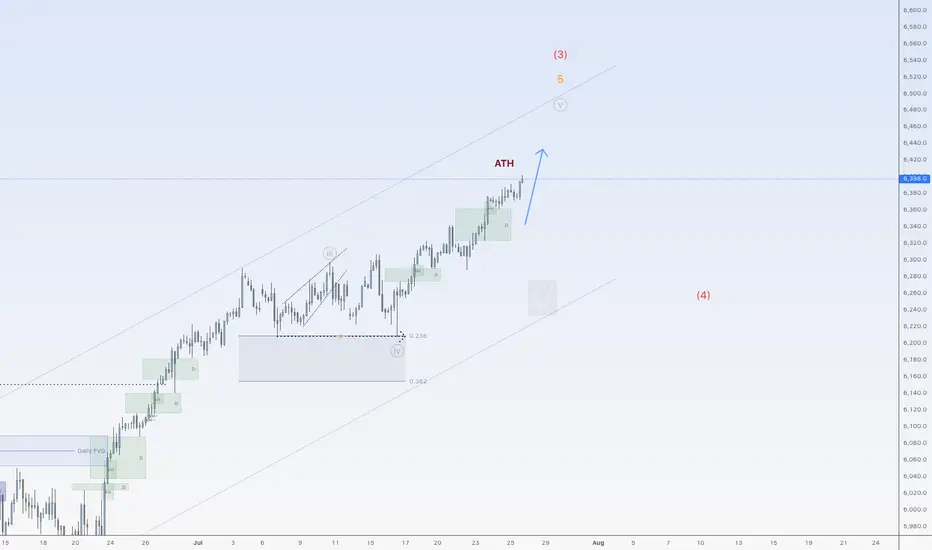
SPX range bound unit September expirationExpect sideways wave 4 to last 4 weeks, volatility, (small positions: sell up, buy dips or do NPOTHING and hold. Basically these types of Wave-4 are where traders loose money from Wave-3.
SPX ShortElite Analysis
Trade took previous high.
Market gave me a 30m BOS
Identified internal LP
Received confirmation on the 10m and 1m.
Executed off the 1m.
Targets lower LP's

29-07-2025This chart contains my analysis and key observations for today's trading session. All drawings and indicators reflect my current view of the market as of today. The purpose of this publication is to keep a record of my analysis and review it later for learning and improvement. No investment advice is provided.

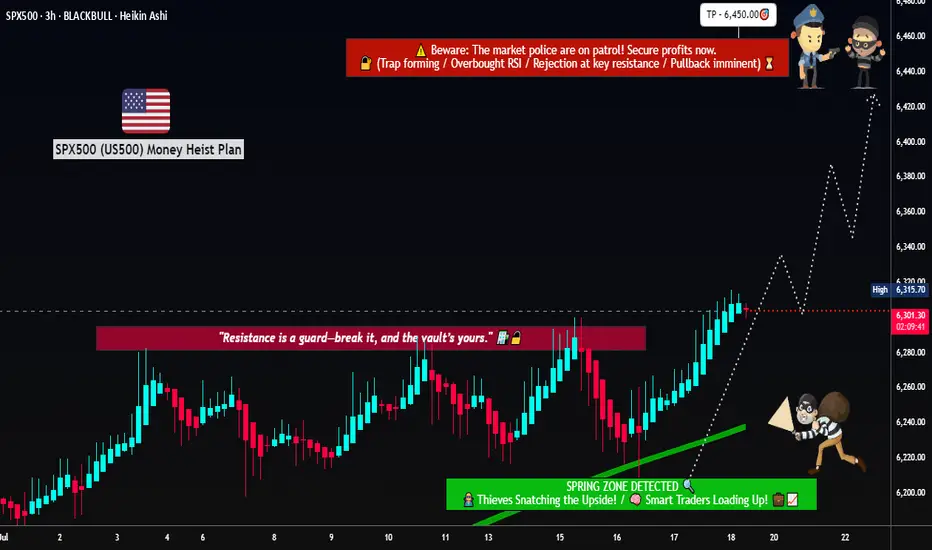
Rob the Rally SPX500: Enter Before Resistance Catches You🦹♂️💰**“SPX500 Street Heist” – Thief-Style Robbery Plan for Bulls!**📈💸
(Powered by Thief Trader's Market Robbing Tactics – Scalp | Swing | Day Trade Edition)
🌍Hello, Global Money Hunters!
📣 Salaam, Bonjour, Ola, Hola, Hallo, Marhaba & Welcome to the heist floor! 🎩💼
Thief Trader is back again with a loaded plan to rob the market clean — this time targeting the mighty SPX500 / US500 🎯. Based on a fusion of technical setups, macro sentiment, and the Thief Trading System, we’ve set our sights on the next breakout vault of Wall Street.
🎯 The Gameplan – Heist the Resistance Vault
The index is entering a high-risk resistance barricade — overbought, consolidated, and heavily guarded by bearish robbers (sellers). This is the zone where the market police lurk and trend reversals often get triggered. However, smart thieves always plan with precision.
Here’s the mission briefing:
🔓Entry Zone (Break-in Point)
💥 “The vault is open — grab the bullish loot!”
Enter Long anywhere close to market price or on pullbacks near recent swing lows/highs.
Preferred timeframes: 15-min to 30-min for sniper-level accuracy.
Deploy DCA-style limit orders (layered entries for maximum control).
🛑Stop Loss (Escape Hatch)
Base SL on recent swing low candle wicks on the 4H timeframe.
Suggested: ~6250.00 — but adapt based on your risk appetite, lot size, and position stacking.
📈Target / Loot Location
🎯 Primary Take-Profit: 6450.00
Or… pull out early if you spot resistance fighters guarding the vault.
Use trailing SL to secure gains and manage getaway.
⚡Scalper’s Notice
Only Long-side allowed!
Got big capital? Jump in now.
Running low? Tag along with swing traders and follow the robbery protocol.
Always protect your bag with dynamic trailing stops.
🧠Fundamental Fuel Behind the Plan
Bullish sentiment across major indices
Macro trends, COT positioning, sentiment outlook, and intermarket analysis all greenlit
Geopolitical and Fed tone supportive — tap into real data before entering
👉 Always analyze: News, Fundamentals, Sentiment, COT reports, and macro conditions.
🚨NEWS ZONE ALERT – No Loud Moves!
Avoid entry during major economic news drops
Use trailing SLs to guard profits
Don’t let your open trades get caught in the chaos of news releases!
💥Let’s Boost the Thief Army!
Smash the BOOST button 💖 to power up the robbery crew.
Support the strategy, share the love, and stay ahead of the game using Thief Trading Style. Every trade is a step closer to freedom from financial traps. 🚀💰🎉
📌Disclaimer: This is a general market analysis for educational purposes and should not be considered personal financial advice. Please evaluate your own risk management strategy before placing trades.
📌Markets shift fast — stay flexible, stay alert, and always rob smart.
🔥Stay locked in for the next heist plan — Thief Trader signing off for now…
💸💼📈 Trade smart. Rob harder. 🤑🦹♂️📊
S&P 500 Counter-Trend Setup After Bullish Week US500Currently watching the S&P 500 (US500) closely 👀. The index has been in a strong bullish trend 📈, but I’m now evaluating a potential counter-trend opportunity.
Given the strength we’ve seen this week — possibly a “foolish rally” — there’s a chance we’ve either printed or are close to printing the high of the week 🧱. That opens the door for a retracement setup, particularly as we head into Monday’s open 🗓️.
🧠 Trade idea: If we get a bearish market structure break, I’ll be looking to enter short — targeting a 1R take profit initially, and holding a portion for a 2R–3R extension 🎯.
Friday sessions, especially after strong trends, often present clean intraday pullbacks — and when Monday’s low is set early, it can trap late buyers and fuel the move 📉.
⚠️ This is not financial advice — just sharing my thought process and trade plan.

SPX500USD is on a riseHi traders,
Last week SPX500USD started the next impulse wave 5 (grey) as I've said in my outlook.
Next week we could see more upside for this pair.
Let's see what the market does and react.
Trade idea: Wait for a small pullback and a change in orderflow to bullish on a lower timeframe to trade longs.
NOTE: the next three weeks I'm on holiday so I will not post any outlook publicly.
If you want to learn more about trading FVG's & liquidity sweeps with Wave analysis, then please make sure to follow me.
This shared post is only my point of view on what could be the next move in this pair based on my technical analysis.
Don't be emotional, just trade your plan!
Eduwave
S&P 500 (CASH500) - Double Top H1Risk/reward = 2.7
Entry price = 6388.4
Stop loss price = 6399.7
Take profit level 1 (50%) = 6360.4
Take profit level 2 (50%) = 6352
Also, waiting on confirmation on some variables
SPX 0DTE TRADE IDEA – JULY 25, 2025
⚠️ SPX 0DTE TRADE IDEA – JULY 25, 2025 ⚠️
🔻 Bearish Bias with Weak Volume – Max Pain Looming at 6325
⸻
📊 Quick Market Snapshot:
• 💥 Price below VWAP
• 🧊 Weak Volume
• 📉 Max Pain @ 6325 = downside pressure
• ⚖️ Mixed Options Flow = no clear bullish conviction
⸻
🤖 Model Breakdown:
• Grok/xAI: ❌ No trade – weak momentum
• Claude/Anthropic: ✅ Bearish lean, favors PUTS near highs
• Gemini: 🟡 Slightly bullish bias, BUT agrees on caution
• Llama: ⚪ Neutral → No action
• DeepSeek: ❌ Bearish → No trade
⸻
📌 TRADE IDEA:
🎯 SPX 6365 PUT (0DTE)
💵 Entry Price: $0.90
🎯 Profit Target: $1.80 (💥 2x return)
🛑 Stop Loss: $0.45
📆 Expires: Today
🕒 Exit by: 3:45 PM
📈 Confidence: 65%
⏰ Entry Timing: OPEN
⸻
⚠️ Risk Flags:
• Low volume = fragile conviction
• Possible reversal if SPX breaks above session highs
• Max pain magnet at 6325 could limit gains or induce a bounce
⸻
🧠 Strategy:
Scalp it quick. Get in early. Exit before the gamma games explode into close.
📈 Like this setup? Drop a 🔽 if you’re playing puts today!
#SPX #0DTE #PutOptions #OptionsTrading #MaxPain #SPY #MarketGamma #TradingSetup

SellRejection Level
Daily Volume
Market Structure Shift
London US Session
Trend Line Break
Untapped Order Point

Can the S&P 500's Ascent Continue?The S&P 500 recently achieved unprecedented highs, reflecting a multifaceted market surge. This remarkable performance stems primarily from a robust corporate earnings season. A significant majority of S&P 500 companies surpassed earnings expectations, indicating strong underlying financial health. The Communication Services and Information Technology sectors, in particular, demonstrated impressive growth, reinforcing investor confidence in the broader market's strength.
Geopolitical and geostrategic developments have also played a crucial role in bolstering market sentiment. Recent "massive" trade agreements, notably with Japan and a framework deal with Indonesia, have introduced greater predictability and positive economic exchanges. These deals, characterized by reciprocal tariffs and substantial investment commitments, have eased global trade tensions and fostered a more stable international economic environment, directly contributing to market optimism. Ongoing progress in trade discussions with the European Union further supports this positive trend.
Furthermore, resilient macroeconomic indicators underscore the market's upward trajectory. Despite a recent dip in existing home sales, key data points like stable interest rates, decreasing unemployment claims, and a rising manufacturing PMI collectively suggest an enduring economic strength. While technology and high-tech sectors, driven by AI advancements and strong earnings from industry leaders like Alphabet, remain primary growth engines, some segments, such as auto-related chipmakers, face challenges.
The S&P 500's climb is a testament to the powerful confluence of strong corporate performance, favorable geopolitical shifts, and a resilient economic backdrop. While the immediate rally wasn't directly driven by recent cybersecurity events, scientific breakthroughs, or patent analyses, these factors remain critical for long-term market stability and innovation. Investors continue to monitor these evolving dynamics to gauge the sustainability of the current market momentum.
