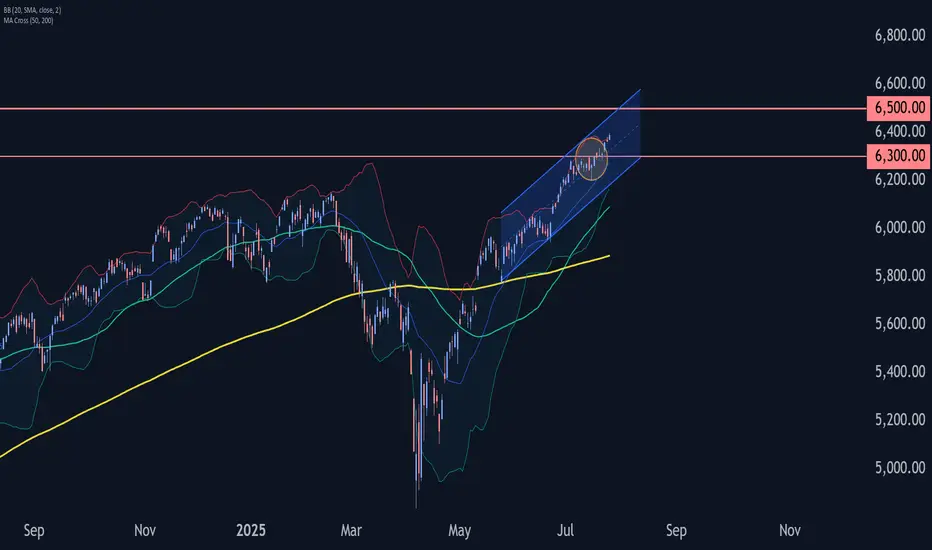
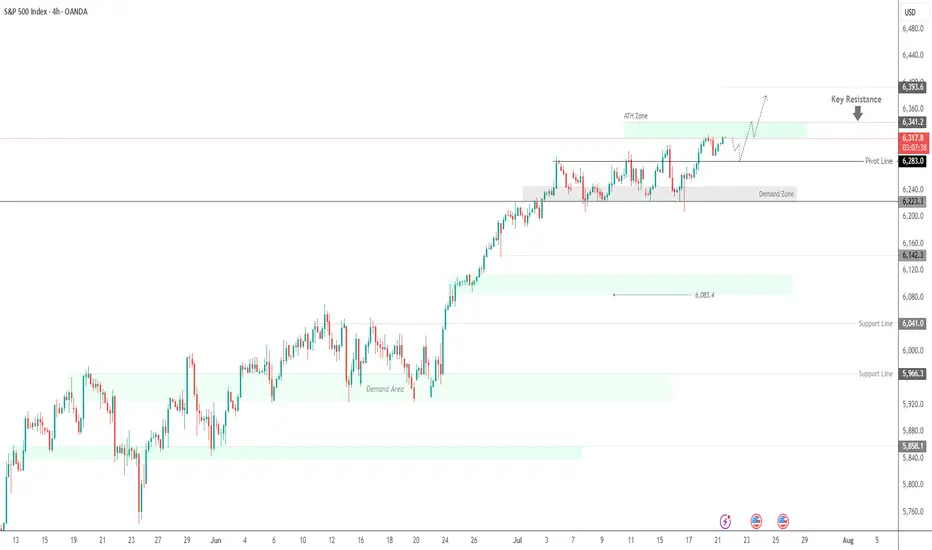
S&P 500 Index Wave Analysis – 25 July 2025
- S&P 500 Index broke key resistance level 6300.00
- Likely to rise to resistance level 6500.00
S&P 500 Index recently broke the key resistance level 6300.00 (which stopped the previous waves 5 and (B), as can be seen below).
The breakout of the resistance level 6300.00 continues the active intermediate impulse wave (5) from the middle of this month.
Given the strong daily uptrend, S&P 500 Index can be expected to rise to the next resistance level 6500.00 (coinciding with the daily up channel from May).
SPX500 trade ideas
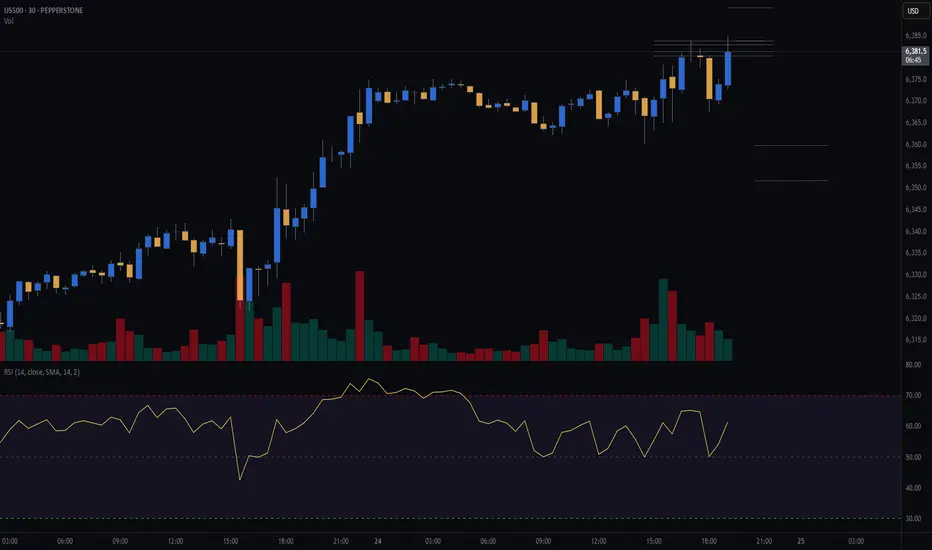
S&P500 (CASH500) SHORT - head and shoulders 30minRisk/reward = 4.1
Entry price = 6378
Stop loss price = 6385.9
Take profit level 1 (50%) = 6349.2
Take profit level 2 (50%) = 6337.2
Still waiting on confirmation of a few variables at close of this 30min candle at 17.00
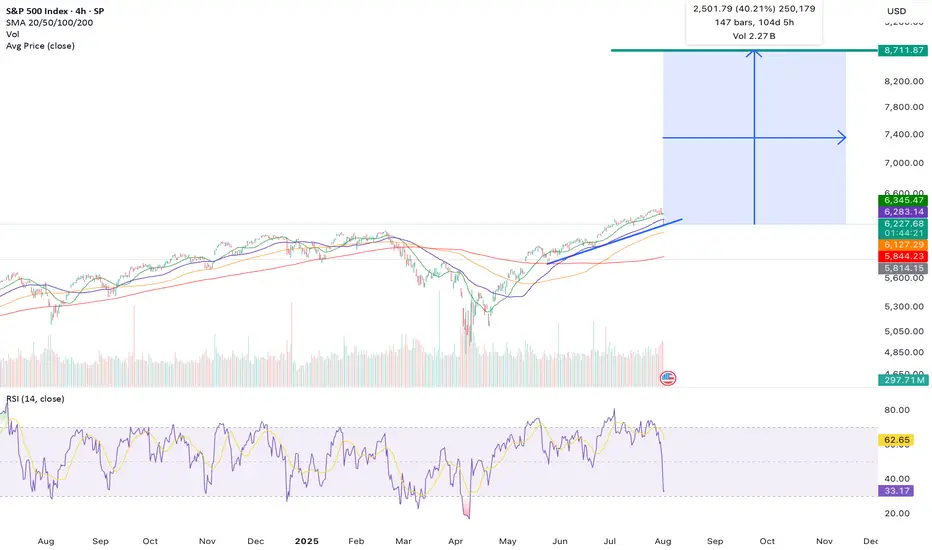
The Low Is In: Why the S&P 500 Just Confirmed a Bullish Reversal🔥 The Low Is In: Why the S&P 500 Just Confirmed a Major Bullish Reversal 🔥
The market just gave us a gift.
After weeks of drifting lower and sentiment turning cautious, the S&P 500 has touched — and bounced — off a critical rising trendline for the third time since May 2025. That third touch isn't just a technical coincidence… it's often the launchpad for a new impulsive leg higher.
📈 The Power of the 3rd Touch: Trendline Validation Complete
Look at the chart. This isn’t guesswork. Since May, the S&P 500 has been respecting a well-defined ascending trendline, one that connects multiple higher lows during this bull run.
The first touch was the May liftoff after the April consolidation.
The second came in June — a clean retest and bounce.
Now, as of early August, the third touch has held once again, exactly where the bulls needed it most.
This isn’t a random line on a chart. This is institutional flow stepping in to defend structure.
And when a rising trendline holds for a third time after a strong uptrend? That’s a classic continuation signal.
📉 RSI Washout + Structural Support = Perfect Storm for a Bottom
The RSI printed a dramatic dip to ~32, a level that screams “oversold” on the 4-hour timeframe. But notice the context — it happened right at structural support.
This is not weakness. This is accumulation.
Big players shake out weak hands on low timeframes… right before they send it.
🧠 Sentiment Is Offside… Again
Let’s not forget: this retrace came after a huge run-up since March. People expected a deeper correction. Bears started getting loud again.
That’s how bull markets trap you — by convincing you it’s over right before the next leg higher.
And with macro tailwinds (liquidity expansion, fiscal spend, tariff rollbacks), earnings season beats, and global capital rotation into U.S. equities, this setup is ripe for a violent upside squeeze.
🚀 8,700 in Sight: My End-of-Year Price Target Is Very Much in Play
Today’s close around 6,220 means the S&P 500 would need to rally ~40% to hit my target of 8,700 by year-end.
Sounds crazy? Not if you’ve seen what happens during parabolic melt-ups.
This isn’t just hope:
📊 Strong breadth under the surface
🏛️ Dovish policy pivot now expected in Q4
💸 Retail and institutional capital both re-engaging
📉 Bond yields are starting to roll over, supporting equity valuations
When bull markets enter their euphoria phase, they don’t stop at “reasonable” targets. They blast through them.
💡 The Setup Is Textbook — Now It’s About Execution
✅ Trendline defended
✅ RSI reset
✅ Sentiment shaken out
✅ Structure intact
The technicals just aligned with the macro. The low is in — and the runway to 8,700 is wide open.
Strap in. Q4 could be one for the history books.
US500 - Can S&P Pass Critical Ratio / Liquidity ZoneS&P (Pepperstone CFD)
Price has popped above the 1.618 extension, which is a key ratio zone.
A bearish whipsaw in this area could be dangerous.
However, if price continues to push through this level, it signals that S&P is entering a very bullish phase.
The area above prior ATH resistance holds high liquidity.
If price moves beyond this ratio band, it will signal that a reversal in this zone is unlikely.
That said, if it’s still in this band when Trump tariffs are reinstated potentially on 1 August, then this is looking dangerous 🧐.
(Fib trendlines lower in the chart).
This analysis is shared for educational purposes only and does not constitute financial advice. Please conduct your own research before making any trading decisions.

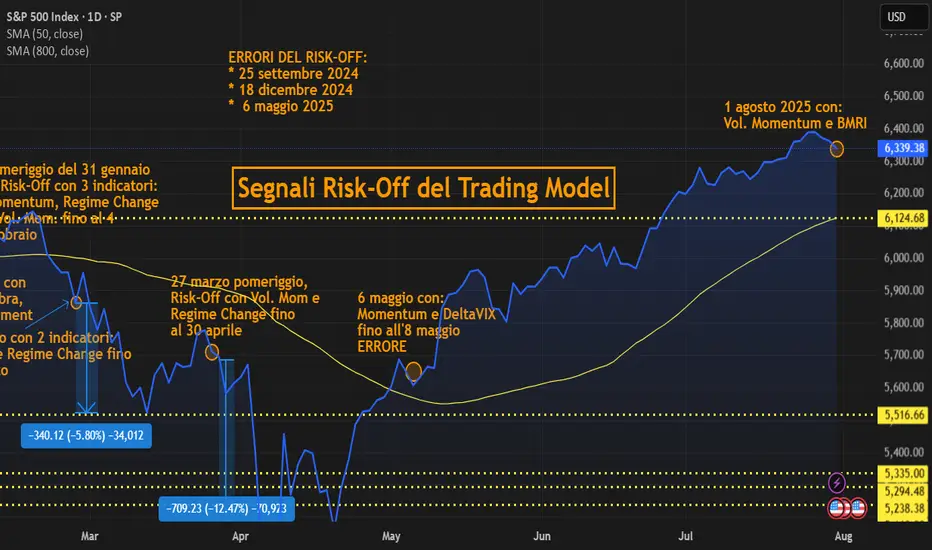
Bearish Engulfing on Risk. Average quarterly downside since 2023 open is 4.07%. Is a retest of near the yearly open on order over the month of August? Markets are no longer pricing in a Fed rate cut in September. Will that be the near term bearish fuel?
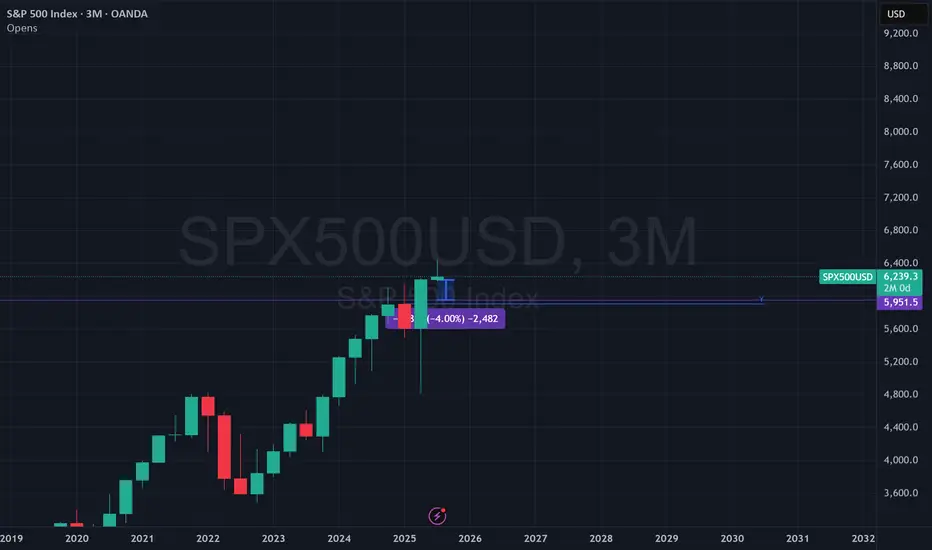
Risk-Off SignalsRisk-Off: 1 August with 2 indicators:
Voil. Momentum and Bear Market Risk Indicators (BMRI)
S&P Market Update – Signs of a Short-Term Correction?Although the S&P remains in an uptrend, recent price action suggests that momentum may be fading.
📉 Key Observations:
A Key Day Reversal occurred at 6409 – a potential warning signal.
We're seeing RSI divergence: price made a new high, but RSI didn’t follow suit.
The market is grinding higher, but without conviction.
📊 What to Watch:
The 15-day EMA, currently at 6317, is acting as near-term support. A close below this level could trigger a short-term correction.
Initial downside targets: 6147–6100, the previous highs from late 2024 and early 2025.
✅ To negate this bearish bias, the market would need to break above 6409 and continue higher with stronger momentum.
Stay alert — the technicals are flashing red flags. Always manage risk accordingly.
Disclaimer:
The information posted on Trading View is for informative purposes and is not intended to constitute advice in any form, including but not limited to investment, accounting, tax, legal or regulatory advice. The information therefore has no regard to the specific investment objectives, financial situation or particular needs of any specific recipient. Opinions expressed are our current opinions as of the date appearing on Trading View only. All illustrations, forecasts or hypothetical data are for illustrative purposes only. The Society of Technical Analysts Ltd does not make representation that the information provided is appropriate for use in all jurisdictions or by all Investors or other potential Investors. Parties are therefore responsible for compliance with applicable local laws and regulations. The Society of Technical Analysts will not be held liable for any loss or damage resulting directly or indirectly from the use of any information on this site.

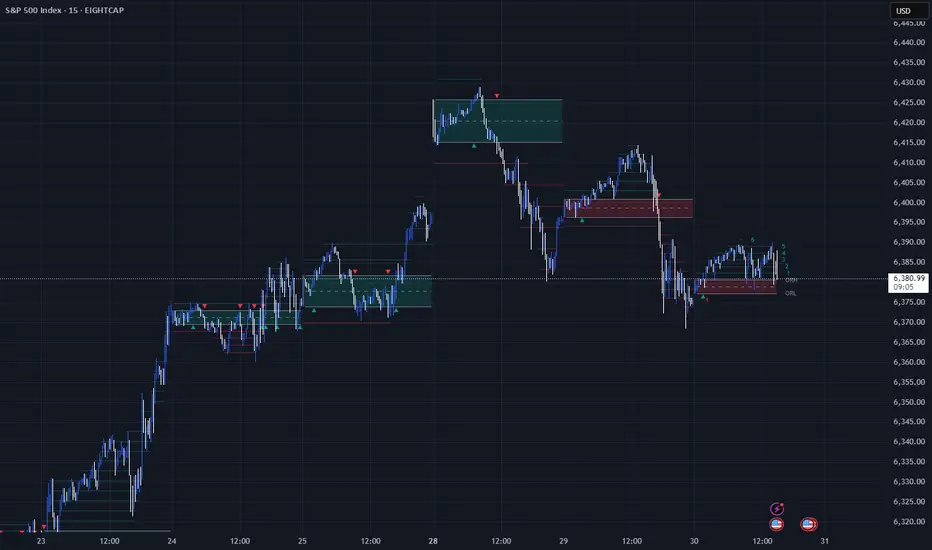
Unlocking the Power of ORB (Opening Range Breakout)Unlocking the Power of ORB (Opening Range Breakout): A Proven Strategy for Intraday Traders
In the fast-paced world of intraday trading, simplicity and structure can often outperform complexity. One such time-tested strategy is the Opening Range Breakout (ORB) — a method favored by both discretionary and system traders for its clarity and adaptability.
📌 What is ORB (Opening Range Breakout)?
ORB refers to the price range (high and low) formed during the first few minutes (typically 5, 15, or 30) after the market opens. Traders look for a breakout above or below this range, anticipating strong momentum in that direction.
🧠 Why ORB Works
Volume Surge: The opening minutes see high institutional activity, creating genuine demand/supply signals.
Market Psychology: ORB captures trader sentiment as news digests overnight and is priced in at the open.
Defined Risk: The high/low of the range becomes a natural stop-loss area, allowing clean setups.
✅ Entry and Exit Rules for the ORB Strategy
Having a consistent framework helps you avoid emotional decisions. Here’s how you can structure your trades using ORB:
🔹 Entry Criteria:
Timeframe: Define your ORB window — e.g., first 15-minute candle.
Bullish Breakout Entry:
Enter long when price closes above the ORB high with volume confirmation.
Bearish Breakdown Entry:
Enter short when price closes below the ORB low with volume confirmation.
⚠️ Avoid entering on the first breakout candle. Wait for a close and retest, or a strong momentum candle for higher confidence.
🔹 Stop-Loss Placement:
For Long Trades: Place SL just below ORB low
For Short Trades: Place SL just above ORB high
🔹 Target/Exit Options:
Fixed RR Target: Aim for 1.5–2x your risk as initial target.
Mid/Outer Bands: Use indicator-drawn breakout bands (like those in LuxAlgo script) as profit zones.
Time-based Exit: Close position by end of session if price stalls or consolidates.
Trailing Exit: Trail your stop behind higher lows (long) or lower highs (short) after breakout.
📊 ORB in Action
You can explore this ready-to-use TradingView indicator to visualize ORB levels in real-time:
🔍 Indicator: Opening Range with Breakouts & Targets (by @LuxAlgo) Thanks to @LuxAlgo team to make this indicator available.
🛠️ Highlights:
Automatically marks the opening range
Plots breakout zones and targets
Ideal for intraday strategies
Works across indices, forex, and crypto
📓 Integrating ORB into Your Trading Journal App
If you're journaling ORB trades, consider logging:
✅ Symbol & timeframe
✅ ORB range (high/low)
✅ Breakout direction (long/short)
✅ Entry time & price
✅ Exit reason (target hit, SL hit, time-based exit)
✅ Notes: market sentiment, news drivers, volume confirmation
Over time, this data will help you:
🔍 Identify which assets respect ORB best
📈 Tune your RR ratio and stop placements
🧠 Reduce decision fatigue by automating setups
🧪 Want to Automate It?
Our trading journal app is ready with 🧠 AI-based journaling for feedback and refinement
🎯 Final Thoughts
ORB is a classic — not because it’s flashy, but because it offers structure, risk control, and repeatability. Whether you're a price action purist or using smart indicators, ORB can provide a disciplined edge — especially when integrated into a journaling and feedback loop.
📌 Start small. Track results. Tune your edge.
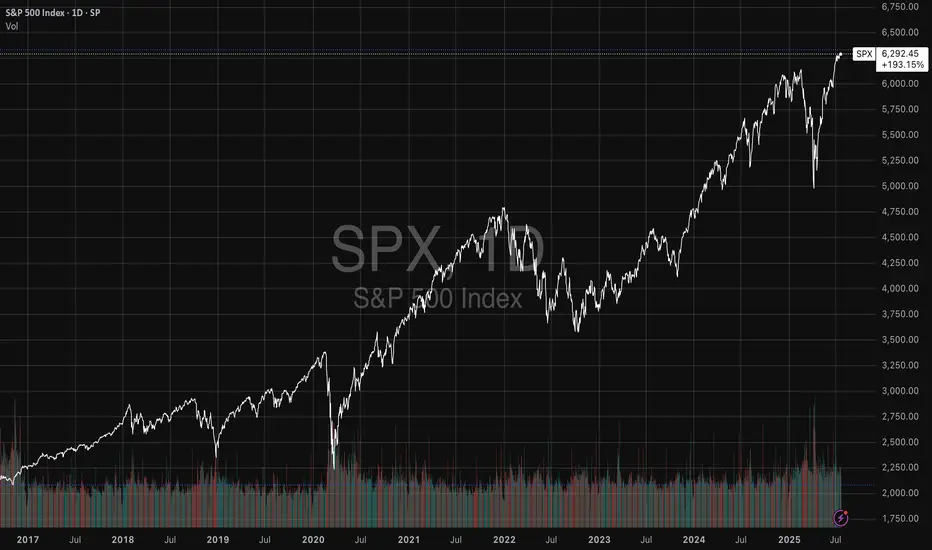
Before the perma-bulls go bonkers… Before the perma-bulls go bonkers… no, I’m not calling for a crash or bear market (yet).
But longer this bull runs, greater the odds of mean reversion.
Further we drift from 2009 without tagging the 300-month MA, more likely a sideways decade begins.
This will happen again.
You can't say we are "early" in the bull market. That simply is not true. Early is in the few years after the 2009 retouch of that very long term moving average. Can the indices still go up? Of course. But understand where you are in the cycle.

SPX500 Near ATH | Earnings Week Could Fuel Next MoveSPX500 | Weekly Outlook
The S&P 500 continues its bullish run, trading at record highs as investors await a critical week of tech earnings. Reports from Alphabet and Tesla could be key in justifying the lofty valuations driven by the AI boom.
Technical Outlook:
The price is expected to consolidate between 6341 and 6283 before any decisive move. A short-term bearish correction may occur initially, but if the price holds above the support zone, a push toward a new ATH at 6341 is likely. A breakout above this level could extend gains toward 6375 and 6393.
However, a break below 6283 would indicate weakness, potentially driving the price toward the demand zone near 6250 and 6224.
Support: 6283 · 6250 · 6224
Resistance: 6341 · 6375 · 6393
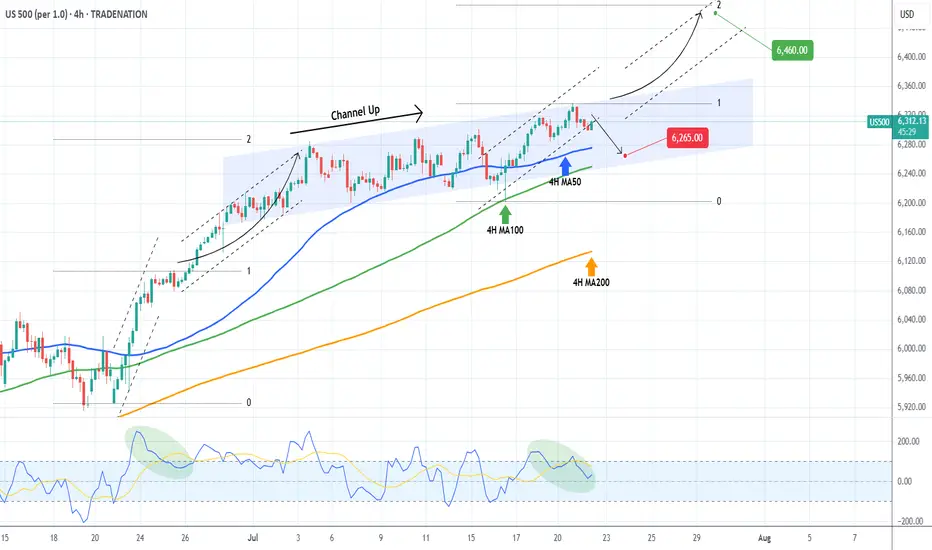
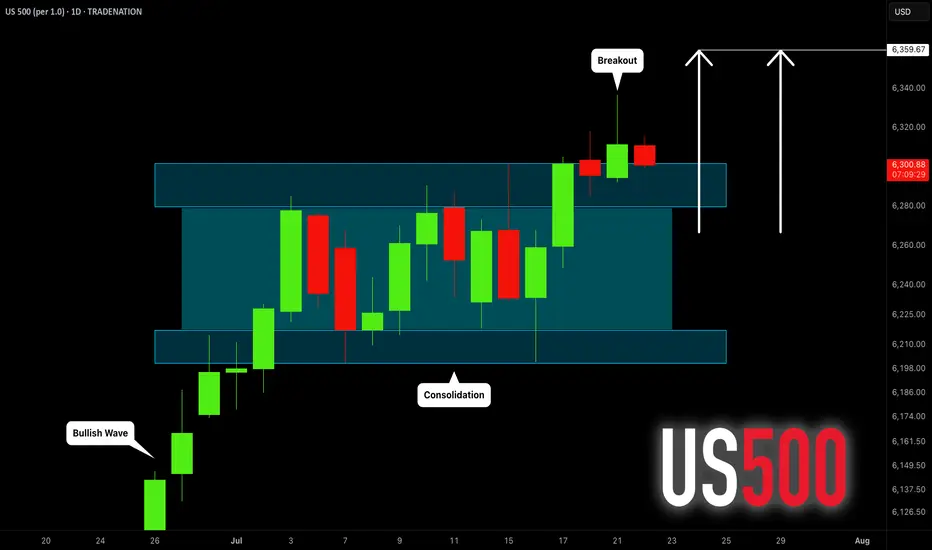
S&P500 Critical short-term crossroads.The S&P500 index (SPX) has been trading within a Channel Up since for the entirety of July and right now is ahead of important crossroads. It either breaks out above the pattern or pulls back to price a new Higher Low.
Based on the 4H CCI and the similarities with the June 24 - 25 consolidation, there are higher probabilities to break upwards. That fractal reached the 2.0 Fibonacci extension after it broke out. We will wait for confirmation and if it's delivered, we will buy the break-out and target 6460 (just below Fib 2.0 ext).
Until then, being so close to the Channel Up top, makes a solid short opportunity targeting a Higher Low (bottom). The previous one was priced exactly on the 4H MA100 (green trend-line) so that's our target or 6250 if it comes earlier.
-------------------------------------------------------------------------------
** Please LIKE 👍, FOLLOW ✅, SHARE 🙌 and COMMENT ✍ if you enjoy this idea! Also share your ideas and charts in the comments section below! This is best way to keep it relevant, support us, keep the content here free and allow the idea to reach as many people as possible. **
-------------------------------------------------------------------------------
Disclosure: I am part of Trade Nation's Influencer program and receive a monthly fee for using their TradingView charts in my analysis.
💸💸💸💸💸💸
👇 👇 👇 👇 👇 👇
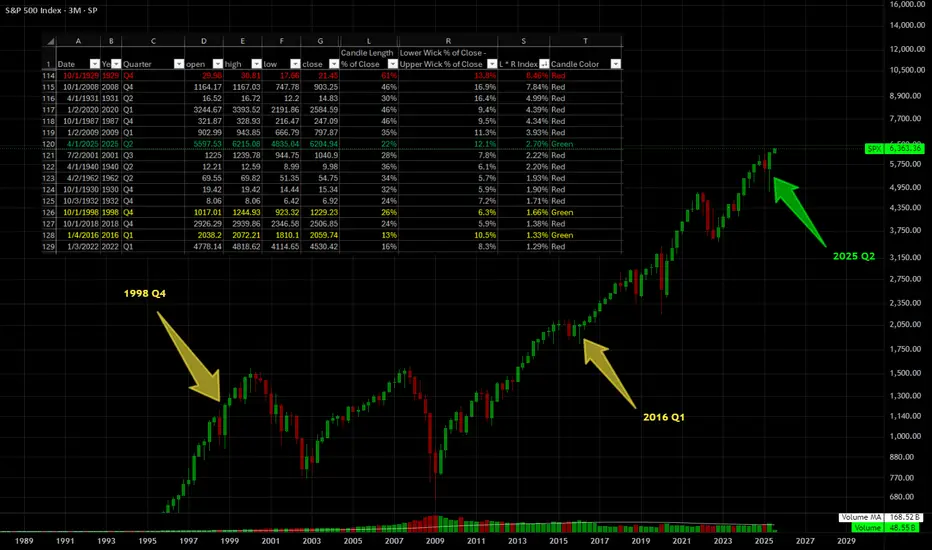
Quarterly Candle AnalysisQuarterly candle data going back to 1928 was exported and analyzed in Excel .
The purpose of doing so was to identify candles comparable to the candle we had in Q2 of 2025 (last quarter) in terms of scale and form.
Two properties of the candles were considered:
1. Candle Length as a % of Close (Column L)
2. Lower Wick as a % of Close minus Upper Wick as a % of Close (Column R)
The product of these properties (Column S) was considered as the primary quantitative metric for this analysis.
The two quarters determined to be most similar based on having green candles with forms similar to Q2 2025 were as follows:
Q4 1998
Q1 2016
Both quarters were followed by at least 4 more bullish quarters, hence, the result of this analysis is bullish, as should be expected with such a bullish candle.
People don't like the truth! Let's be honest, people don't like honesty. They prefer ideas that affirm their own beliefs.
When I read articles and posts from newer traders, it's often from a place of "all in" diamond hands and the notion that things go up forever.
I've been a trader for over 25 years now, and the game isn't about making a quick buck, it's about making money over and over again. This got me thinking, the issue is when you deal with a small account you require leverage, small timeframes and of course the "shit" or bust mindset. If you lose a thousand dollars, $10,000 even $100,000 - what does it matter? That's no different than a game of poker in Vegas.
The idea of being 80% in drawdown, is alien to me. The idea of one trade and one win is also a crazy notion.
Instead of playing with the future, there is an easier way to work. This isn't about slow and boring, it's about psychology and discipline. 10% returns on a million-dollar account isn't all that difficult. Instead of aiming for 300x returns on an alt coin (due to the account size being tiny) You can make less of a percentage gain with a larger account size.
In terms of psychology - the word " HOPE " is used, way too often, it's used when you hope a stock or the price of Bitcoin goes up, it's used when you hope the position comes back in your favour, it's used when you want your 10,000 bucks to double.
This isn't trading, it's gambling.
The truth is, it's not the winners that make you a good trader. It's the way you deal with the losses.
Once you learn proper risk management, a downtrend in a market move is a 1-2% loss coupled with a new opportunity to reverse the bias.
As a disciplined trader, the game is played differently.
Let's assume you don't have $100k spare - prop firms are a great option, OPM = other people's money.
Remove the risk and increase the leverage, all whilst trading with discipline.
The market goes through many phases, cycles and crashes.
You don't always need something as catastrophic to take place, but if you are all in on a position. You need to understand that losses can be severe and long-lasting.
When everyone sees an oasis in the desert, it's often a mirage.
You only have to look at the Japanese lesson in 1989, when the Nikkei was unstoppable-until it wasn't. For that short space in time, everyone was a day trader, housewives to taxi drivers.
Everyone's a genius in a Bull market.
Then comes the crash. The recovery time on that crash?
34-years!!!
I have covered several aspects of psychology here on TradingView;
When it comes to trading, if you are able to keep playing. It's a worthwhile game. If you are gambling, it's a game whereby the house often wins.
Right now, stocks are worth more than their earnings. Gold is up near all-time highs, crypto, indices the same.
All I am saying is if you are all in. Be careful!
Disclaimer
This idea does not constitute as financial advice. It is for educational purposes only, our principal trader has over 25 years' experience in stocks, ETF's, and Forex. Hence each trade setup might have different hold times, entry or exit conditions, and will vary from the post/idea shared here. You can use the information from this post to make your own trading plan for the instrument discussed. Trading carries a risk; a high percentage of retail traders lose money. Please keep this in mind when entering any trade. Stay safe.
S&P's "hugely overbought" towards 6375!1). Position Volume dropping! 2). Big institutions (Banks & Insurance) have backed off on higher Risk positions! 3). Huge resistance at .728 fib & trend! 4). Trump tariff talk is likely adding to a fall as well! 5). We're looking for a "SELL" trade @ 6375, since buying is too risky at the moment...Good Luck!

Well...... I have no words to say, lets see what happens now. The Last Breath of Bulls
They came with horns of thunder,
hooves pounding gold from earth,
a decade’s dance in roaring winds,
each sunrise glinting mirth.
They charged through fields of candlesticks,
green banners held aloft,
dreams stacked on dreams, layer by layer,
voices rising, soft to rough.
But markets tire as all beasts do,
the grass runs dry and thin,
greed’s fattened calves now restless,
as silence crowds the din.
A tremor in the trading halls,
screens blinking red, then grey,
the bulls look up at iron clouds,
no dawn in this new day.
They stand, bewildered, heavy,
in fields now tinged with frost,
the horns that once carved futures bright,
bowed under the cost.
The end comes not with fury,
but a quiet pulling thread,
the bullish songs that once were sung,
now whispers of the dead.
Yet even as the bulls lie down,
the soil still holds the sun,
for from the hush of fallen hooves,
new seasons will be spun.

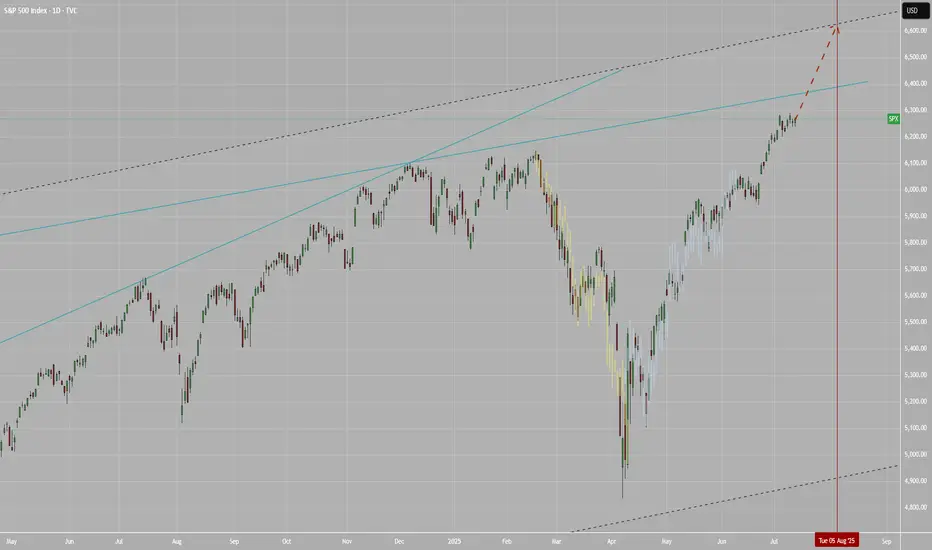
SPX to 6600+ by Aug 5This leg up in SPX is not over yet. Target at upper bound of the channel around 6.6K+ by Aug 5.
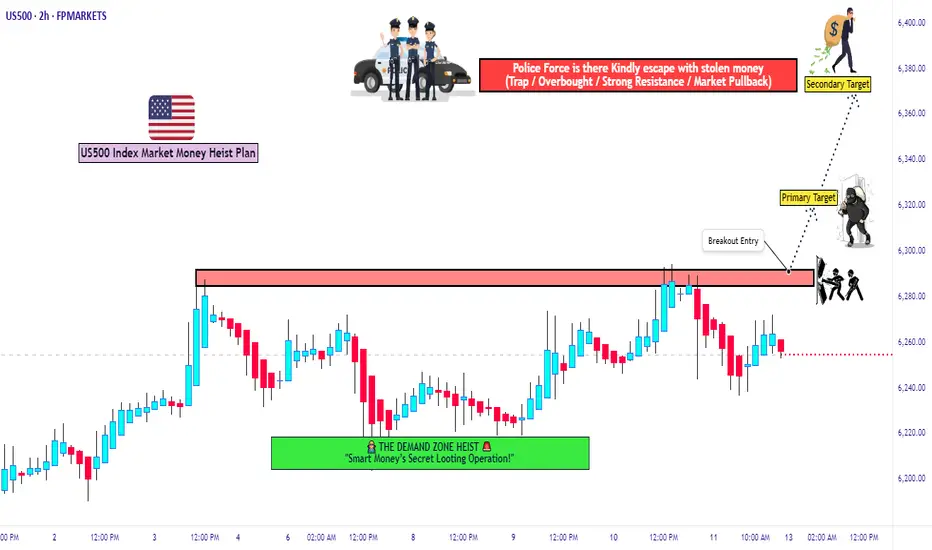
US500 Bulls Assemble | Breakout Heist Strategy📈🚨 MASTER HEIST PLAN: “SPX500 ROBBERY – THIEF TRADING STYLE 🔥💸” 🚨📈
(The Ultimate Long Strategy Blueprint for Smart Day/Swing Traders)
🌍 Greetings to All Market Bandits, Bullish Burglars, and Chart Snipers!
Hola! Bonjour! Ola! Hallo! Marhaba! 🙌
🦹♂️This is your friendly chart thief checking in with the latest SPX500/US500 masterplan!
This isn’t just a trade—it’s a heist 🎯. We’re not here to participate, we’re here to dominate! Welcome to the Thief Trading Style, where we map, trap, and snatch those pips with ruthless precision. 🧠🔍💰
🚀 THIEF TRADE SETUP - SPX500/US500
A mix of technical sniper entries + fundamental black ops analysis = 💸 Maximum Extraction. 💸
🎯 ENTRY PLAN: THE BREAKOUT HEIST
📍Buy Entry Zone: Wait for the clean breakout + candle close above 6270.00.
"The vault opens once we clear that wall. Let the bullish getaway begin!" 💥🚪📈
🛠️Thief Tips for Entry:
Use Buy Stop Orders above resistance levels.
OR layer in Buy Limit Orders near recent pullbacks (15/30m swing zones) using DCA Style (Dollar Cost Average layering like a pro).
Want stealth mode? Set that alert (alarm), and strike when the breakout sings. 🔔🎯
🛑 STOP LOSS – PROTECT THE LOOT
🧨Set your SL smart—beneath the nearest swing low using the 2H timeframe for stronger structure.
💬 “Look, don’t gamble. A thief knows when to run. Set that stop where I showed ya, or risk losin’ the bag.” 💼💣
❗Your SL should reflect your risk per trade, lot size, and number of entries. It’s your getaway plan—don’t mess it up.
💥 TARGETS – WHERE WE CASH OUT
🏴☠️Primary Take Profit (TP1): 6310.00
🏴☠️Secondary Take Profit (TP2): 6370.00
💹 Scalp Traders: Stick to the Long Side Only. Ride the momentum, but use trailing SL to lock it in.
🔍 THIEF FUNDAMENTAL INTEL: WHY THIS IS OUR MOMENT
Current SPX500 bullishness driven by:
✅ Positive macro & geopolitical tailwinds
✅ Institutional positioning (COT reports)
✅ Intermarket analysis showing strong correlations
✅ Momentum building with sentiment and volume
📌 Stay sharp—check all your fundamental reports, news catalysts, and sentiment tools before executing your move. Smart thieves plan every detail. 🎓📊
⚠️ NEWS RELEASE REMINDER
📢 News = Chaos. Don’t get caught in the spray:
🔒Avoid entering trades just before big announcements.
🚀 Use Trailing SL to secure profit if you're already in.
Stay agile. Stay smart. Stay rich. 💼🚁
❤️ SUPPORT THE HEIST – HIT THAT BOOST BUTTON!
👊 Liked the plan? Hit the Boost to join the elite robbery crew.
Every boost fuels the mission. Every like sharpens the strategy. Let's build a team of smart, profitable traders. 🚀💸🔥
🧠 Remember: This is general analysis – not financial advice. Manage your risk like a true thief. Stay updated. Adapt fast. Don't get caught. 🕵️♂️
🎉See you in the next Heist Plan! Keep your tools sharp, your charts cleaner, and your profit bags fatter. 🤑🔥
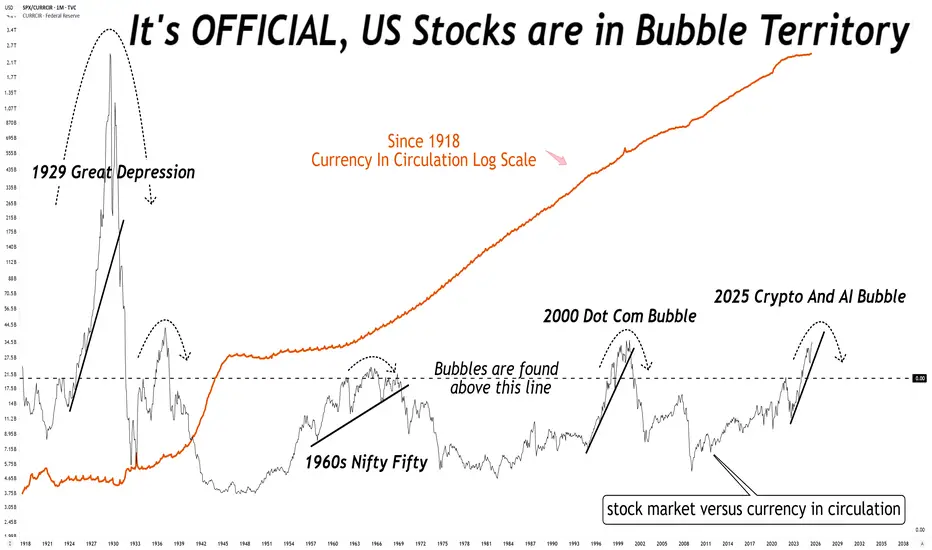
What do you mean the stock market is not in a bubble?What do you mean the stock market is not in a bubble?
No, it is not different this time, there is always a reversion to mean.
S&P500 (CASH500) SHORT - Head and shoulders Risk/reward = 5.8
Entry price = 6321.1
Stop loss price = 6333.5
Take profit level 1 (50%) = 6257.3
Take profit level 2 (50%) = 6234.9
Still waiting for confirmation on a few variables before I enter the trade.

S&P 500 – 15Min Chart BreakdownPotential retracement zone aligning with Order Block + 50% FIB.
Watching for bullish reaction near 6320–6316 — key confluence zone for a possible continuation leg. 🔁📈

The Empirical Validity of Technical Indicators and StrategiesThis article critically examines the empirical evidence concerning the effectiveness of technical indicators and trading strategies. While traditional finance theory, notably the Efficient Market Hypothesis (EMH), has long argued that technical analysis should be futile, a large body of academic research both historical and contemporary presents a more nuanced view. We explore key findings, address methodological limitations, assess institutional use cases, and discuss the impact of transaction costs, market efficiency, and adaptive behavior in financial markets.
1. Introduction
Technical analysis (TA) remains one of the most controversial subjects in financial economics. Defined as the study of past market prices and volumes to forecast future price movements, TA is used by a wide spectrum of market participants, from individual retail traders to institutional investors. According to the EMH (Fama, 1970), asset prices reflect all available information, and hence, any predictable pattern should be arbitraged away instantly. Nonetheless, technical analysis remains in widespread use, and empirical evidence suggests that it may offer predictive value under certain conditions.
2. Early Empirical Evidence
The foundational work by Brock, Lakonishok, and LeBaron (1992) demonstrated that simple trading rules such as moving average crossovers could yield statistically significant profits using historical DJIA data spanning from 1897 to 1986. Importantly, the authors employed bootstrapping methods to validate their findings against the null of no serial correlation, thus countering the argument of data mining.
Gencay (1998) employed non-linear models to analyze the forecasting power of technical rules and confirmed that short-term predictive signals exist, particularly in high-frequency data. However, these early works often omitted transaction costs, thus overestimating potential returns.
3. Momentum and Mean Reversion Strategies
Momentum strategies, as formalized by Jegadeesh and Titman (1993), have shown persistent profitability across time and geographies. Their approach—buying stocks that have outperformed in the past 3–12 months and shorting underperformers—challenges the EMH by exploiting behavioral biases and investor herding. Rouwenhorst (1998) confirmed that momentum exists even in emerging markets, suggesting a global phenomenon.
Conversely, mean reversion strategies, including RSI-based systems and Bollinger Bands, often exploit temporary price dislocations. Short-horizon contrarian strategies have been analyzed by Chan et al. (1996), but their profitability is inconsistent and highly sensitive to costs, timing, and liquidity.
4. Institutional Use of Technical Analysis
Contrary to the belief that TA is primarily a retail tool, it is also utilized—though selectively—by institutional investors:
Hedge Funds: Many quantitative hedge funds incorporate technical indicators within multi-factor models or machine learning algorithms. According to research by Neely et al. (2014), trend-following strategies remain a staple among CTAs (Commodity Trading Advisors), particularly in futures markets. These strategies often rely on moving averages, breakout signals, and momentum filters.
Market Makers: Although market makers are primarily driven by order flow and arbitrage opportunities, they may use TA to model liquidity zones and anticipate stop-hunting behavior. Order book analytics and technical levels (e.g., pivot points, Fibonacci retracements) can inform automated liquidity provision.
Pension Funds and Asset Managers: While these institutions rarely rely on TA alone, they may use it as part of tactical asset allocation. For instance, TA may serve as a signal overlay in timing equity exposure or in identifying risk-off regimes. According to a CFA Institute survey (2016), over 20% of institutional investors incorporate some form of technical analysis in their decision-making process.
5. Adaptive Markets and Conditional Validity
Lo (2004) introduced the Adaptive Markets Hypothesis (AMH), arguing that market efficiency is not a binary state but evolves with the learning behavior of market participants. In this framework, technical strategies may work intermittently, depending on the ecological dynamics of the market. Neely, Weller, and Ulrich (2009) found technical rules in the FX market to be periodically profitable, especially during central bank interventions or volatility spikes—conditions under which behavioral biases and structural inefficiencies tend to rise.
More recent studies (e.g., Moskowitz et al., 2012; Baltas & Kosowski, 2020) show that momentum and trend-following strategies continue to deliver long-term Sharpe ratios above 1 in diversified portfolios, particularly when combined with risk-adjusted scaling techniques.
6. The Role of Transaction Costs
Transaction costs represent a critical variable that substantially alters the net profitability of technical strategies. These include:
Explicit Costs: Commissions, fees, and spreads.
Implicit Costs: Market impact, slippage, and opportunity cost.
While early studies often neglected these elements, modern research integrates them through realistic backtesting frameworks. For example, De Prado (2018) emphasizes that naive backtesting without cost modeling and slippage assumptions leads to a high incidence of false positives.
Baltas and Kosowski (2020) show that even after accounting for bid-ask spreads and market impact models, trend-following strategies remain profitable, particularly in futures and FX markets where costs are lower. Conversely, high-frequency mean-reversion strategies often become unprofitable once these frictions are accounted for.
The impact of transaction costs also differs by asset class:
Equities: Higher costs due to wider spreads, especially in small caps.
Futures: Lower costs and higher leverage make them more suitable for technical strategies.
FX: Extremely low spreads, but high competition and adverse selection risks.
7. Meta-Analyses and Recent Surveys
Park and Irwin’s (2007) meta-analysis of 95 studies found that 56% reported significant profitability from technical analysis. However, profitability rates dropped when transaction costs were included. More recent work by Han, Yang, and Zhou (2021) extended this review with data up to 2020 and found that profitability was regime-dependent: TA performed better in volatile or trending environments and worse in stable, low-volatility markets.
Other contributions include behavioral explanations. Barberis and Thaler (2003) suggest that TA may capture collective investor behavior, such as overreaction and underreaction, thereby acting as a proxy for sentiment.
8. Limitations and Challenges
Several methodological issues plague empirical research in technical analysis:
Overfitting: Using too many parameters increases the likelihood of in-sample success but out-of-sample failure.
Survivorship Bias: Excluding delisted or bankrupt stocks leads to inflated backtest performance.
Look-Ahead Bias: Using information not available at the time of trade leads to unrealistic results.
Robust strategy development now mandates walk-forward testing, Monte Carlo simulations, and realistic assumptions on order execution. The growing field of machine learning in finance has heightened these risks, as complex models are more prone to fitting noise rather than signal (Bailey et al., 2014).
9. Conclusion
Technical analysis occupies a contested but persistent role in finance. The empirical evidence is mixed but suggests that technical strategies can be profitable under certain market conditions and when costs are minimized. Institutional investors have increasingly integrated TA within quantitative and hybrid frameworks, reflecting its conditional usefulness.
While TA does not provide a universal arbitrage opportunity, it can serve as a valuable tool when applied adaptively, with sound risk management and rigorous testing. Its success ultimately depends on context, execution discipline, and integration within a broader investment philosophy.
References
Bailey, D. H., Borwein, J. M., Lopez de Prado, M., & Zhu, Q. J. (2014). "The Probability of Backtest Overfitting." *Journal of Computational Finance*, 20(4), 39–69.
Baltas, N., & Kosowski, R. (2020). "Trend-Following, Risk-Parity and the Influence of Correlations." *Journal of Financial Economics*, 138(2), 349–368.
Barberis, N., & Thaler, R. (2003). "A Survey of Behavioral Finance." *Handbook of the Economics of Finance*, 1, 1053–1128.
Brock, W., Lakonishok, J., & LeBaron, B. (1992). "Simple Technical Trading Rules and the Stochastic Properties of Stock Returns." Journal of Finance, 47(5), 1731–1764.
Chan, L. K. C., Jegadeesh, N., & Lakonishok, J. (1996). "Momentum Strategies." Journal of Finance, 51(5), 1681–1713.
De Prado, M. L. (2018). Advances in Financial Machine Learning, Wiley.
Fama, E. F. (1970). "Efficient Capital Markets: A Review of Theory and Empirical Work." Journal of Finance, 25(2), 383–417.
Gencay, R. (1998). "The Predictability of Security Returns with Simple Technical Trading Rules." Journal of Empirical Finance, 5(4), 347–359.
Han, Y., Yang, K., & Zhou, G. (2021). "Technical Analysis in the Era of Big Data." *Review of Financial Studies*, 34(9), 4354–4397.
Jegadeesh, N., & Titman, S. (1993). "Returns to Buying Winners and Selling Losers: Implications for Stock Market Efficiency." *Journal of Finance*, 48(1), 65–91.
Lo, A. W. (2004). "The Adaptive Markets Hypothesis: Market Efficiency from an Evolutionary Perspective." *Journal of Portfolio Management*, 30(5), 15–29.
Moskowitz, T. J., Ooi, Y. H., & Pedersen, L. H. (2012). "Time Series Momentum." *Journal of Financial Economics*, 104(2), 228–250.
Neely, C. J., Weller, P. A., & Ulrich, J. M. (2009). "The Adaptive Markets Hypothesis: Evidence from the Foreign Exchange Market." *Journal of Financial and Quantitative Analysis*, 44(2), 467–488.
Neely, C. J., Rapach, D. E., Tu, J., & Zhou, G. (2014). "Forecasting the Equity Risk Premium: The Role of Technical Indicators." *Management Science*, 60(7), 1772–1791.
Park, C. H., & Irwin, S. H. (2007). "What Do We Know About the Profitability of Technical Analysis?" *Journal of Economic Surveys*, 21(4), 786–826.
Rouwenhorst, K. G. (1998). "International Momentum Strategies." *Journal of Finance*, 53(1), 267–284.
Zhu, Y., & Zhou, G. (2009). "Technical Analysis: An Asset Allocation Perspective on the Use of Moving Averages." *Journal of Financial Economics*, 92(3), 519–544.
S&P500 INDEX (US500): Bullish Trend Continues
US500 updated a higher high this week, breaking a resistance
of a bullish flag pattern on a daily time frame.
I think that the market will rise even more.
Next goal for the bulls - 6359
❤️Please, support my work with like, thank you!❤️
I am part of Trade Nation's Influencer program and receive a monthly fee for using their TradingView charts in my analysis.
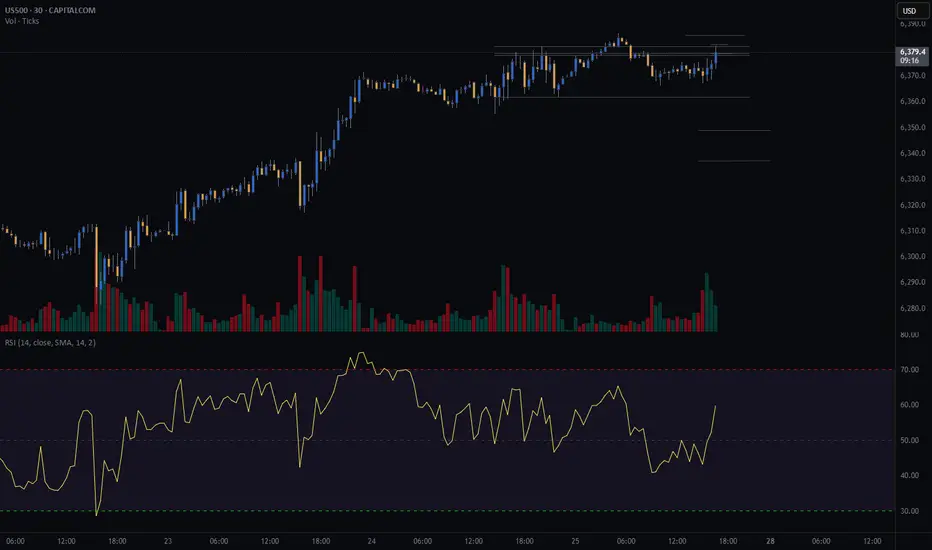
S&P (CASH500) SHORT - Double top 30minRisk/reward = 2.7
Entry price = 6384
Stop loss price = 6393.8
Take profit level 1 (50%) = 6359.8
Take profit level 2 (50%) = 6351.8
Will get confirmation of remaining variables at close of this 30min candle at 19.30.