BuyRejection Level
Daily Volume
Market Structure Shift
London US Session
Trend Line Break
Untapped Order Point
SPX500 trade ideas

S&P500 push to new ATH? Key Developments:
AI Drives Earnings Momentum
Alphabet reported strong results, but flagged surging AI infrastructure costs, signaling increased capex ahead.
SK Hynix posted record earnings and committed to expanding AI-related investments, reinforcing the sector’s critical growth role.
Investor sentiment remains AI-positive, with capital rotation favoring tech and semiconductors despite margin compression risks.
Banking Sector Boosted by Tariff-Driven Volatility
Deutsche Bank’s FIC (Fixed Income & Currencies) trading revenue jumped 11% to €2.28B, its best Q2 since 2007, aided by global trade uncertainty.
BNP Paribas also beat earnings estimates, continuing the strong showing from European banks amid market volatility.
Trade & Tariff Watch
The EU and US are nearing a deal on a 15% standard tariff rate, potentially stabilizing trade flows and market pricing.
Trump’s broader reciprocal tariff push remains in focus, especially after the US-Japan deal. Investors are watching for signs of escalation or resolution with other partners like the EU and Canada.
Fed in the Political Spotlight
Trump visited the Fed’s construction site, criticizing costs and maintaining pressure on Chair Jerome Powell.
Speculation about Fed leadership changes and political interference is unsettling, though markets have largely shrugged this off for now.
Meanwhile, House Republicans are drafting a follow-up tax-and-spending plan, which could shape future fiscal policy and market expectations.
Conclusion: S&P 500 Trading Outlook
The S&P 500 remains buoyed by strong earnings, particularly from AI-linked sectors and financials, while geopolitical risks and tariff volatility are being absorbed as catalysts for trading profits rather than panic.
Bullish factors: Strong corporate earnings (Alphabet, SK Hynix, Deutsche Bank), potential trade de-escalation (EU-US tariff deal), and AI momentum.
Risks to monitor: Rising AI capex (impact on margins), political tension around the Fed, and tariff uncertainty.
Key Support and Resistance Levels
Resistance Level 1: 6387
Resistance Level 2: 6457
Resistance Level 3: 6502
Support Level 1: 6272
Support Level 2: 6224
Support Level 3: 6156
This communication is for informational purposes only and should not be viewed as any form of recommendation as to a particular course of action or as investment advice. It is not intended as an offer or solicitation for the purchase or sale of any financial instrument or as an official confirmation of any transaction. Opinions, estimates and assumptions expressed herein are made as of the date of this communication and are subject to change without notice. This communication has been prepared based upon information, including market prices, data and other information, believed to be reliable; however, Trade Nation does not warrant its completeness or accuracy. All market prices and market data contained in or attached to this communication are indicative and subject to change without notice.

SellRejection Level
Daily Volume
Market Structure Shift
London Session
Trend Line Break
Untapped Order Point

SPX - Time for a correction? To make it very simple,
Prices have been going up very nicely those last few weeks and months.
Everyone is happy but as we know that can't last.
NASDAQ:OPEN seems to be the latest pump and dump and it's just another sign of a coming correction imho.
Most stocks I've been following have reached resistance zone, levels where profit taking is very likely.
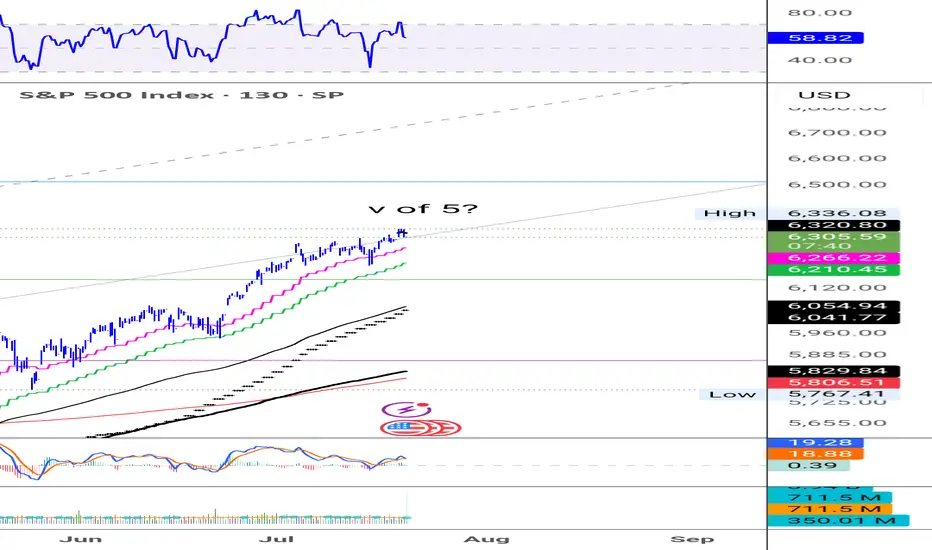
$S&P500 seems to have made a fifth wave, RSI divergence is present and confirming that.
It's difficult to pinpoint the exact top of course so I'm giving myself some leeway and use a small 1% stop loss in this case.
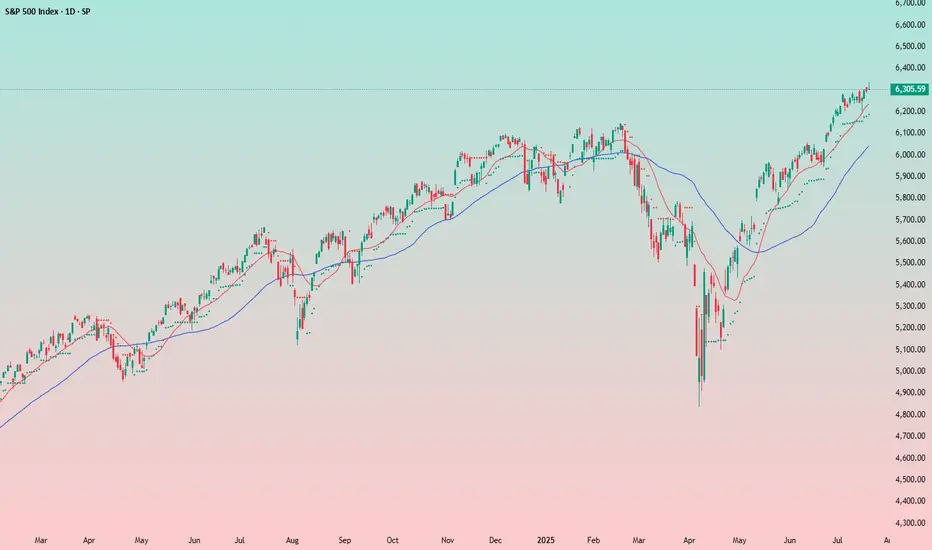
Market Breadth Flashes Warning, but S&P 500 Still Holds SteadyThe S&P 500 continues its slightly positive movement. However, the momentum has been slowing, forming a long, wedge-like pattern. These long wedges have been a recurring feature in the stock market for years. From the monthly timeframe to the 1-hour chart, the market often forms wedges.
Wedge formations tend to break to the downside but can persist for a long time before doing so. The S&P 500 typically makes a sharp correction selloff, then recovers in a "V" shape, followed by the formation of another wedge. This pattern appears to be repeating once again. Still, there are some negative signals that traders should be aware of:
1- The impact of tariffs on growth remains a major unknown. Most tariff deals have not been finalized yet. While the Japan agreement is a positive step, negotiations with the EU will be more significant.
2- Many earnings reports will be released in the coming weeks, potentially shaping market sentiment. These earnings will reflect some of the tariff effects. AI and tech remain the key market drivers, so their results will be especially important.
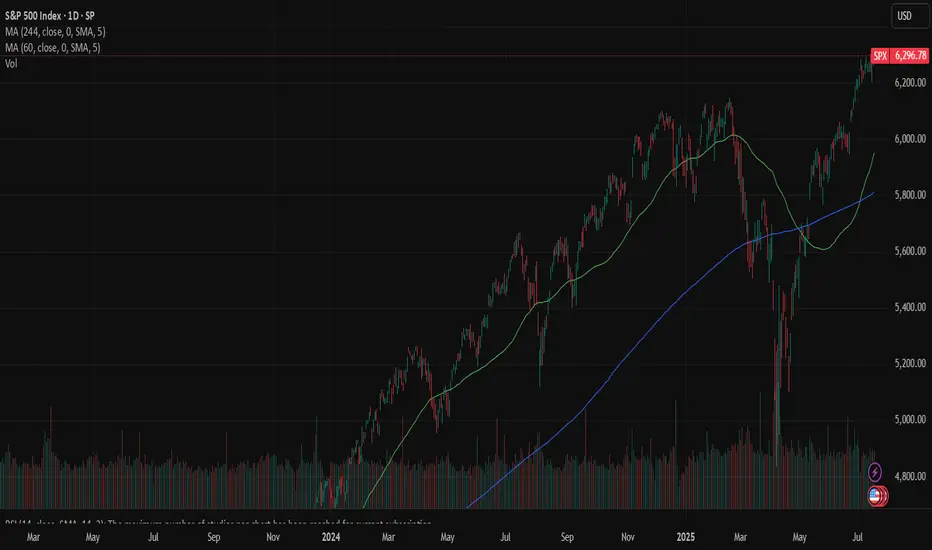
3- Some breadth indicators are showing early warning signs. One of the most useful is the "percentage of stocks above the 200-day moving average." This metric shows whether the market is broadly participating in the rally or being driven by a few large-cap names. Typically, when the market weakens, traders rotate into mega caps. The rounded numbers below shows the weakness:
March 2024 Top: 5250 - Percantege Above 200 MA: 85%
July 2024 Top: 5675 - Percantege Above 200 MA: 80%
December 2024 Top: 6100 - Percantege Above 200 MA: 74%
July 2025 Current: 6309 - Percantege Above 200 MA: 66%
This shows that fewer and fewer stocks are managing to stay above their 200-day moving average while S&P making new highs. This is not an immediate red flag, but the weakening is apparent.
In summary, the slightly positive outlook remains intact for now and is expected to continue until the wedge breaks with some early warning signs. If that happens, a sharp selloff may follow, creating both selling and buying opportunities. In the short term, 6280 is the immediate support level to watch.

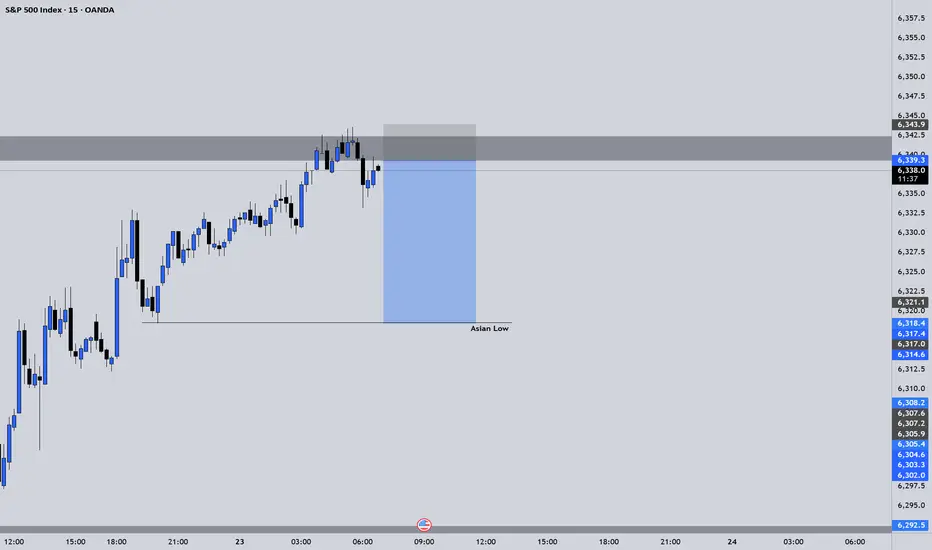
SPX500 ShortElite Analysis
This was a discretionary trade
Price came to structural liquidity
Executed trade on 5m
Targeting Asian low LP.
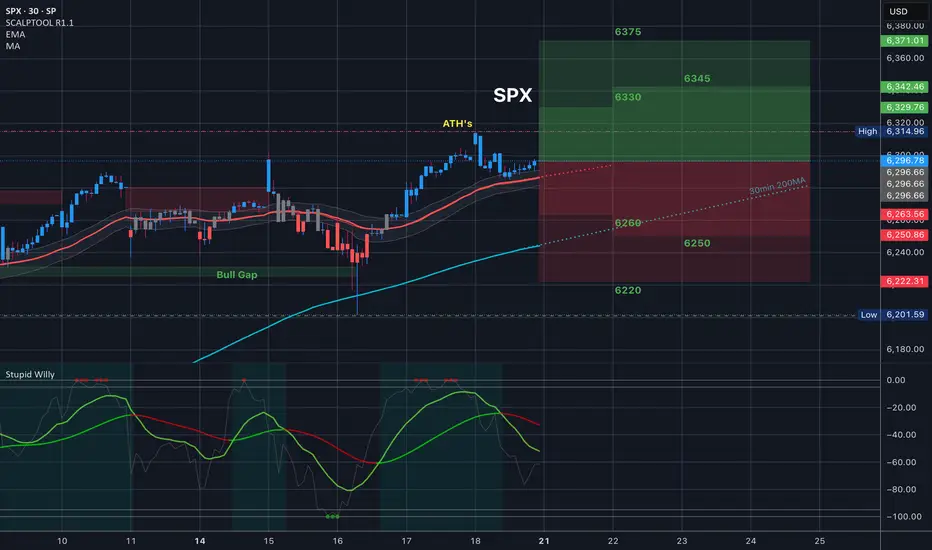
$SPX Trading Range for 7.21.25 and everything in itToday’s Trading range and everything in it. How are you playing it?
SPX: Banks beat, stocks peakThe US equity markets remained relatively resilient this week, despite ongoing concerns about trade policy developments. After last week’s slight retreat from its all-time high, the S&P 500 resumed its upward momentum early in the week, continuing to hover near record levels. The index reached a new highest level of 6,315 on Friday before pulling back slightly, closing the week at 6.296.
Bank earrings were in focus of investors during the previous week. Overall, Q2 reports from major U.S. banks showed resilience — better-than-expected earnings, strong interest income, and robust capital actions. So far, the finance sector has seen Q2 earnings rise around 13% y/y and 3,4% revenue growth. In addition, a stress test posted by Fed underpin confidence as all major banks, including JPMorgan and Citi showing resilience also under potential stress conditions. However, both bankers and investors held a cautious tone on macro/public policy risk.
Investors' confidence was additionally boosted by better than expected US macro data posted during the previous week. The inflation rate in June was 0,3% for the month and 2,7% on a yearly basis. At the same time, retail sales beat market expectations with an increase of 0,6% in June. As per analysts reports, currently 27 stocks included in the S&P 500 are trading at the all time highest levels. The ADM company, which is well known for producing Coca Cola, had a drop in the value of shares of 2% after the US President requested from the company to use real cane sugar in their popular drink.
From July 23st a composition of companies included in the S&P 500 index will be changed. A crypto company Block will be included, while the company Hess will be excluded from the index. Shares of the Blok surged by 10% on Friday, after the release of the news.

Things are about to get wild. Just for fun... Hey, it can happen... right? 🤔😉
85% drop then.. hyper inflation.

If we want a 2020-2021 style run, we need a seasonal pullbackUS 500 Index SP:SPX AMEX:SPY AMEX:VOO August seasonal scenario: institutional participation remains light, being outperformed by leveraged dip buying retail. How long can they remain on the sidelines, missing opportunities for their clients, before FOMO kicks in? Remember that institutions aren't emotionally driven, unlike their retail counter parts. That being said, they're itching to get in. What will compel them? IMO, a 5% pull back will incentivize them to buy. The August seasonal pull back may provide just that opportunity. If it comes, what happens in late Q3 and the rest of Q4 will likely be similar to 2020-2021. The deeper the pull back, the more impulsive it will likely be, as retail and institutions will be temporarily in tandem. SP:SPX PEPPERSTONE:US500 AMEX:SPY AMEX:VOO

Waiting for a Clear Signal: Too Early to Short the IndexNothing interesting is forming on the index so far.
My outlook remains neutral.
I previously attempted to short it, but those attempts were unsuccessful. Now I need to wait for a more reliable entry point — the chart will show the way.
For now, I’m staying on the sidelines.
Historically, the start of the Fed’s rate-cutting cycle has always coincided with the beginning of a decline in the stock market. I believe this time won’t be an exception — but for now, it’s too early to short.
SPX 500 TO CONTINUE HIGHER Week of July 20, 2025 SPX500 will continue going higher as we don't have any reversal setup yet on the higher time frames, although there is a lot of hesitation on the chart as the past week's new high was not supported. The trend on 4 hours to weekly is still up and has no break of major moving averages yet. I am looking forward to either a capitulation new high candle or a bullish new high candle that breakout of the weekly consolidation zone as we enter another trading week. I hope my thought process and analysis is helpful for making your own trading or investment decisions.
Thank you for listening and wish everyone a great trading week.
Cheers

S&P bearish div on the dailySuspiciously... the market is correcting today before Powell has opened his mouth.
Bearish div on the daily chart above ATH's
Big correction coming?

1_Day_ChartThis chart represents the 1-day (Daily timeframe) price action of the S&P 500 Index (SPX), offering a focused view of market sentiment, key levels, and trend momentum as of . Each candlestick reflects a full trading day.
📊 Chart Parameters:
Instrument: S&P 500 Index (SPX)
Timeframe: 1D (1-Day)
Exchange: NYSE / NASDAQ Composite (tracked as index)
Date Range Displayed: Past 3–6 months (approx.)
US500 Swing short tradeUS500 index is on the verge of major drop. I expect the price to sink in the coming weeks, that's why this will be a swing trade. I expect to reach my main target of $6000 around mid/end of August, with a second short entry once we will start to drop and retrace till my key level.

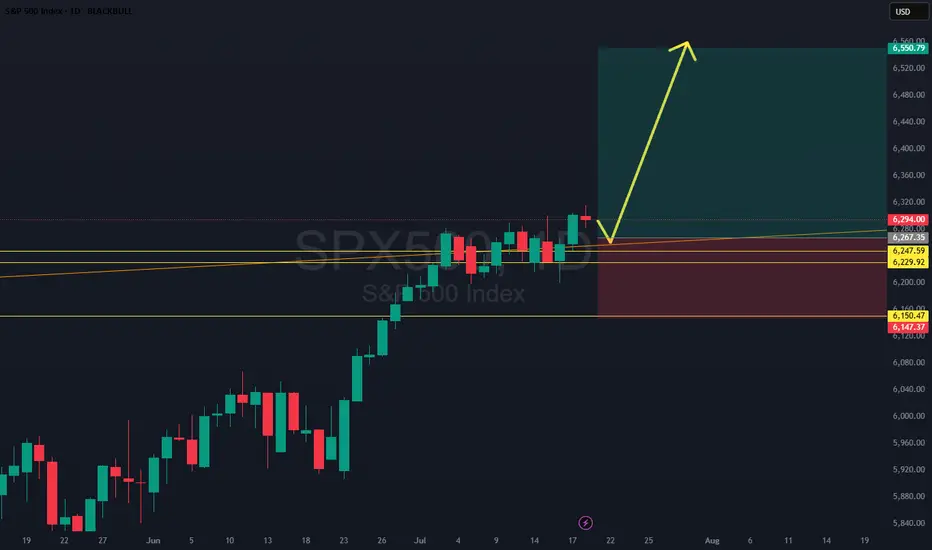
SPX500: Clean Breakout Setup - Trade of the Week?SPX500 just broke and closed above a key daily level, confirming strength after a bull flag formed off a skinny leg up. The plan? Wait for a retest of that flag structure, then ride momentum higher. We’ve got a conservative stop below solid support, making this one of the cleanest, most technically sound setups of the week. Only watch-out: price may not give the retest and could continue running. Either way, structure favors the bulls.
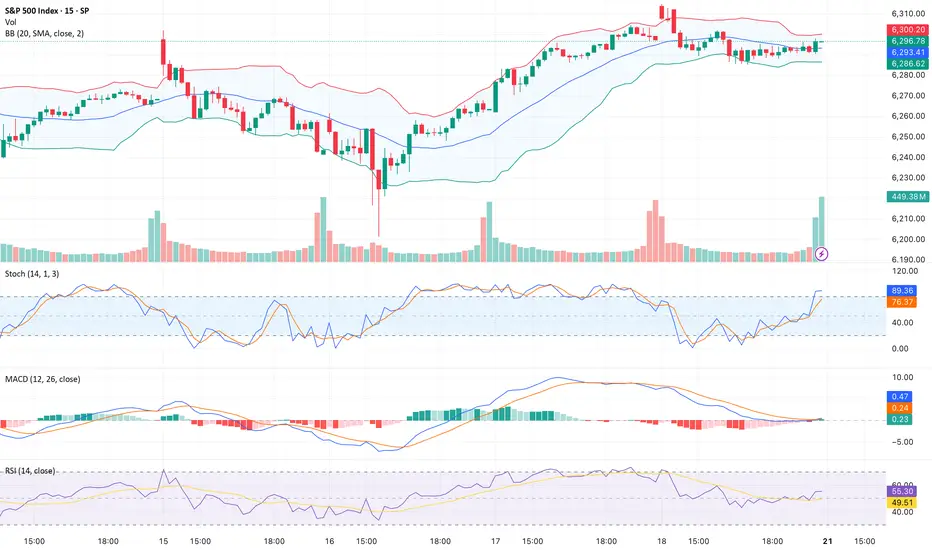
15_MinThis is a 15-minute timeframe chart, where each candlestick represents 15 minutes of trading activity. It is primarily used by intraday traders and scalpers to identify short-term trends, breakout zones, and momentum plays.
This chart of the S&P 500 (SPX) reflects intraday movements with real-time tracking of support/resistance zones, volume spikes, and short-term patterns.
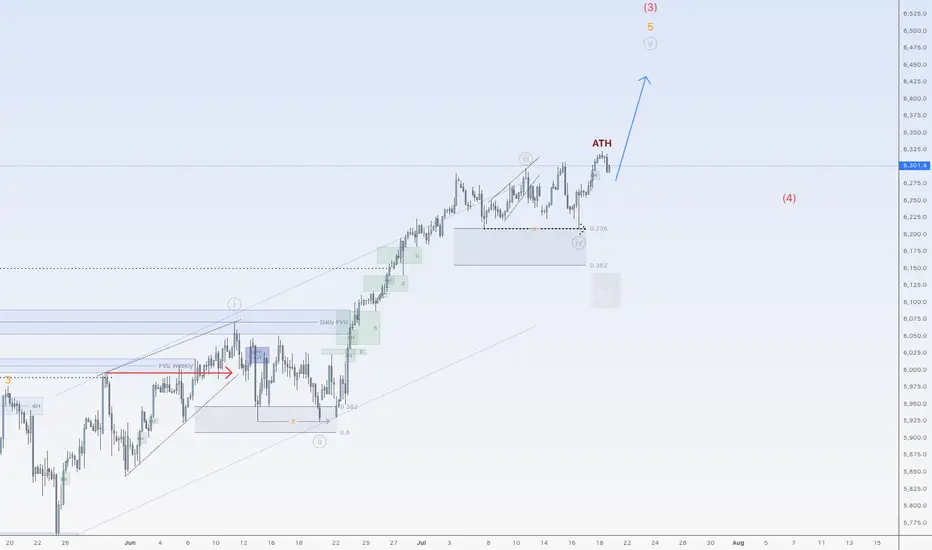
More upside for SPX500USDHi traders,
Last week SPX500USD made a small correction down (grey wave 4) and after it swept the dotted trendline it went up again. This could be the next impulse wave 5 (grey).
If this is true, then next week we could see more upside for this pair.
Let's see what the market does and react.
Trade idea: Wait for a small pullback and a change in orderflow to bullish on a lower timeframe to trade longs.
If you want to learn more about trading FVG's & liquidity sweeps with Wave analysis, then please make sure to follow me.
This shared post is only my point of view on what could be the next move in this pair based on my technical analysis.
Don't be emotional, just trade your plan!
Eduwave
S&P 500 Bullish Rounding Bottom in PlayS&P 500 continues its upward trajectory, supported by a clearly defined rounding bottom formation. Price has successfully broken above the neckline resistance, followed by a technical pullback which was met with a strong buy reaction, validating this zone as a key demand area.
This pullback area now acts as a critical structural base and the current bounce reinforces bullish continuation bias. The active plan is to accumulate within the buy-back zone and follow the path laid out in the chart towards the projected upside targets.
Drop your stock requests in the comments for a quick analysis, only US-listed stocks will be reviewed under this post.

Warning: SPX500 May Have Peaked—Here’s What the Charts SayThe S&P 500 (SPX500) may have reached its peak. In this video, I reveal the technical evidence pointing to a potential reversal—including monthly bearish divergence, daily and weekly reversal candles, and confirmation from key indicators.
This isn’t just noise—these signals align across timeframes, suggesting a shift in momentum that could lead to significant downside. I’ll walk you through the charts, explain the implications for traders and investors, and highlight critical support levels to watch.
Thank you for watching and have a great trading week. Cheers!!

S&P500 corrective pullback key support at 6200Key Support and Resistance Levels
Resistance Level 1: 6316
Resistance Level 2: 6374
Resistance Level 3: 6430
Support Level 1: 6200
Support Level 2: 6112
Support Level 3: 6073
This communication is for informational purposes only and should not be viewed as any form of recommendation as to a particular course of action or as investment advice. It is not intended as an offer or solicitation for the purchase or sale of any financial instrument or as an official confirmation of any transaction. Opinions, estimates and assumptions expressed herein are made as of the date of this communication and are subject to change without notice. This communication has been prepared based upon information, including market prices, data and other information, believed to be reliable; however, Trade Nation does not warrant its completeness or accuracy. All market prices and market data contained in or attached to this communication are indicative and subject to change without notice.

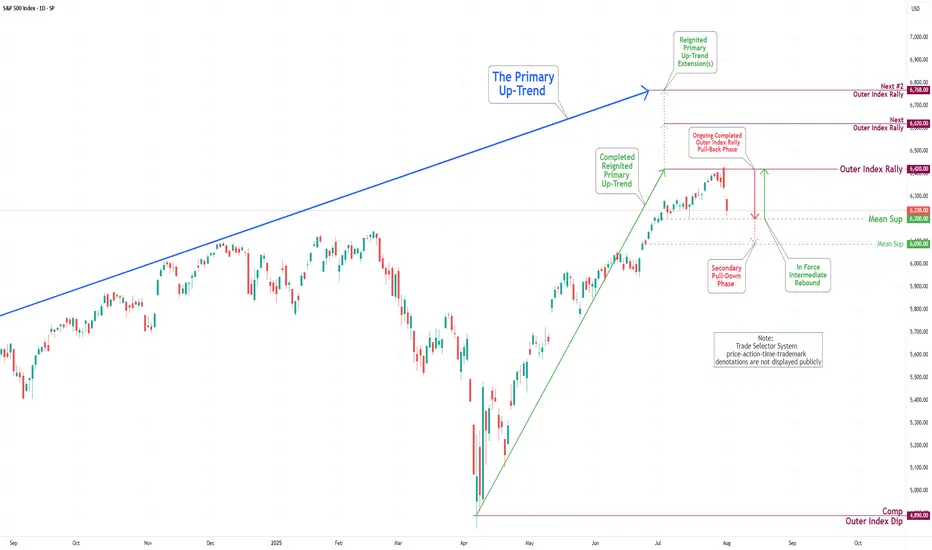
S&P 500 Daily Chart Analysis For Week of August 1, 2025Technical Analysis and Outlook:
During the trading activity of the previous week, the S&P 500 Index displayed a predominantly bearish movement after completing our Outer Index Rally target of 6420, as highlighted in the prior week’s Daily Chart Analysis, with the primary objective now being to plug our Mean Support at 6200.
It is essential to recognize that the current price movement may trigger a significant further pullback to the Mean Support level of 6090. Following this downturn, it is expected that the index will resume its upward momentum, aiming for a retest of the Outer Index Rally peak at 6420.