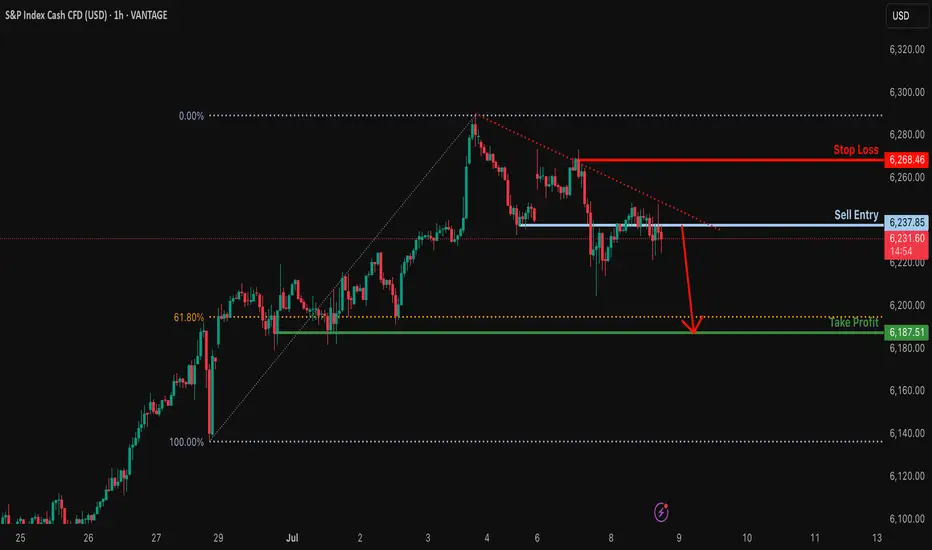
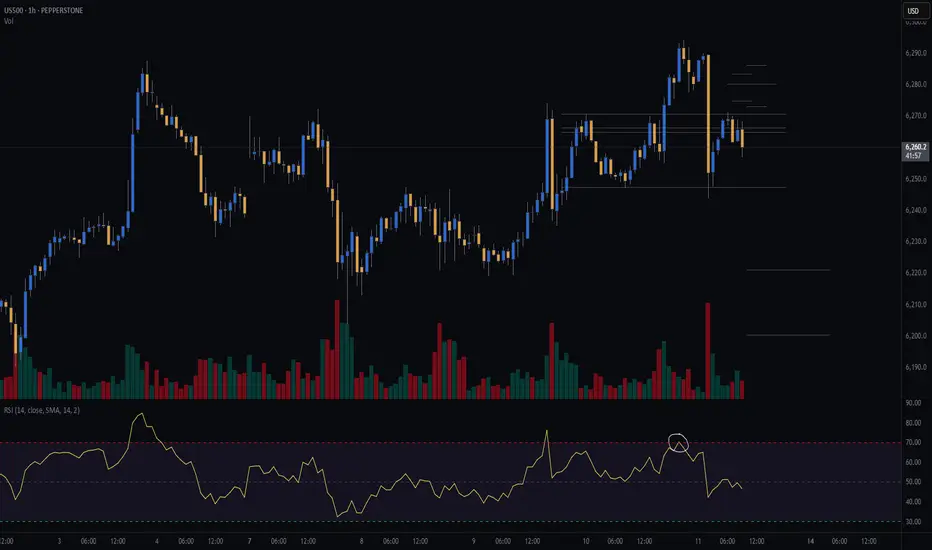
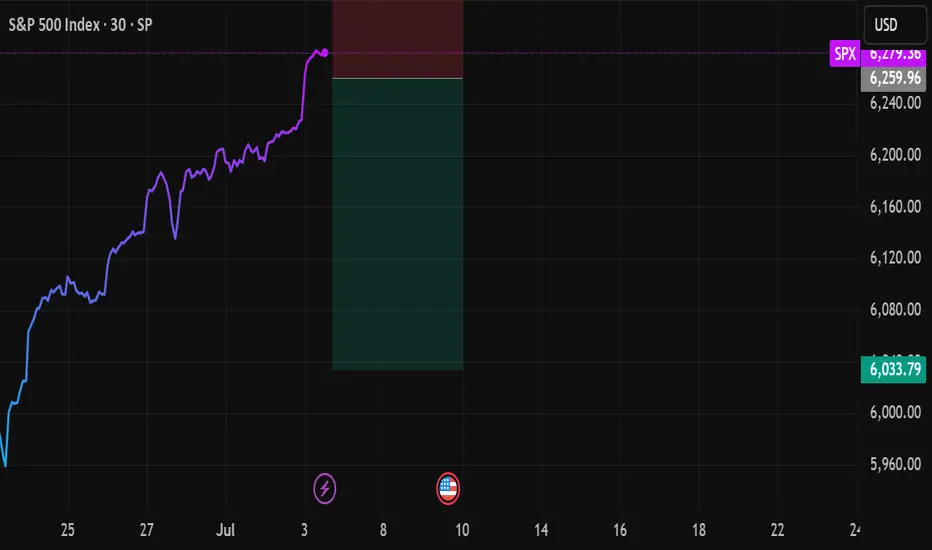
Bearish drop?S&P500 is reacting off the resistance level which is a pullback resistance and could drop from this level too ur take profit.
Entry: 6,237.85
Why we like it:
There is a pullback resistance level.
Stop loss: 6,268.46
Why we like it:
There is a pullback resistance level.
Take profit: 6,187.51
Why we like it:
There is a pullback support that is slightly below the 61.8% Fibonacci retracement.
Enjoying your TradingView experience? Review us!
Please be advised that the information presented on TradingView is provided to Vantage (‘Vantage Global Limited’, ‘we’) by a third-party provider (‘Everest Fortune Group’). Please be reminded that you are solely responsible for the trading decisions on your account. There is a very high degree of risk involved in trading. Any information and/or content is intended entirely for research, educational and informational purposes only and does not constitute investment or consultation advice or investment strategy. The information is not tailored to the investment needs of any specific person and therefore does not involve a consideration of any of the investment objectives, financial situation or needs of any viewer that may receive it. Kindly also note that past performance is not a reliable indicator of future results. Actual results may differ materially from those anticipated in forward-looking or past performance statements. We assume no liability as to the accuracy or completeness of any of the information and/or content provided herein and the Company cannot be held responsible for any omission, mistake nor for any loss or damage including without limitation to any loss of profit which may arise from reliance on any information supplied by Everest Fortune Group.
SPX500USD trade ideas
SPX500 Eyes New ATH – Key Levels in PlaySPX500 – Overview
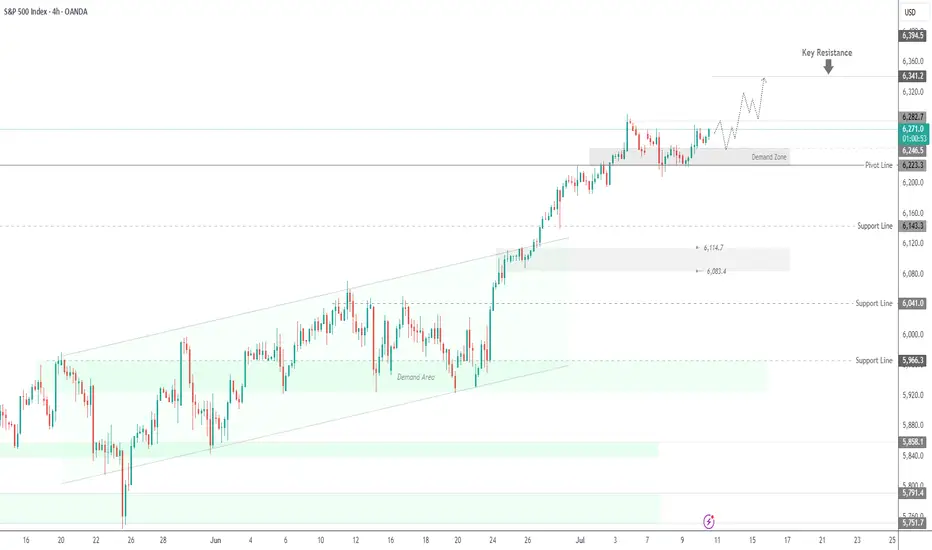
The index remains under bullish pressure, with potential to record a new all-time high (ATH).
As long as the price holds above 6246, the bullish trend is likely to continue toward 6282.
A confirmed 1H close above 6287 could trigger further upside toward 6310 and 6341.
However, a break below 6223 would signal bearish momentum, opening the path toward 6195 and 6143.
Pivot Line: 6282
Resistance: 6310, 6341
Support: 6246, 6223, 6195
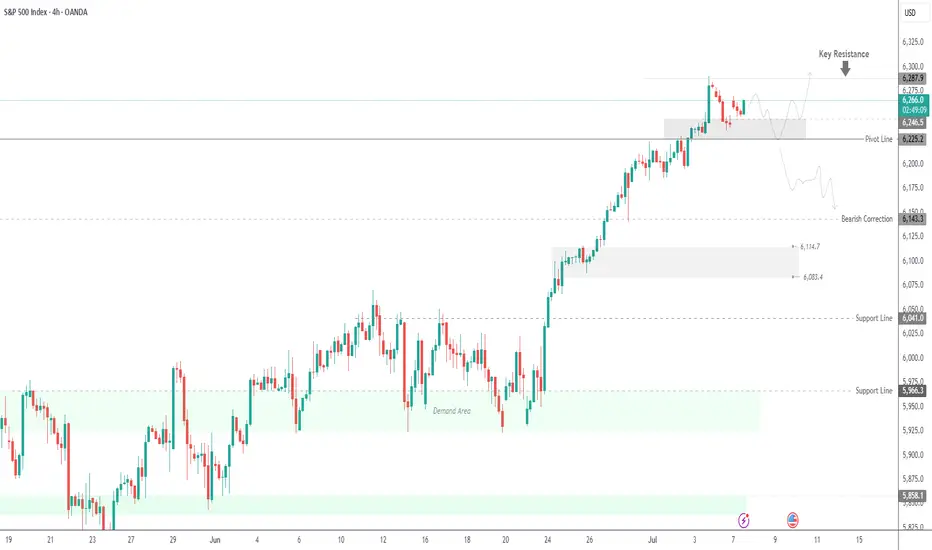
SPX500 Holding Bullish Structure – Eyes on 6287 BreakoutSPX500
The price maintains bullish momentum as long as it remains above 6225 and 6246.
Currently, the market is approaching the 6287 resistance level. A confirmed 4H candle close above 6287 is required to validate continuation of the bullish trend toward 6325.
However, a rejection from 6287 may trigger a short-term bearish correction, with potential pullbacks toward 6246 and 6225.
A sustained break below 6225 would shift the momentum to the downside, targeting the 6143 support level.
Pivot Level: 6264
Resistance: 6287 – 6325
Support: 6246 – 6225 – 6143
SPX - short here to test pivot around 6,040hit key area on the backtest heading back down to 6k area
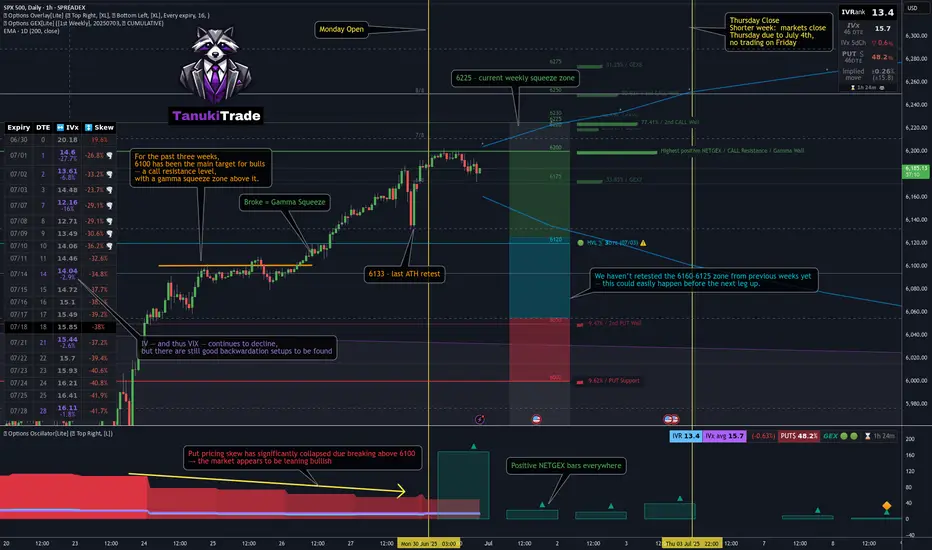
06/30 Weekly Gamma Exposure Outlook🧠 SPX Weekly Outlook — Gamma Breakout + Short Week Setup
The bulls finally broke through after weeks of painful grinding — and they did so with force.
📈 Thursday & Friday brought a textbook gamma squeeze as SPX sliced through the long-standing 6100 call wall , triggering sharp upside acceleration.
We are now firmly in positive Net GEX territory.
🔺 Entire GEX structure has shifted higher.
🎯 New squeeze zone at 6225 , with major call resistance near 6200 .
🔍 What Just Happened?
📊 The 6060–6120 zone acted as a tough resistance range for weeks — until last week’s breakout.
💥 Put skew collapsed , suggesting downside hedges are being unwound.
📉 VIX and IV keep dropping , confirming a shift toward lower-volatility environment .
🧲 Strong Net GEX across expiries created sustained upward dealer pressure → we’re in long gamma mode .
✅ Bullish Bias — But Stay Tactical
We're in a bullish gamma regime , so dips are likely to be bought.
Key pullback zone to watch: 6125–6060 .
🛠️ Strategy Ideas:
• Wait for a 6060–6125 retest before re-entering longs
• Use shorter-DTE bull put spreads or 0DTE gamma scalps above 6130+
• Scale out or trim risk near 6200–6225
⚠️ Risks to Watch
We’re overextended short-term.
🚨 Losing 6130–6125 could spark a quick flush to 6050 .
Bearish signals to monitor:
• IV spike or renewed put buying
• Loss of 6100 = no-man’s land without confirmation
• Consider short-term debit put spreads if breakdown confirms
🗓️ Short Trading Week Note
🇺🇸 U.S. markets closed Friday, July 5 for Independence Day.
This compresses flows into 4 sessions. Expect:
📌 Early week dealer hedging
📌 Possible positioning unwind on Thursday
💡 Weekly Trade Idea — Structure in Place
💼 Setup:
• Put Butterfly below spot
• 3x Call Diagonal Spreads above spot (5pt wide)
• Slight net negative delta , 11 DTE
🎯 Why it works:
• Leverages IV backwardation
• Profits from time decay
• Favors a stable or modestly bullish week
• Takes advantage of horizontal skew (July 11 vs July 14)
💰 Profit Target: 10–20% return on ~$1,730 risk.
Take profits before time decay kills the center valley — don’t overstay. 🏃💨
📌 Final Thoughts:
The 6100 breakout was technically & gamma-structurally significant ,
but big moves often retest before continuing.
Let price breathe.
Stay aligned with gamma exposure profile. 🔄
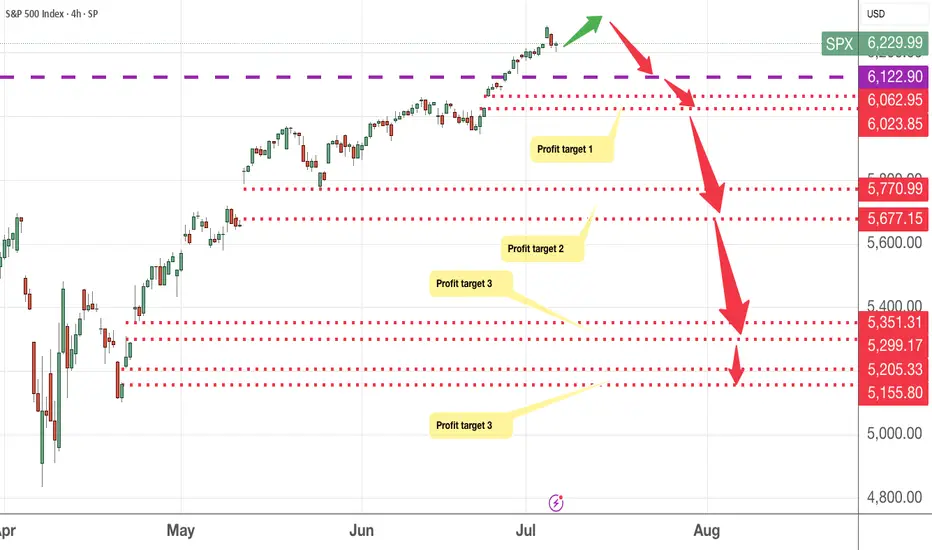
SPX may have retracement soon, taking profits timeAs if timing cannot be more coincidental, Trump has announced slapping 25% tariff on Japan and South Korea. This sends chills back to the stock market as the SPX has recently climbed and exceeded the previous high of 6148 price level.
This week, I expect the SPX to retrace to the various levels I indicated on the chart. Profit target 3 and 4 looks less likely but not impossible. 1 & 2 are more likely and that again would be a good entry level to accumulate.
No, I am not shorting as I invest in the VOO ETF for long term so retracement is a good opportunity to long.
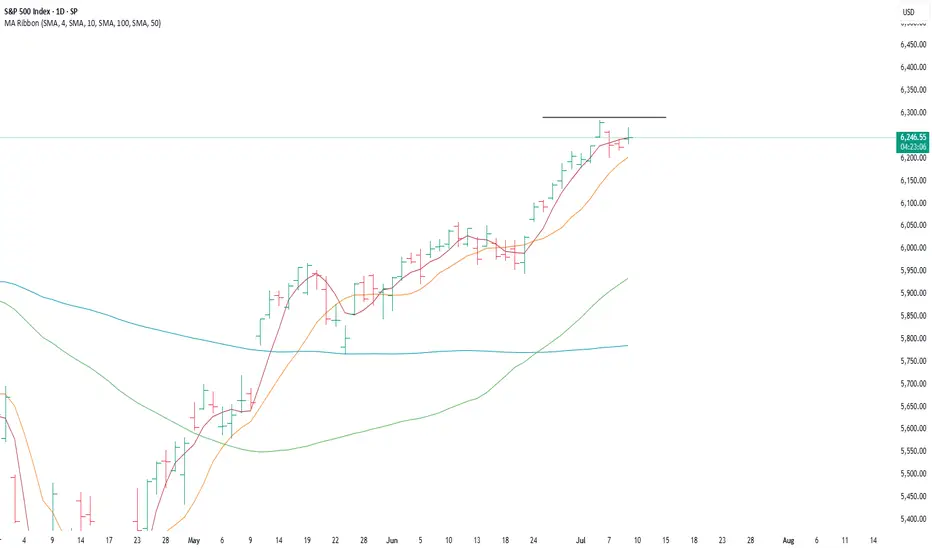
Quick take on the S&P500From the very short-term perspective, the SP:SPX is currently stuck in a tight range. Waiting for a little breakout.
Let us know what you think in the comments below.
Thank you.
75.2% of retail investor accounts lose money when trading CFDs with this provider. You should consider whether you understand how CFDs work and whether you can afford to take the high risk of losing your money. Past performance is not necessarily indicative of future results. The value of investments may fall as well as rise and the investor may not get back the amount initially invested. This content is not intended for nor applicable to residents of the UK. Cryptocurrency CFDs and spread bets are restricted in the UK for all retail clients.

SP500 rock & roll with Trump.. 4/July/25SPX500 breaking ATH again are we in bullish stage? Or again Donald Trump "Inviting" us come to his WWE stage for his favourite "wrestling" games.. Jumping up and down or up side down.( expanding triangle) ......
S&P 500 (CASH500) Short - Head and shoulders H1Potential short on S&P 500.
Risk/reward = 3.4
Entry = 6264.9
Stop loss = 6280.3
TP level 1 = 6221.7 (50%)
TP level 2 = 6200.5 (50%)
Need current candle to close back in range at 10.00 for all variables to be met.
Volume exception applied since current candle is the open of European markets.
SPX - This IS the TOPA three day test of the high is as obscure as it can get, especially when I hear on tv that there is near certainty that every dip is a buying opportunity. We have enough for the move to count as a wave 5. The next move down should be a doozy. I'd be happy with a few down days with the intense resiliancy of stocks. Too much money in the system. Can prices go to infinity?
Little more upside for SPX500USDHi traders,
Last week SPX500USD went higher then expected (wavecount updated).
If this is correct, then next week we could see a little more upside for this pair.
Let's see what the market does and react.
Trade idea: Wait for price come into the Daily bullish FVG's to trade longs again. At the moment price is too high to trade.
If you want to learn more about trading FVG's & liquidity sweeps with Wave analysis, then please make sure to follow me.
This shared post is only my point of view on what could be the next move in this pair based on my technical analysis.
Don't be emotional, just trade your plan!
Eduwave
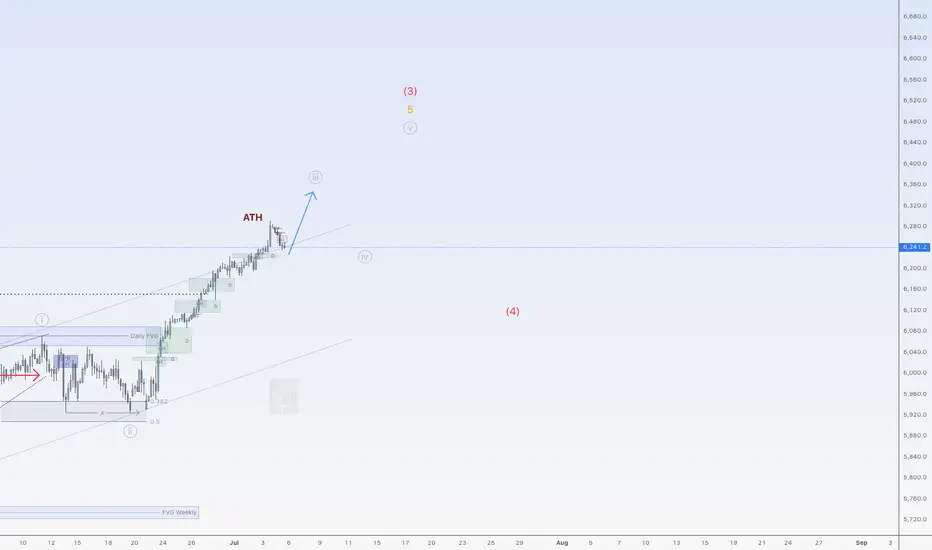
S&P 500 - Micro Count Ew AnalysisThis is my lower timeframe analysis. Price has now reached the ideal target area for Wave 3, suggesting that a corrective phase may soon follow. This potential retracement could also align with broader market reactions to a possible announcement from Trump regarding new tariffs on Russia this coming Monday.
P.S. The macro count and higher timeframe outlook will be shared later.

S&P Bullish Flag developing supported at 6180Trump Softens Tariff Stance:
Trump said the Aug. 1 tariff deadline isn’t firm, easing fears of an immediate trade war. US equity futures rose on hopes for more negotiation. Japan criticized the planned 25% tariff, calling it “truly regrettable.”
Texas Floods – Trump to Visit:
Over 100 people died in the Texas floods, including 27 children. Trump said he’ll visit the state Friday to support recovery efforts. The news may draw attention to infrastructure and emergency response spending.
Apple Loses AI Chief to Meta:
Apple’s AI lead, Ruoming Pang, is leaving for Meta’s new AI unit. This raises more questions about Apple’s AI strategy, while Meta’s aggressive hiring supports its tech edge.
US Resumes Ukraine Weapons Aid:
Biden will restart weapons shipments to Ukraine, reversing a previous pause. This could support defense stocks, though broader market impact is limited for now.
Takeaway:
Markets welcomed Trump’s trade flexibility, lifting sentiment. Watch tech and industrials as traders react to shifts in AI leadership and trade policy.
Key Support and Resistance Levels
Resistance Level 1: 6290
Resistance Level 2: 6340
Resistance Level 3: 6400
Support Level 1: 6180
Support Level 2: 6120
Support Level 3: 6065
This communication is for informational purposes only and should not be viewed as any form of recommendation as to a particular course of action or as investment advice. It is not intended as an offer or solicitation for the purchase or sale of any financial instrument or as an official confirmation of any transaction. Opinions, estimates and assumptions expressed herein are made as of the date of this communication and are subject to change without notice. This communication has been prepared based upon information, including market prices, data and other information, believed to be reliable; however, Trade Nation does not warrant its completeness or accuracy. All market prices and market data contained in or attached to this communication are indicative and subject to change without notice.

Stocks Are Crushing It at Record Highs. What’s Behind the Rally?Happy record highs, everyone — confetti, champagne, and yet another all-time high. The Nasdaq NASDAQ:IXIC and the S&P 500 SP:SPX just did it again — notched fresh closing records that have traders flexing their P&Ls like it’s 1999.
If you’ve been on the sidelines, you’re probably staring at the chart asking: How did we add trillions to market cap while my grocery bill still looks like a high-yield bond payment?
Good question. Because these days, stocks are behaving like they live on a separate planet from the actual economy (looking at you, Nvidia NASDAQ:NVDA ).
Let’s pop the hood and see what’s revving this record-breaking machine — and what potholes might lurk ahead.
🤫 Nasdaq: The Comeback Kid of 2025
Take the Nasdaq Composite NASDAQ:IXIC — your favorite tech playground — up a mind-boggling 32% since the April lows . One-third of its total value was minted in three months — as much as $7 trillion added in.
What happened? Well, start with the obvious: the Magnificent Seven are doing the heavy lifting again. Nvidia NASDAQ:NVDA , Microsoft NASDAQ:MSFT , Apple NASDAQ:AAPL , Amazon NASDAQ:AMZN , Alphabet NASDAQ:GOOGL , Meta NASDAQ:META , Tesla NASDAQ:TSLA — they’re the gym rats of this rally.
But here’s the kicker: while the headlines are all “index record highs,” the Mag 7 as a whole are actually down slightly for the year. The hero’s cape belongs mostly to a few standouts: Meta, up 21% this year. Microsoft, up 17%. And Nvidia? Not bad: up a whopping 65% since the April swoon.
When the generals lead, the army follows — at least until they don’t?
🤖 S&P 500: Powered by 7, Dragged by 493
The broad-based S&P 500 also clocked a new record close at 6,173.07 . Everyone loves to toast a new all-time high, but here’s your buzzkill: the “500” in S&P 500 is a bit of a myth these days.
The Magnificent Seven alone account for more than 30% of the index’s total weight. Last year, this elite club rose 57% while the other 493 stocks crawled up just 13%. Strip out the hyper-scalers, and you’ll find most stocks are still limping along, wrestling with tepid growth and stubborn inflation.
So yes — the S&P 500 is soaring. But the S&P 493? Not partying at the same rooftop bar.
💼 Conflicting Data: This Economy Ain’t It (Yet)
Here’s where it gets spicy: GDP actually shrank last quarter — down 0.5% year over year. Inflation is still running hot with May’s PCE figure at 2.7% (the Fed’s target is 2%).
Fed boss Jay Powell and the central bank squad are trying to thread the world’s tiniest policy needle: cut rates enough to juice the economy, but not so much that they stoke a fresh inflation flare-up.
Meanwhile, job numbers are a mixed bag , and corporate revenue hasn’t been setting new records to match those ceiling-high stock valuations.
In short, the disconnect between equity prices and economic reality is growing wider than the spread on your favorite meme coin during an illiquid Sunday afternoon.
👨🏻💻 Tariffs, Tweets, and the Trump Factor
And who could forget the wildcard factor? Trump’s new tariffs. The “reciprocal tariffs,” as he likes to pitch them. One day he’s threatening to slap 50% duties on everything from French wine to German cars. The next, he’s cozying up for “productive” chats with Brussels.
This policy whiplash makes supply chains sweat, but so far, equity traders are shrugging it off — and even cheering. Why? Because in Trump’s world, chaos means central banks might cut rates to cushion the blow. And nothing says “rocket fuel” for risk assets like lower borrowing costs.
Add to that the weird paradox that tariffs — while inflationary in the short run — can also weaken the dollar if the Fed turns dovish. A weaker greenback means US tech giants look cheaper to global investors. So… up we go.
🏛️ The Great Fed Cut Watch
Speaking of cuts: the Fed’s next meeting is in late July, and Wall Street is holding its breath. Rate cuts mean cheaper money — which often means traders load up on risk.
The market is currently pricing in a 90% chance of a cut in September (and an 80% chance of a hold in July). Meanwhile, gold OANDA:XAUUSD — the non-yielding safe haven — is selling off while traders are flocking toward the risk-end of the boat, leaving the safe-haven corner gathering dust.
👀 What’s Next? The Inevitable Hand-Wringing
So — should you pop champagne? Depends.
If you’re a trend follower, record highs are record highs. Momentum is your friend. But if you’re a value purist, these multiples probably make your eye twitch.
Big question: when does this all get too frothy? Will the next earnings season justify these valuations? Markets are forward-looking anyway — even if big tech’s revenue flops, that doesn’t mean money will flow out of the market cap.
After all, we’re halfway through the year and that means it’s time to pop open the Earnings calendar for those spring reports.
Any dip right now may very well be seen as an opportunity to swoop in at a lower price, not as something that indicates there’s something fundamentally wrong with the business.
🫶🏻 The Takeaway: Celebrate, but Stay Focused
The rally is real. The headlines are dazzling. But the same lessons apply: trends don’t last forever, risk doesn’t disappear just because the chart is green, and the Magnificent Seven won’t carry the world on their backs indefinitely.
So have your stop losses placed right, your position sizes sensible , and your eyes on the macro backdrop. Because record highs are fun, but holding the bag isn’t.
Off to you : Are you riding this rocket or waiting for the next dip? Drop your take below — are we so back, or about to crack?

Major resistance level for the S%P 500the s and p 500 have been on an uptrend but reems some correction might take place soon
Gap down is likely a bear trap - SPYSo the gap down looked bearish but the technicals are not confirming it. One more high is likely today or Monday. Gold is at resistance here. OIl found support and looks like a long. BTC rallied and can go higher but it's putting in daily bearish divergences. Natural Gas looks like it will bounce.

S&P to go down a bit....good time to hop on UVIX!Saw this from a mile away. We are now at the cross hair between high tariffs and the tail-end of a week long rally that was mostly based on hot air. What's next? Gravity will prevail.
The VIX has been at super low levels historically. UVIX is a nice 2X! Jumped like 4% already today and there's way more upside. Best of luck and always do your own due diligence.

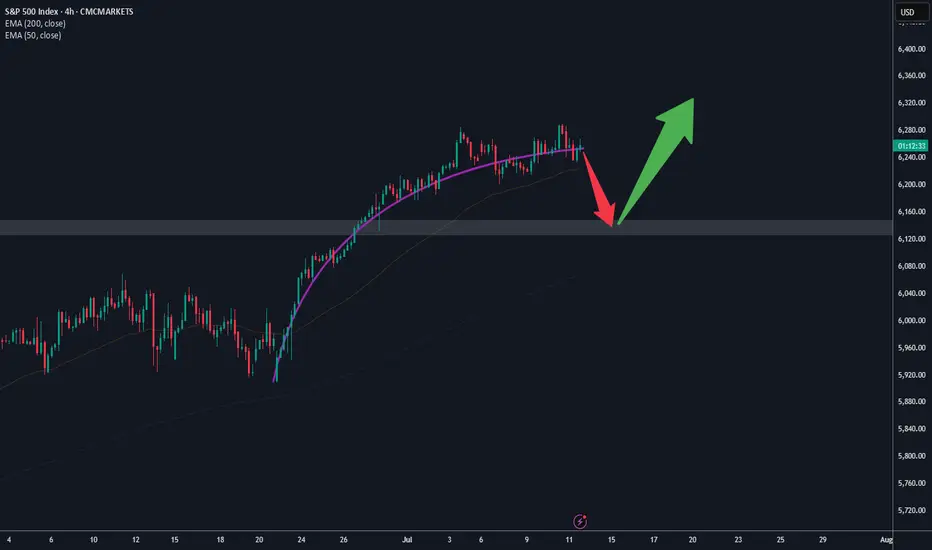
Short Term Risk On S&PMomentum is slowing on the S&P 500.
HT still looking nice.
Short term chance of a correction to around 6140 - conservative, potentially to 6070 if we see a deeper sell off.
Wouldn't want to be a buyer until we see a pullback like this or some strength.
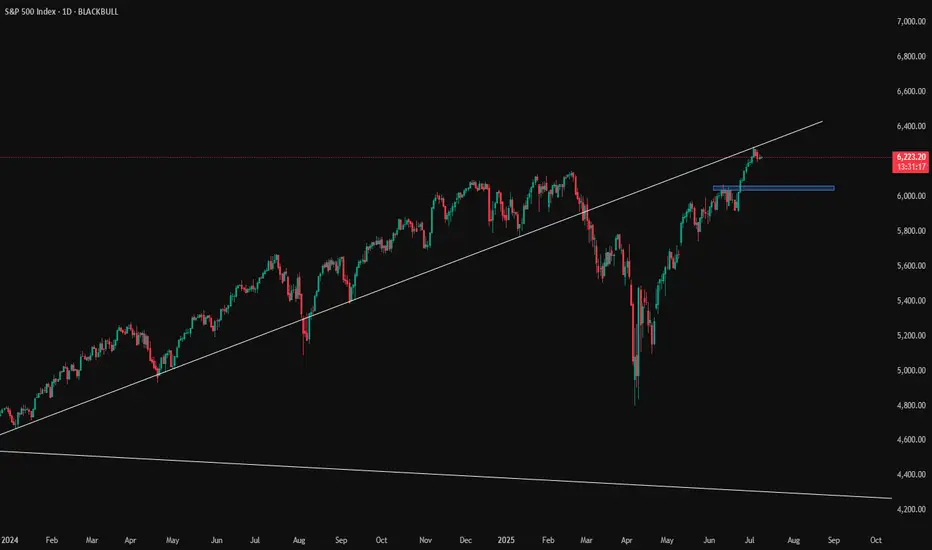
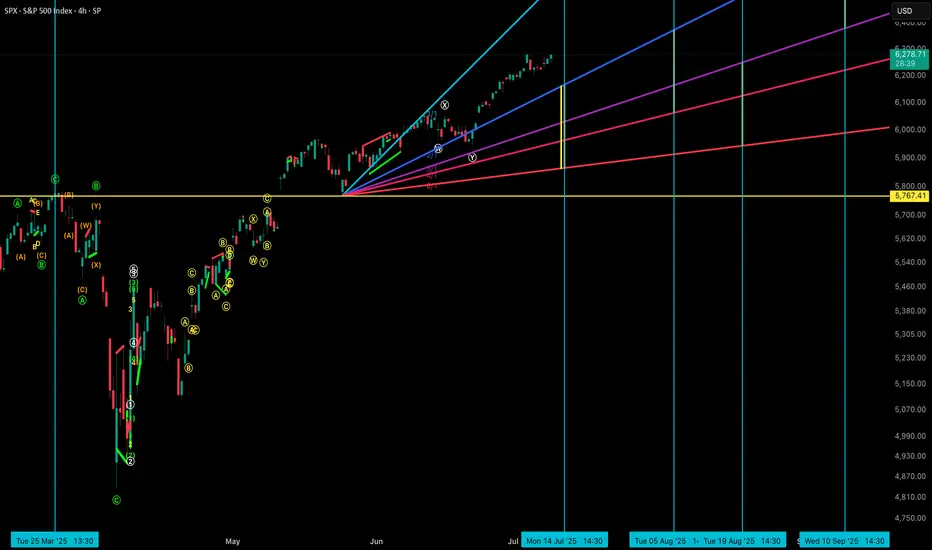
S&P 500 (SPX) – Gann & Market Timing Outlook!We're currently leaning towards a bullish melt-up scenario into August 2025, supported by both price structure and Gann time analysis.
🔹 Key Gann Time Clusters:
11th July 2025
14th July 2025
These dates may act as pivotal turning points. The ideal scenario for bulls would be a short-term pullback into the 15th–16th July window, which could then confirm the next major leg up.
📈 Price action is riding strongly above the 1/1 and 2/1 Gann angles – a clear sign of accumulation and strength. The setup aligns well with a continued rally targeting August 2025 as a significant cycle top before any serious correction unfolds.
🎯 Watch the coming days closely. If we get a healthy dip, it may be your best buy-the-dip opportunity ahead of a major move.
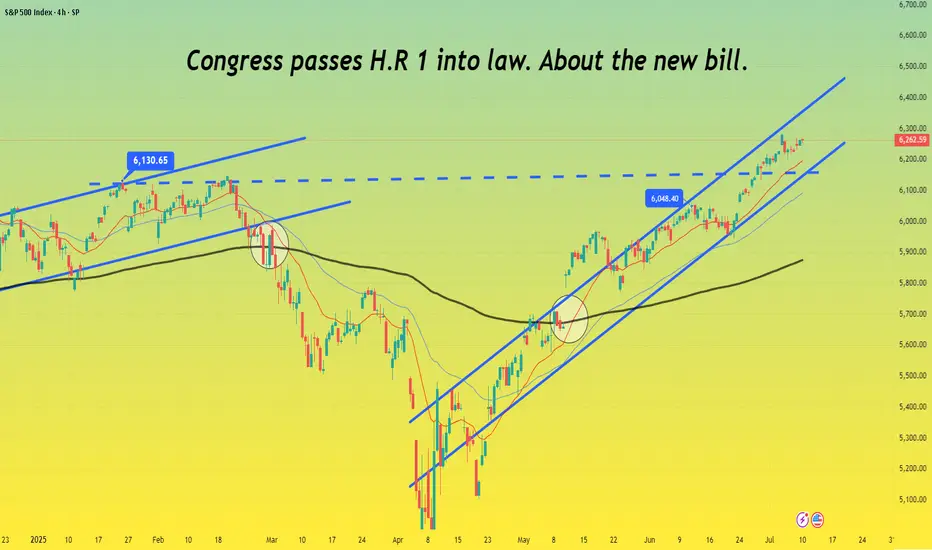
Congress passes H.R 1 into law. About the new bill.🔵 In what's been an eventful last few weeks congress passed H.R 1 which is essentially Trump's 900 page mega bill Act. Both Democrats and Republicans ultimately united against each other over the bill with Vice President Vance casing the tiebreaking vote giving Senate Republican's the large legislative victory.
🔵 To note is that independent-minded Republican Lisa Murkowski, senator of Alaska had some concerns with the bill before GOP negotiators we're able to acquire her vote for the 50-50 votes. Murkowski's primary issue was with the legislation's changes to Medicaid and federal food assistance funding which she was concerned would hurt her home state understandably. Republican's originally tried to sway her vote by adding language to shield Alaska from the full effect of the legislation's Medicaid and SNAP cuts.
🔵 Parliament opposed that as it violated the Byrd Rule which is there to determine the legislation that can go into a budget reconciliation package as well as passing with only GOP votes. Least to say the amendment was reworked many times in order for the waivers for the SNAP funding cuts to apply more broadly than just Alaska and Hawaii. Parliament rejected the prior amendment and language which targeted just the two states understandably.
🔵 With the rework the new SNAP provisions are planned to reduce food assistance funding more slowly in about 10 states with the number ultimately being decided by a formula and based on the error rate in delivering food assistance benefits in a year. After an arduous process the amendment was passed and Republican's secured the vote with Murkowski saying it was an agonizing process.
🔵 When speaking with reporters afterwards Murkowski noted that the process was stressful with them operating under an artificial timeline in reference to the pressure Trump put on the Senate to pass the bill.
🔵 Her concern was as follows: “Rather than taking the deliberative approach to good legislating, we rushed to get a product out. This is important. I want to make sure that we’re able to keep in place the tax cuts from the 2017 Jobs Act,” said Murkowski when asked about her support for the bill and why it was hard for her to come around to giving her vote.
🔵 “I struggled mightily with the impact on the most vulnerable in this country when you look to the Medicaid and the SNAP provisions,” said Murkowski. This point highlights just how the effort to push the bill through was met with haste and pressure notably.
🔵 The bill itself is projected to add $2.8 trillion to the federal deficit by 2034. Main reason for that would be thanks to a reduction in revenues as well as interest cost which could have the deficit rise by a potential $5 trillion if some temporary provisions become permanent. Interest payments on the national debt are also expected to increase significantly by 2034.
🔵It should be noted that these numbers and estimates are based on a "current law" baseline and are largely thanks to tax cuts in the bill with Economist having differing opinions on the economic impact of the bill. Time will tell us how estimates go but least to say this is a large turnaround from what many we're expecting with even DOGE's Elon Musk opposing the Bill and forming a new party in strong opposition.
🔵 The tax and spending bill will see spending increase and phase in a cut to Medicaid of an estimated $1 trillion over the next decade with the CBO projecting roughly 11.8 million more American's t hat would become uninsured within the next 10 years compared to the current law. This could lead to many losing healthcare services due to medical cost with states as well likely needing to adjust their own programs and having to take on a larger share of the cost whether that means reducing services or even closing some facilities.
🔵 The bill has many key changes but in summary it solidifies many tax breaks from Trump's first term with an estimated $4.5 trillion in tax cuts alongside tax deductions on tips, overtime and auto loans with deductions for adults that make under $75,000 and a boost to the child tax credit from $2,000 to $2,200 though millions of families at lower income levels would still not receive the full credit as one of the credit's, requirements is a minimum earned income of $2,500. In 2022 alone an estimated 18 million children under age 17 (26 of all children) were ineligible for the full child Tax credit because the family income was not high enough as reported by Columbia University's Center on Poverty and Social Policy.
🔵 To say in the least the new bill has many implications for the country and the next few months and years will definitely represent those changes and how the country shifts and adjusts to this with many having differing opinions understandably. I'll definitely keep you guys posted through it all but definitely a lot to see so much happen so quick and only time will tell and show us just how things play out simply put. The market itself is still continuing within this ascending channel, especially since we got that convergence with the 200 EMA and broke that $6,130 resistance. $6,300 is what I'm expecting resistance to hit the strongest so definitely gonna keep an eye there as traders process the news and changes.
🔵 Have to go but grateful as always for the support, definitely a long idea here but wanted to focus on some important points though the bill itself has so many changes it's hard to go over every one but you get the point. This is a big changes and we'll definitely see things shift a lot over the next few months and years and as always we'll keep posted with things. Thanks as always and all the best.
Best regards,
~ Rock'
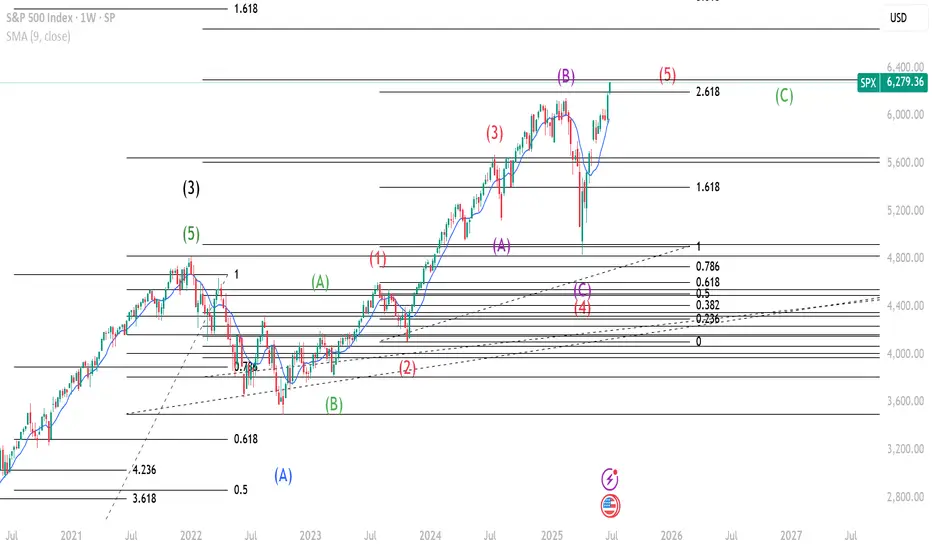
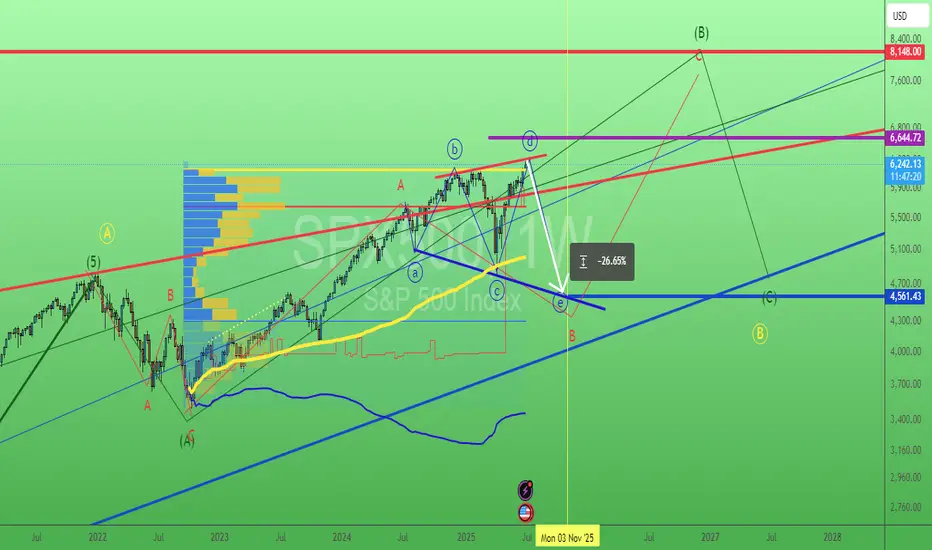
S&P 500 and the Elliott Wave TheoryAnalysis shows that the Wave 3(Black) correction is a Flat because Wave 2(Black) was a Zigzag. From the ending of Wave 3(Black), we see a shallow Wave A(Blue) forming. This is our first Wave of the 3 move correction. From A(Blue), another 3 wave move MUST occur and must go beyond the ending of Wave 3(Black) as seen. The correction of Wave A(Blue) is marked by an unfolding 3 wave move shown in Green. Waves A and B are formed after Wave A(Blue) completes. For the last 'leg' of the 3 Wave correction, we find a 5 Wave move shown in Red and this should contain all properties of a normal 5 wave move. Wave 1(Red) is followed by a Zigzag correction and we should expect a Flat correction at Wave 3(Red). Indeed a Flat is formed and is highlighted in Purple. Wave 4(Red) is complete. This sets in motion a last wave that upon completion would be the end of Wave C(Green) hence the end of Wave B(Blue) and would trigger the start of Wave 4(Black). Follow for breakdown of the same chart in the Daily time frame.