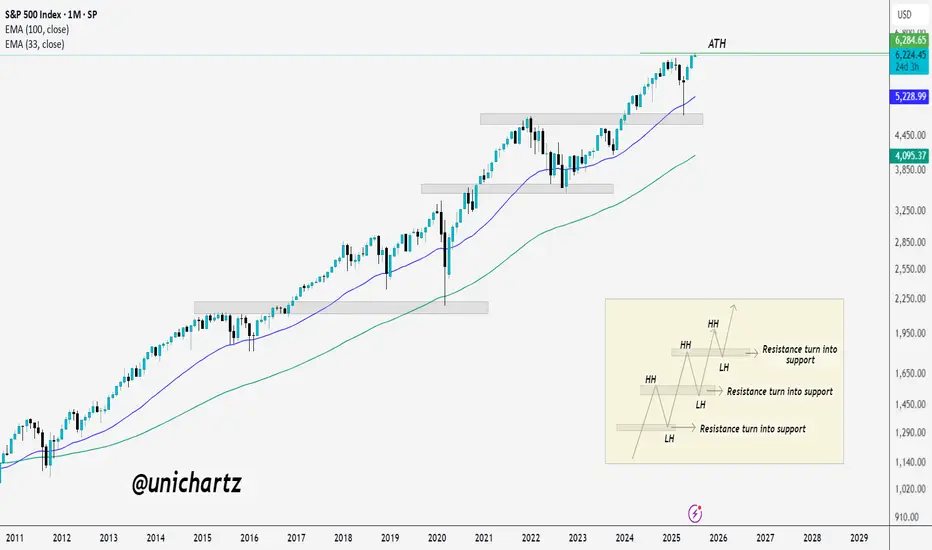
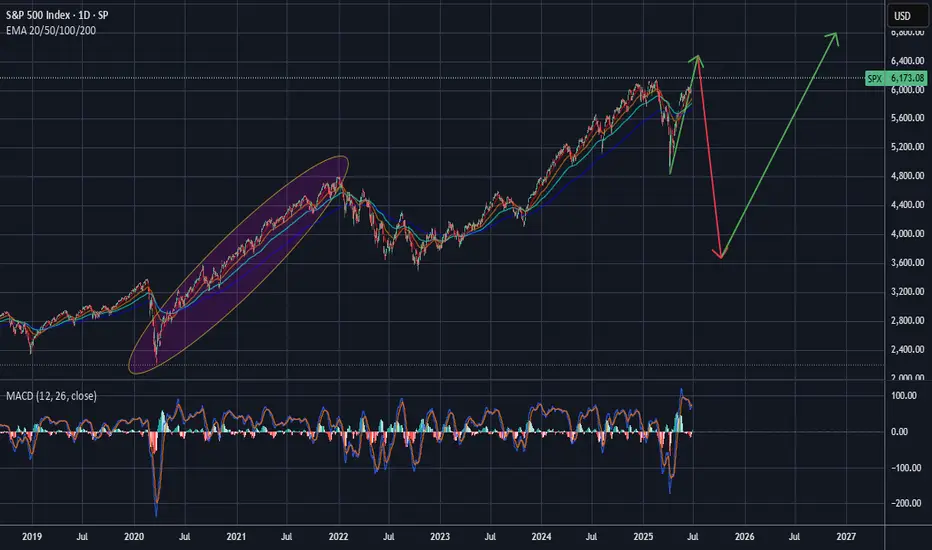
Decade-Long Uptrend Holds Strong – SPX Hits Fresh HighsS&P 500 Just Hit a New All-Time High (ATH) 🚀
The index has been in a strong uptrend for over a decade, consistently printing higher highs (HH) and higher lows (HL).
Every major resistance level has flipped into support, classic bull market structure.
Even during corrections, the 33 EMA and 100 EMA have acted like dynamic support zones.
Now that SPX has cleared its previous ATH, the structure remains intact, unless a strong breakdown occurs, momentum is still with the bulls.
SPX500USD trade ideas
Gold Bullish for 2 months followed by 3 months of Bearish?An interesting pattern developed on Gold for the monthly that could indicate 2 months of Bullish order flow to 3600 - 3800 area followed by 3 months of bearishness to 3000 - 3100 area.

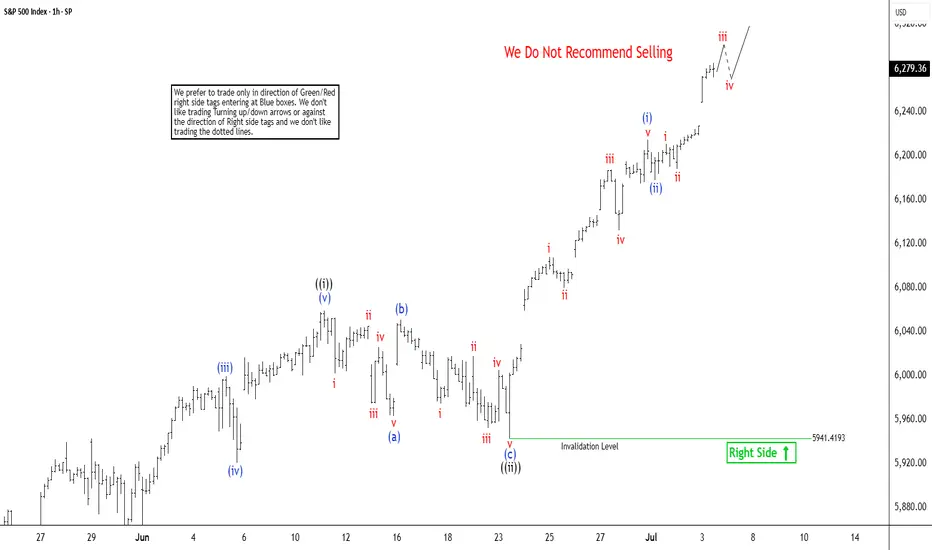
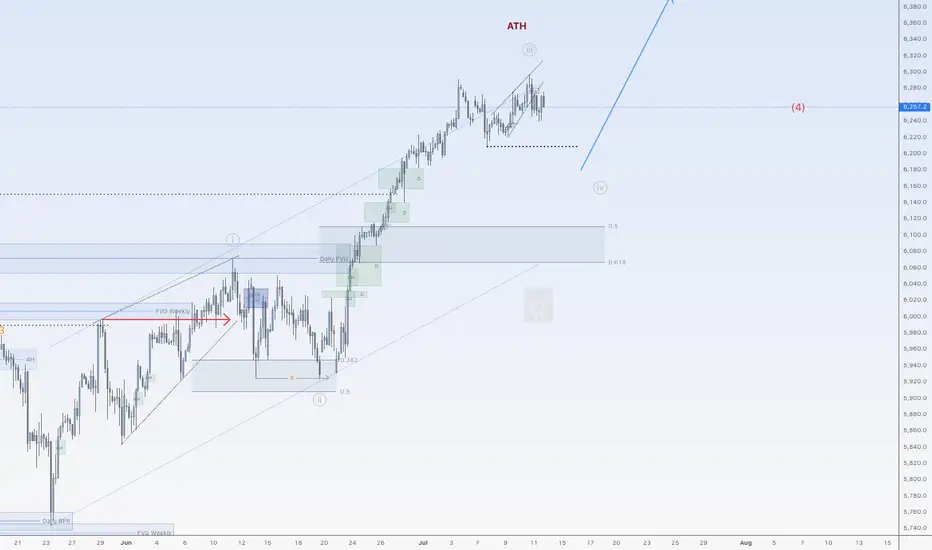
S&P 500 ($SPX) Nests Upward in Strong RallySince bottoming out on April 7, 2025, following the tariff war selloff, the S&P 500 (SPX) has sustained a robust rally. The Index is reaching new all-time highs in a clear Elliott Wave impulsive structure. Technical analysis, particularly momentum indicators like the Relative Strength Index (RSI), shows no divergence at the latest peak. This indicates sustained bullish momentum and suggests the rally remains within the third wave of the Elliott Wave sequence. From the April 7 low, wave 1 concluded at 5968.6. A corrective wave 2 followed which ended at 5767.41. The index has since nested higher within wave 3, demonstrating strong upward momentum.
Breaking down the substructure of wave 3, the hourly chart below reveals that wave ((i)) peaked at 6059.4. The subsequent pullback in wave ((ii)) unfolded as a zigzag pattern. Wave (a) declined to 5963.21, and wave (b) rebounded to 6050.83. Wave (c) concluded at 5941.4, completing wave ((ii)) in the higher degree. The index has since resumed its ascent in wave ((iii)). Up from wave ((ii)), wave (i) reached 215.08 and a minor pullback in wave (ii) ended at 6177.97.
The SPX is expected to continue its upward trajectory, with potential pullbacks finding support in a 3, 7, or 11 swing against the 5941.4 level, setting the stage for further gains. This analysis underscores the index’s bullish outlook, supported by technical indicators and Elliott Wave structure, as it navigates higher within this impulsive cycle.
The market bias stays up, MJ stocks may be a buy here. The market continues to be biased up, and the target is likely the weekly B. MJ stocks are showing technical signs that a reversal may come. There may be other sectors similar as I think the summer bottom gamblers will start appearing now that everything else is at the highs. Gold looks like it will eventually go lower. Nat gas lost support and is likely to go lower. USOIL is bear flagging.

SHORT ON SPY (SPX/USD)SPY has a double top and is currently pulling back to a supply zone.
I expect spy to drop to the next demand level or FVG to the downside.
This is a sell limit order. Waiting for price to reach the supply area before taking the sell.

S&P 500 Daily Chart Analysis For Week of July 11, 2025Technical Analysis and Outlook:
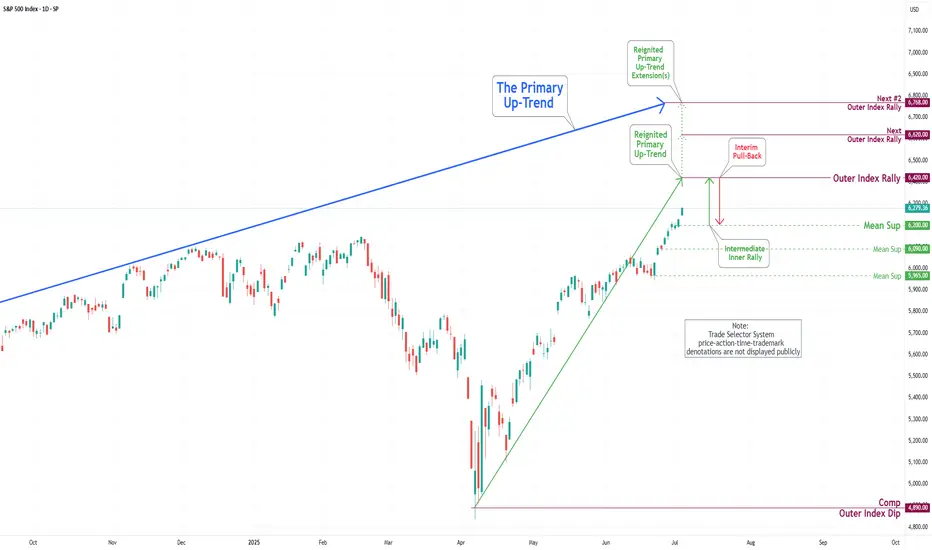
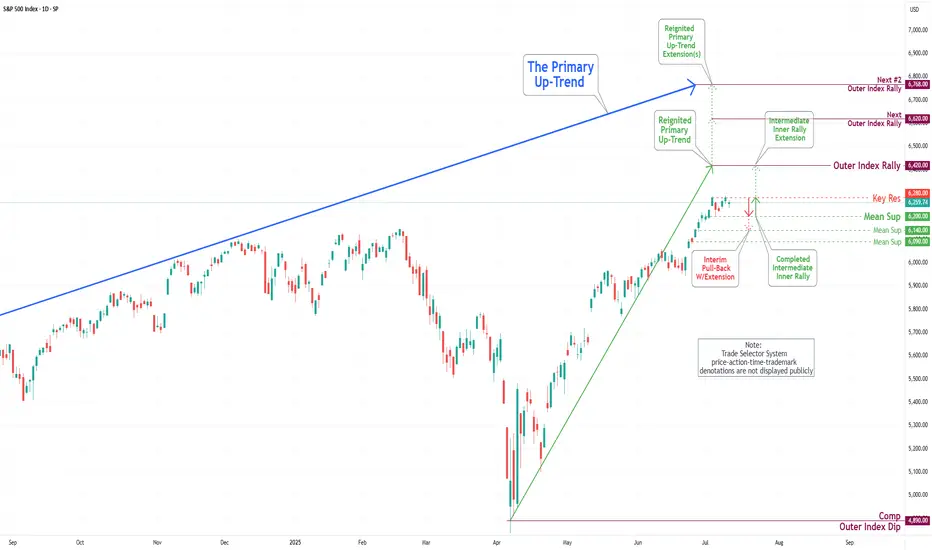
During this trading week, the S&P 500 Index has shown a predominantly downward/upward course of action and created a new Key Resistance at 6280. Currently, the index exhibits a bullish bias, with the Outer Index Rally objective set at 6420. However, it is crucial to note that the current price action may cause prices to see in a new light from their current fluctuation to push toward the Mean Support at 6200 before resuming their upward movement.
$SPX Today’s Trading Range and everything in it /// 7.11.25
Beautiful start here right at the bottom of the expected move. 6245/6230 bull put spreads right at open filled. Just look at the chart to see how I came up with that.

S&P500 Bullish continuation developing close to ATHUS Secretary of State Marco Rubio is meeting Russian Foreign Minister Lavrov today at an ASEAN summit, as tensions remain high over the war in Ukraine. President Trump has criticized Putin and pledged more weapons for Ukraine. Meanwhile, Ukrainian allies are meeting in Rome to plan postwar rebuilding.
Trump also announced new tariff plans—50% on Brazil and 20% on the Philippines, though further talks are expected. He said a temporary ceasefire between Israel and Hamas could be close, possibly within weeks.
In business news, X CEO Linda Yaccarino is stepping down, Meta faces a competition warning in France, and Wall Street banks are preparing financing for a $4.25 billion Boots buyout. Nvidia became the first company ever to hit a $4 trillion market value, boosted by strong investor demand.
US Equity Outlook:
Markets may trade mixed. Nvidia’s historic surge could lift tech stocks, but geopolitical tensions and trade uncertainty may limit gains. Investors will watch for more updates on tariffs and global talks.
Key Support and Resistance Levels
Resistance Level 1: 6290
Resistance Level 2: 6340
Resistance Level 3: 6400
Support Level 1: 6180
Support Level 2: 6120
Support Level 3: 6070
This communication is for informational purposes only and should not be viewed as any form of recommendation as to a particular course of action or as investment advice. It is not intended as an offer or solicitation for the purchase or sale of any financial instrument or as an official confirmation of any transaction. Opinions, estimates and assumptions expressed herein are made as of the date of this communication and are subject to change without notice. This communication has been prepared based upon information, including market prices, data and other information, believed to be reliable; however, Trade Nation does not warrant its completeness or accuracy. All market prices and market data contained in or attached to this communication are indicative and subject to change without notice.

$SPX Tomorrow’s Trading Range and everything in it /// 7.10.25Today’s Trading range and everything in it. How are you playing it?

Sp500S&P 500 (SPX) Technical Update:
Closing Price: 5648.39 (as of last week’s close)
Outlook: The SPX appears poised for a potential rally, with immediate resistance levels identified at 5700.00, 5800.00, and 6000.00. Based on current technical indicators and market conditions, a continuation of the bullish trend to the 5800.00 level within the next month seems plausible.
Technical Indicators Supporting a Bullish Move:
Moving Averages: The SPX is currently trading above its 50-day and 200-day moving averages, indicating a strong bullish trend. The positive crossover between these moving averages often signals sustained upward momentum.
Relative Strength Index (RSI): The RSI is currently positioned in the bullish zone (above 50) and has not yet reached overbought conditions. This suggests that there is room for further upside before any potential reversal.
MACD (Moving Average Convergence Divergence): The MACD line is above the signal line, and the histogram is in positive territory. This indicates that the momentum is favorable and supports the possibility of further gains.
Volume: Recent upward movements have been accompanied by increasing trading volume, which validates the strength of the rally and suggests that buying interest remains robust.
Summary: Given the strong technical indicators and the current market environment, the SPX is well-positioned to advance towards the 5800.00 level over the next month. Current buying opportunities appear favorable for potentially significant gains.

More upside after correction for SPX500USDHi traders,
Last week SPX500USD went a little more up (diagonal) just as I've said in my outlook.
Next week we could see the start of a bigger correction down (grey wave 4) and a break of the dotted trendline. Or the diagonal is a leading diagonal wave 1 and grey wave 3 extends more.
Let's see what the market does and react.
Trade idea: Wait to see if price breaks the dotted trend line (for shorts) or not (for longs).
If you want to learn more about trading FVG's & liquidity sweeps with Wave analysis, then please make sure to follow me.
This shared post is only my point of view on what could be the next move in this pair based on my technical analysis.
Don't be emotional, just trade your plan!
Eduwave
SPX500 Formed false breakout Bearish Bias 6,205 SP500 Short-Term Bearish Bias
The SPX500 remains under pressure as it trades below the key resistance level of 6260. Price action suggests a potential rejection from this resistance, signalling a continuation of downside momentum.
This bearish sentiment is further fuelled by recent tariff escalations by President Trump, which are weighing heavily on investor sentiment across global indices.
You can see more details in the chart Ps Support with like and comments for more analysis Thanks for supporting.

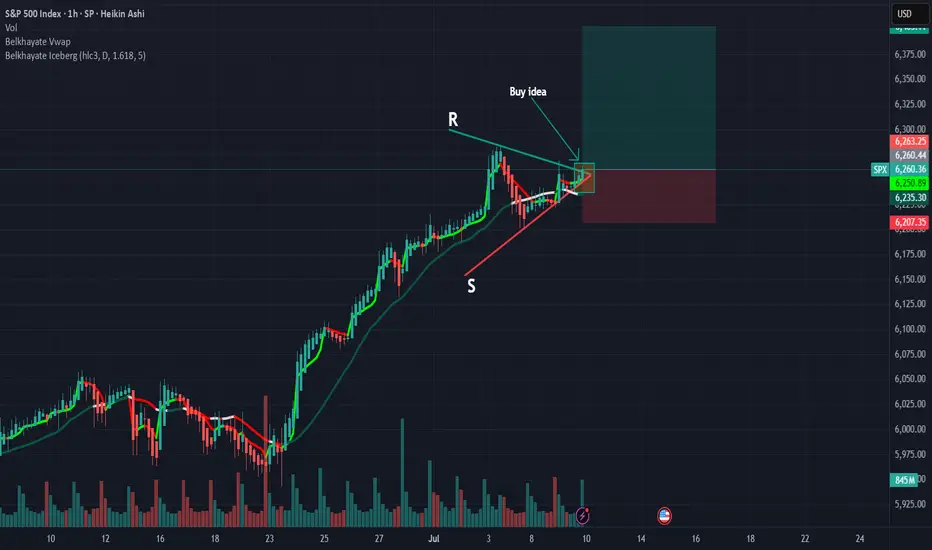
SPX: Buy ideaBuy idea on SPX as you can see on the chart because we have a good intersection between resistance line and the support line.
Dummy ideaFastest Way to Create an Idea on TradingView
Here’s a step-by-step guide to quickly publish an idea (analysis, chart, or setup) on TradingView:
1. Prepare Your Chart
• Open TradingView and set up your chart with all desired indicators, drawings, and timeframes.
2. Open the Publish Idea Window
• Shortcut: Press `Alt + P` on your keyboard to instantly open the “Publish Idea” window.
• Or: Click the Publish button at the top-right corner of your chart.
3. Fill Out the Required Fields
• Title: Enter a clear, descriptive title for your idea.
• Description: Write a brief explanation of your analysis or setup.
• Category: Select the appropriate category (e.g., Analysis, Tutorial).
• Direction: Mark your idea as Long, Short, or Neutral.
• Privacy: Choose Public or Private.
• (Optional) Add tags and related ideas for better visibility.
4. Publish
• Confirm you agree to the House Rules.
• Click Publish Idea.
Acorn's Smart Money S&P SignalJuly 2, 2025 - S&P broke to the upside confirming a bullish S&P signal. If correct, the bullish S&P indicator suggests the S&P will close above 6177.97 on July 17. Let’s see if the market can continue to the upside!
S&P 500 Hit Record High Ahead of Holiday BreakS&P 500 Hit Record High Ahead of Holiday Break
Today, financial markets in the United States are closed in observance of Independence Day. Investor sentiment was likely buoyed by the latest rally in the S&P 500 index (US SPX 500 mini on FXOpen), which set a new all-time high yesterday, surpassing 6,280.
The bullish momentum has been driven by robust labour market data in the US. According to ForexFactory, analysts had anticipated a rise in the unemployment rate from 4.2% to 4.3%, but instead, it unexpectedly declined to 4.1%.
Can the stock market continue to climb?
Technical Analysis of the S&P 500 Chart
Analysing the 4-hour chart of the S&P 500 index (US SPX 500 mini on FXOpen)on 30 June, we observed the following:
→ An ascending channel was formed (indicated in blue);
→ A developing bullish impulse (marked with an orange line) suggested the price would move towards the upper boundary of the channel – a scenario that materialised with yesterday’s rally (as shown by arrow 1).
However, from a price action perspective, the recent downward move (arrow 2) has now gained significance. It may indicate that sellers are becoming more active around the identified resistance level.
Should the price decline towards the lower orange line, this could negate the current bullish impulse altogether, effectively reflecting a classic bearish engulfing pattern.
Given the above, there is reason to believe that bears are attempting to regain control after the S&P 500 (US SPX 500 mini on FXOpen) surged over 5% in the past 10 days. As such, a potential breakout below the orange line cannot be ruled out, with price action possibly targeting the median of the blue ascending channel.
What happens next?
The market’s trajectory will largely hinge on developments related to tariffs. Trade policy will remain in the spotlight next week, as key deadlines set by the White House approach — events that traders will be closely monitoring.
This article represents the opinion of the Companies operating under the FXOpen brand only. It is not to be construed as an offer, solicitation, or recommendation with respect to products and services provided by the Companies operating under the FXOpen brand, nor is it to be considered financial advice.
July Doesn't Disappoint - S&P Nasdaq Dow Russell All RunningS&P All Time Highs
Nasdaq All Time Highs
Dow Jones closing in on All-Time Highs (and outperforming both S&P and Nasdaq recently)
Russell 2000 playing catch up and moving higher
This is melt-up at its finest
Since US/China Trade Agreement and Middle East Ceasefire Agreement, markets have used
these two events as further catalysts to continue the upside runs
Stochastic Cycle with 9 candles suggesting a brief pause or pullback in the near-term, but
a 3-5-10% pullback is still an opportunity to position bullish for these markets
I'm only bearish if the markets show that they care with price action. The US Consumer isn't breaking. Corporate Profits aren't breaking. Guidance remains upbeat. Trump is Pro Growth and trolling Powell on the regular to run this economy and market HOT demanding cuts (history says that's a BUBBLE in the making if it's the case)
Like many, I wish I was more aggressive into this June/July run thus far, but I'm doing just fine with steady gains and income trades to move the needle and still having plenty of dry powder
on the sidelines for pullbacks
Markets close @ 1pm ET Thursday / Closed Friday for 4th of July
Enjoy the nice long weekend - back at it next week - thanks for watching!!!

SPX VS OILHello there.
30 years low cycle is coming to end for OIL and energy.
Every 30 years, market of energy bottom against SPX.
When buy SPX AND NAS ? Each 30 years.
1920->1950->1980->2010->2040
When Sell SPX AND NAS ? Each 25-30 years
19401->970-2000->2025-30->2055-60
Sell SPX WHEN atm ? Well.. follow the last uptrend (blackline), sell when break
Recession always come when Energy > SPX
So.. keep an Eyes on Energy.
S&P 500 Outlook. Best Quarter Since 2023… But What Next?The S&P 500 just logged its best quarterly performance since Q4 2023 , surging on optimism around global trade negotiations and growing expectations that the Fed may begin cutting rates as early as September. US futures are green this morning, thanks to developments like Canada backing off digital taxes, ongoing dialogues with China ahead of the July 9 deadline, and risk-on sentiment is pushing yields and the dollar lower.
But as traders, we need to ask:
Are we witnessing a genuine economic inflection point? Or is this just a liquidity-driven rally that’s pricing in a best-case scenario?
Technical View
Support Zone: 6,150 was just broken through. And 6000, the round number level, coinciding with the 20-day EMA and previous swing level.
Resistance Levels: 6,235 is the next critical ceiling, a clean breakout could see price reach the extension level of 6,415.
Momentum Indicators: RSI remains elevated and is creeping toward the overbought. While momentum is strong, watch out for the possible development of a divergence.
Possible Scenarios
The 'Soft Landing’ Is Now the Base Case
Markets are trading as if the Fed has successfully engineered a soft landing. But that’s now fully priced in, and historically, the most dangerous trades are the ones everyone agrees on. If trade talks stall, inflation re-accelerates, or earnings disappoint, the reversal could be brutal and fast.
Risk-on Sentiment Without Volume Is a Yellow Flag
Despite the price strength, volume has been tapering off. The S&P’s recent leg up occurred on lighter-than-average participation, suggesting institutions may be watching, not chasing. That’s often the case in low-volatility summers, but it also implies that any negative catalyst could cause outsized downside moves.
Macro-Fundamentals May Not Justify Valuation Expansion
Yes, inflation is slowing, and the Fed might cut. But if they do, it’s likely because growth is weakening, not because the economy is roaring. So the very condition that triggers rate cuts could also cap earnings growth!
Projection
Bullish Scenario: A confirmed breakout above 6,280 could carry us toward 6,400–6,500 by mid-Q3, especially if the trade deals progress, July inflation comes in soft, and the Fed signals accommodation.
Bearish Risk: If price fails to hold above 6,120, especially if trade optimism fades, or inflation growth spikes or Fed rhetoric shifts hawkish again, this could then open a quick pullback toward 6,000 or lower, which also aligns with the 50-day SMA.
Key Events to Watch
July 9 Trade Talks Deadline: Any sign of stalling could bring volatility back fast.
June CPI Print (July 10): Crucial for confirming the Fed's next move.
Earnings Season Kickoff (mid-July): Tech-heavy expectations may not be easy to beat after such a strong run.
Conclusion
A record-setting quarter is impressive but not necessarily predictive. This quarter’s rally has been built more on relief and expectations than hard data. When expectations (not earnings) are doing the heavy lifting, any misstep from central banks or geopolitics could unravel gains rapidly.
A rate cut might be delayed, or inflation re-accelerates, or trade talks stall; any of these could leave equities hanging. Remember: the higher the climb without real earnings growth, the harder the fall when sentiment shifts. It's not just about the chart. It is about the narrative behind the price.
What’s your bias for Q3?
Are you buying this breakout or fading the optimism? Drop your thoughts below.
US500 Eyes 6317 and 6510 After Historic BreakoutUS500 Eyes 6317 and 6510 After Historic Breakout
The US500 has broken out above its previous all-time high near 6147, following news of a ceasefire agreement between the U.S., Israel, and Iran.
Since then, equity markets have surged, with indices leading the rally.
US500 has now reached a fresh all-time high at 6220, confirmed by a strong weekly candle close above the former peak, adding technical value to the breakout.
Looking ahead, the US500 appears poised to extend its gains toward the 6317 and 6510 levels on the daily chart.
A stronger-than-expected Non-Farm Payroll (NFP) report could further fuel this bullish momentum.
You may find more details in the chart!
Thank you and Good Luck!
PS: Please support with a like or comment if you find this analysis useful for your trading day
SPXI've been waiting patiently for a real correction in everything, but my timing was drastically off. Looks like FOMO is still in charge. My guess, stock market to ATH after ATH for a while and a final wave of FOMO for crypto will enter the air.
I believe the majority are expecting a COVID-like rebound, followed by rally continuation, but the majority tends to be wrong.
What I can tell you is the true crypto bull run will not begin on optimism, as it has been...
It will begin on pessimism.
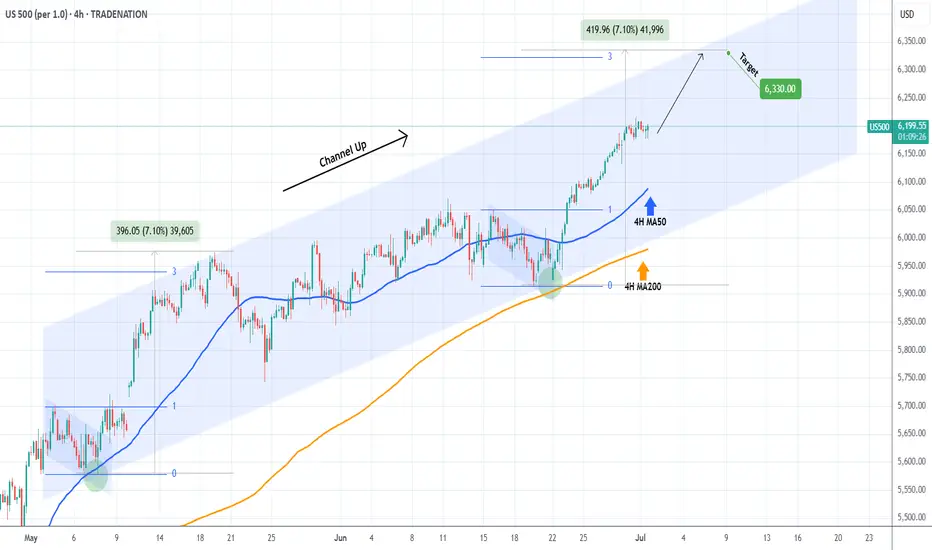
S&P500 Bullish Leg not over yet.The S&P500 index (SPX) has been trading within a Channel Up since the May 07 Low and is currently unfolding the latest Bullish Leg.
As you can see, it is far from having topped, not just by a plain trend-line (Higher Highs) perspective but also based on the Fibonacci and % rise terms relative to the previous Bullish Leg.
That peaked after a +7.10% rise, a little above the 3.0 Fibonacci extension. As a result, a 6330 Target on the short-term is more than fitting.
-------------------------------------------------------------------------------
** Please LIKE 👍, FOLLOW ✅, SHARE 🙌 and COMMENT ✍ if you enjoy this idea! Also share your ideas and charts in the comments section below! This is best way to keep it relevant, support us, keep the content here free and allow the idea to reach as many people as possible. **
-------------------------------------------------------------------------------
Disclosure: I am part of Trade Nation's Influencer program and receive a monthly fee for using their TradingView charts in my analysis.
💸💸💸💸💸💸
👇 👇 👇 👇 👇 👇
S&P 500 Daily Chart Analysis For Week of July 3, 2025Technical Analysis and Outlook:
During this abbreviated trading week, the S&P 500 Index has primarily shown an upward course, hitting and surpassing our target for the Outer Index Rally of 6235. Currently, the index demonstrates a consistent bullish trend, with the following objective for the Outer Index Rally set at 6420, followed by forthcoming targets of 6620 and 6768. Nevertheless, it is crucial to acknowledge the current price action may cause prices to retrace from their current fluctuation to test the Mean Support at 6200 before resuming their upward movement.