S&P 500 - Sell in May, return anther day. The truth - 2025No doubt everyone has heard a variation of the phrase:
“Sell in May, return another day.”
In Wikipedia it is written:
“Sell in May and go away is an investment strategy for stocks based on a theory (sometimes known as the Halloween indicator) that the period from November to April inclusive has significantly stronger stock market growth on average than the other months. In such strategies, stock holdings are sold or minimised at about the start of May and the proceeds held in cash”
A public comment from last year:
“Over 100 years ago, the (practical) reason to sell in May and September, was to pay seasonal workers to seed the field (May) and to harvest (September). Caravans of landlords and farm owners went to New York to sell stocks and withdrew money from the banks to do payrolls
so for people without agricultural business, i'll say it's okay to hold in May”
If we are to take all this at face value then we should be unwinding our long term positions until the Autumn?
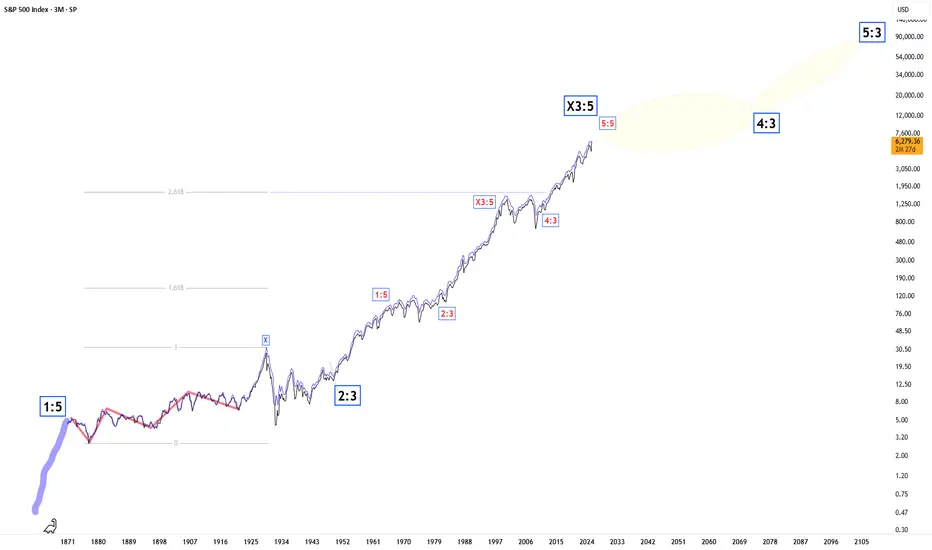
What does the chart say?
On the above monthly chart of the S&P 500 each vertical line marks the month of May going back to 2012. That is a dataset of 13 points.
The facts:
1) From the month of May onwards, 11 from 13 periods returned positive price action of not less than 10%. Selling in May was a bad choice.
2) 2015 and 2022 saw corrections of 15% from May onwards. However in both examples the correction was erased within 12 months as the index continued the uptrend.
In summary, 86% of the time a minimum return of 10% was seen before the year end. Amazing odds.
Furthermore, corrections up and until the end of April (like we’re now seeing) represented some of the best long opportunities.
Sell in May go away? I suggest it should be: Buy in June and watch it boom!
Ww
SPX500USD trade ideas

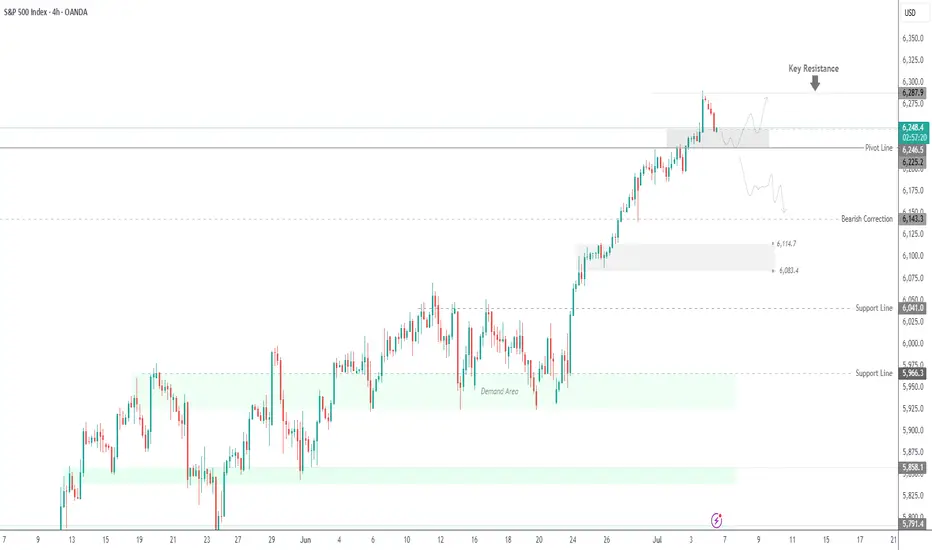
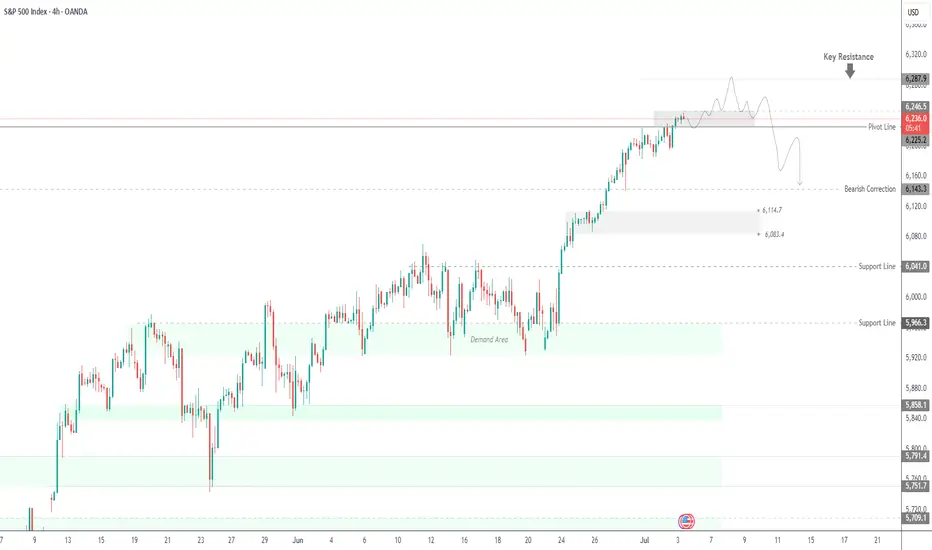
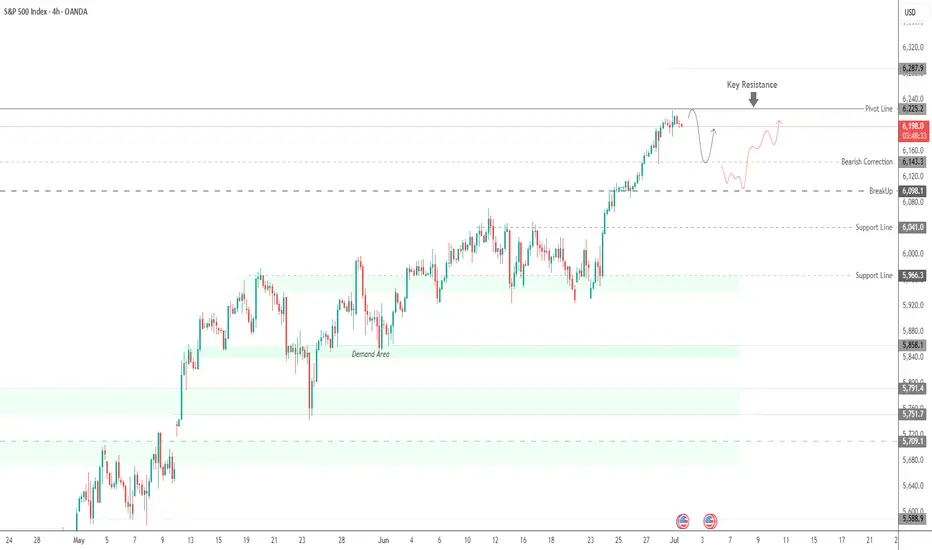
SPX500 Holds Above 6,225 – Bullish Trend Intact for NowSPX500 Update – Bullish Pressure Holds Above Pivot
SPX500 continues to show bullish momentum, as highlighted in our previous analysis. The price remains supported by strong buying volume above the key pivot zone at 6,225.
As long as the price stays above this level, a retest toward 6,225 remains possible before another leg higher.
However, a confirmed break below 6,225 would signal potential bearish momentum and shift the short-term structure.
Key Levels:
• Pivot Line: 6,246
• Resistance: 6,265 / 6,287 / 6,325
• Support: 6,225 / 6,191 / 6,143
How High is High Enough - welcome to the Void & VanityUS500 | ATH Extension and Rebalancing Outlook
What is going on beyond the surface? – Here is how I will anticipate next move.
Today , price carved a new All-Time High (ATH) , extending beyond Monday’s peak and breaching the previously defined Sell Limit Bound at 6173 .
6173 level capped prior upside and served as the structural ceiling on the weekly timeframe – would demand balance.
While price has cleared 6173 , failure to retain acceptance above it raises the possibility of a rebalancing phase —necessary before any sustainable bullish expansion. This retracement, if triggered, would offer clarity on whether this breakout is a continuation or merely a premature exploration into thin liquidity.
📌 Key Observations:
• 6173 – Breached, but yet to prove retention. A weekly close and reaccumulation above here is required to maintain bullish momentum.
• 6577–6408 – Marked as a hidden liquidity pool and potential upside target zone. Price may hunt for this range, but only if it holds structurally above 6173.
• Below 6173 – Failure to anchor here may trigger a rebalance into prior value areas before any serious upside projection takes form.
Price must find equilibrium before the next leg. Any upside without that balance risks collapsing under its own weight.
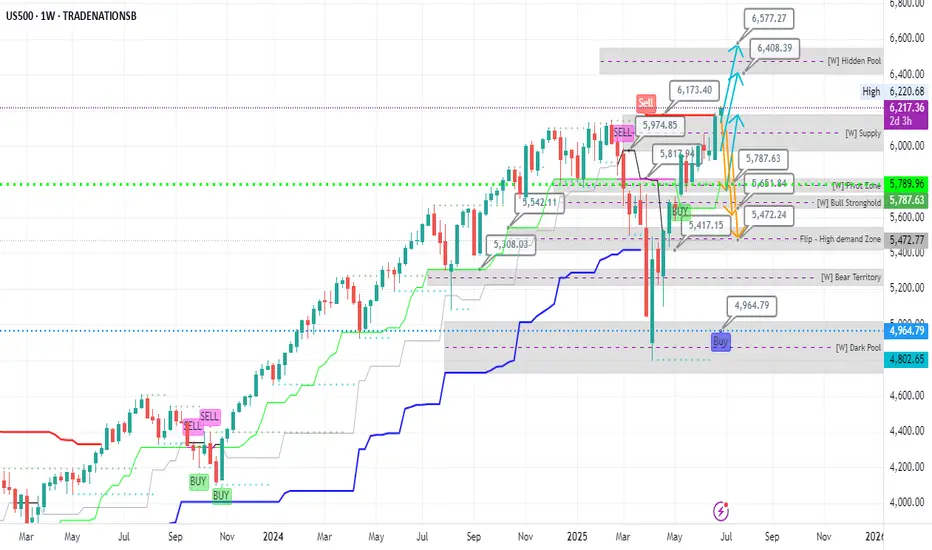
SPX : Next Stop @ 6800 :-)Since we are now expecting a delay in the FED cutting, there will be plenty of liquidity to spice things up.
The 'D' @ yellow had worked once before and since it has been 'used up' , its potency had been somewhat reduced.
But have no fear/worry, there would always be more 'D' ahead. The next one at 6,800
Good luck.
Wind of Change - VOO ETFPlease watch this interesting article and feel the cool nice breeze blowing along...........
Nice , isn't it ?
As I read this article, I can't help as if a REAL giant fan was blowing at me although I know it is not REAL, just an image in my mind, magnified by the LED image and the sound as well.
And for a moment, I allowed it to play with my mind and instantly, I felt cooler.........
It is the same for reporters/journalists worldwide who made a living covering news and writing sensational news headlines to capture your eyeballs. Although we are not in Israel/Iran war, we too feel the pain and tragedy suffered by the innocent people.
How about the numerous floods happening in China ? I can't help but feel a sense of gratitude for where I am born - Singapore , free from natural disasters.
It is the same as INVESTING/TRADING. If you look at your P&L statement on a daily/hourly basis, it somehow spurs you to take an impulsive action. This is especially if you have lost some money and you wanted to quickly recover your losses. On one hand , you wanted it to go along but afraid the pullback may be too strong and your profits turn to losses again.
I remembered the book I read about - it says yesterday result was history. Whatever had happened , leave it there. Today is a fresh start and if you want to trade, you must have a brave heart and start afresh , look at your available capital (not including what you had lost) and do what you are supposed to do in the moment.
Social media is a double edge sword and every day, there are doomsday porns including marketing gurus telling you that the stock market is overvalued, tariffs this , tariffs that and you should sell. Did you ?
And there are also Asia bulls or rather China bulls that claims US funds are shifting to China and the price is going to the moon. I have often said treat this as entertainment , as reference but do your own due diligence.
A safer and lower risk is to get exposed to the VOO ETF where it is more diversified and you need not worry about a single company performance dragging the rest down.
Position sizing is also important - just because you had made some money (could be luck), it does not mean you should increase your position size (increase in risk) due to your greed. Consistency is the game in trading not BIG IN BIG OUT.

USA Economy Long-Term Outlook:The long-term outlook for the U.S. economy , as of mid-2025, is characterized by several key factors and some uncertainty, particularly around tariffs and monetary policy.
GDP Growth: The U.S. economy experienced a contraction in Q1 2025 (down 0.2-0.5% GDP), the first in three years, partly due to a surge in imports and a sharp cutback in consumer spending. Economists anticipate a bounce back in Q2 2025 (forecasted at 3% growth). However, the overall expectation for 2025 is for growth to decelerate significantly (e.g., Vanguard projects 1.5% GDP growth for year-end 2025, EY forecasts 1.5%, Trading Economics 1.7%, J.P. Morgan 2.1%). The second half of 2025 is expected to see a "pronounced demand cliff" due to front-loaded purchases ahead of anticipated trade restrictions.
Inflation: Tariffs are a significant factor impacting inflation. CPI growth is expected to average around 2.9% in 2025 and potentially accelerate to 3.2% in 2026, moderating to around 2.3% by 2029 (Deloitte). Core PCE inflation is expected to climb to the 2.8-3.0% range year-over-year in Q3 2025 - Q3 2026 as tariffs filter through the economy (University of Michigan). The Federal Reserve is closely watching tariff-induced price spikes.
Interest Rates/Monetary Policy: The Federal Reserve is likely on hold with interest rates for now, but two more rate cuts are anticipated later in 2025 if the labor market remains stable (Vanguard). Some forecasts suggest the Fed will resume cutting rates in July 2025, reaching a terminal range of 3.25-3.5% by mid-2026 (University of Michigan). However, the uncertainty around tariffs and their impact on inflation could influence the Fed's decisions.
Labor Market: The labor market has been cooling but remains stable. The unemployment rate is expected to increase throughout 2025, potentially reaching 4.3% (Morningstar), 4.7% (Vanguard), or even 4.8% by year-end (EY). Job gains are predicted to decelerate significantly in the second half of 2025 due to tariffs.
Tariffs: Tariffs are a major source of uncertainty. While some recent de-escalation in trade policy with China has led to positive revisions in the outlook, the long-term impact of tariffs remains a concern, with potential to lower GDP growth, raise inflation, and weaken the labor market. The expectation is that tariffs will be at least modestly higher than at the start of 2025.
In essence, the long-term economic forecast for the USA suggests continued growth, but at a more moderate pace than recent years, with ongoing vigilance required for inflation and labor market dynamics, heavily influenced by evolving tariff policies.
SPX500 at New ATH – Will NFP Fuel the Next Leg Up? SPX500 Outlook: Trade Optimism Fades as Focus Shifts to U.S. Jobs Data
Caution prevails ahead of today’s high-impact U.S. Nonfarm Payrolls report, which could be pivotal for the July rate cut narrative. A weaker print may support risk assets and push SPX500 higher, while a strong report could dampen momentum.
Technical Analysis (SPX500):
SPX500 has printed a new all-time high and is now targeting 6287, especially if the index closes above 6246 on the 1H chart.
As long as price holds above 6225 (pivot), the bias remains bullish, with potential upside targets: 6287 & 6325
However, a 4H close below 6213 would suggest a correction toward: 6190 & 6143
Key Levels:
• Resistance: 6287 / 6325
• Support: 6190 / 6143
Stay alert — today's NFP report could trigger major moves across indices and FX.
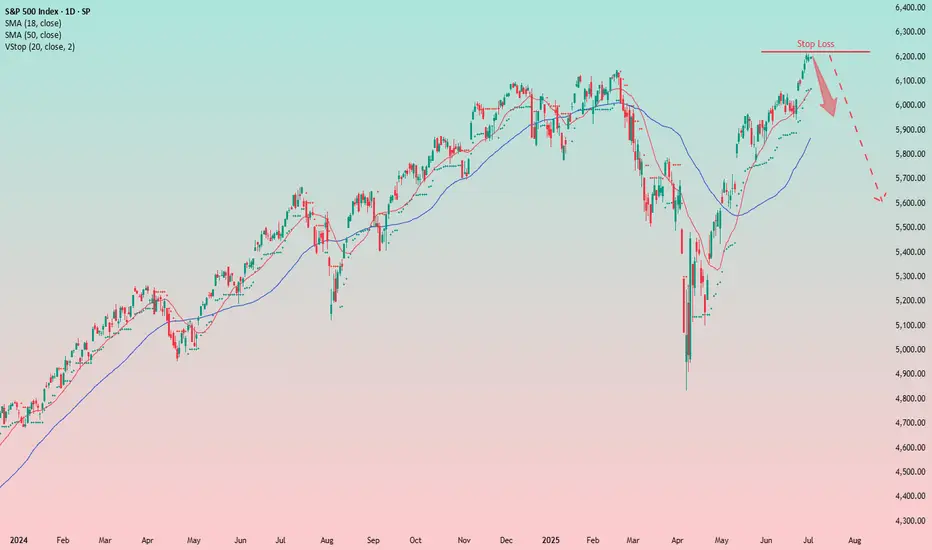
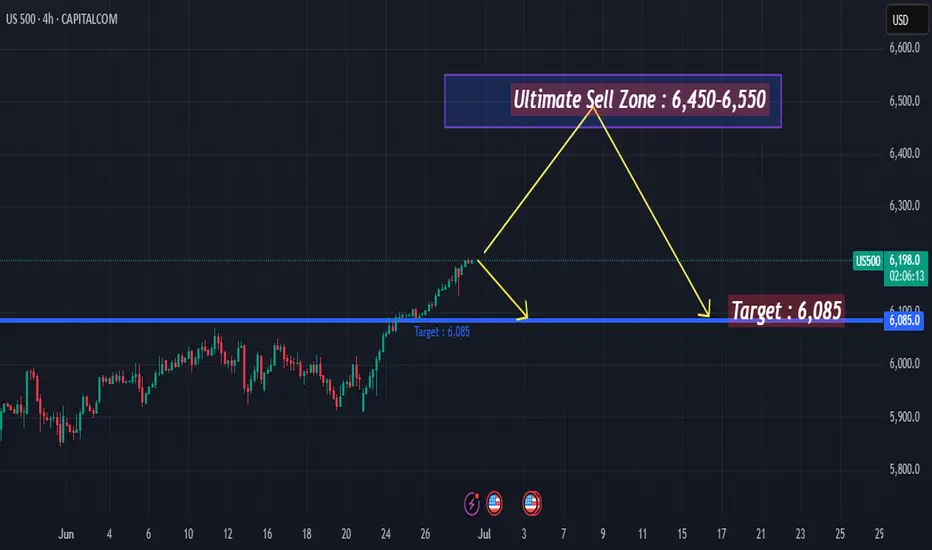
Bearish Outlook on the S&P 500: Time to Get ReadyFrom a long-term perspective, I see a short setup building on the S&P 500 index. The anticipated rate cuts in the U.S. — which I believe are coming soon — have historically led to market declines, despite the common perception that lower rates are bullish for equities.
Additionally, the market appears overheated: P/E ratios are at extreme highs, more than 50% above historical averages.
Given this, I expect we’ll see a downside move soon.
Since markets tend to rise slowly but fall quickly, I’m beginning to build a short position in advance. Stops may get hit, and re-entries might be necessary, but overall I see more reasons supporting this thesis than contradicting it.
SPX partial profit pivot approaching Looks like we are entering a choppy 4-5, 4-5 topping pattern will likely take 1-2 week to play out to a point where we can see the waves more clearly. This is slightly more bullish option.
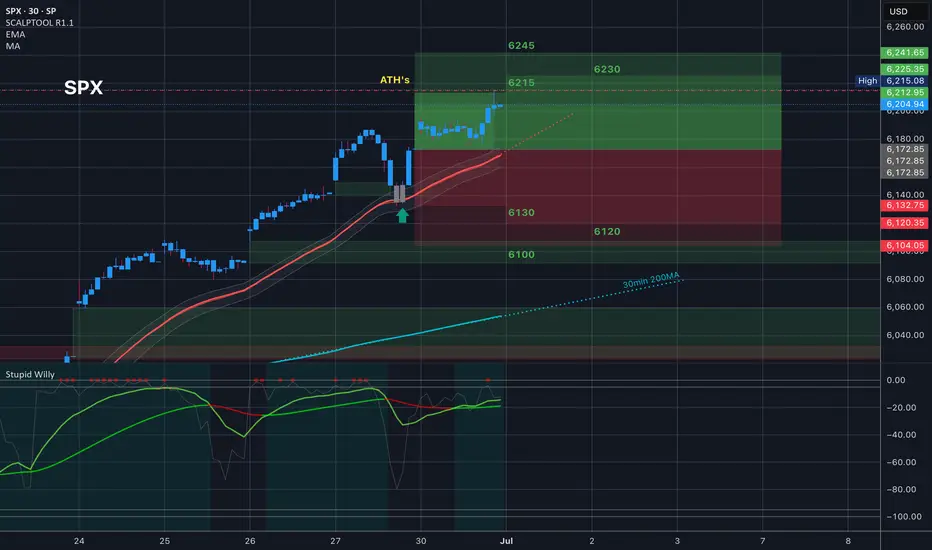
$SPX Made new ATH’s
Yesterday’s price action was flat near previous ATH’s for the first part of the day and then the second part of the day we had some nice volatility that tapped the top of the implied move at 6215 and made new ATH’s just above that at 6215.08 and then pulled back. It’s worth knowing where the top of the implied move is.
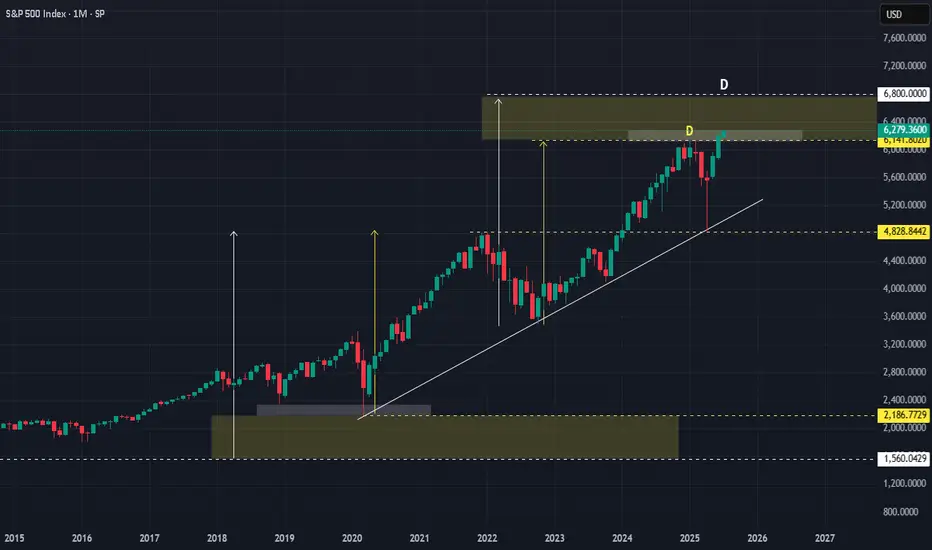
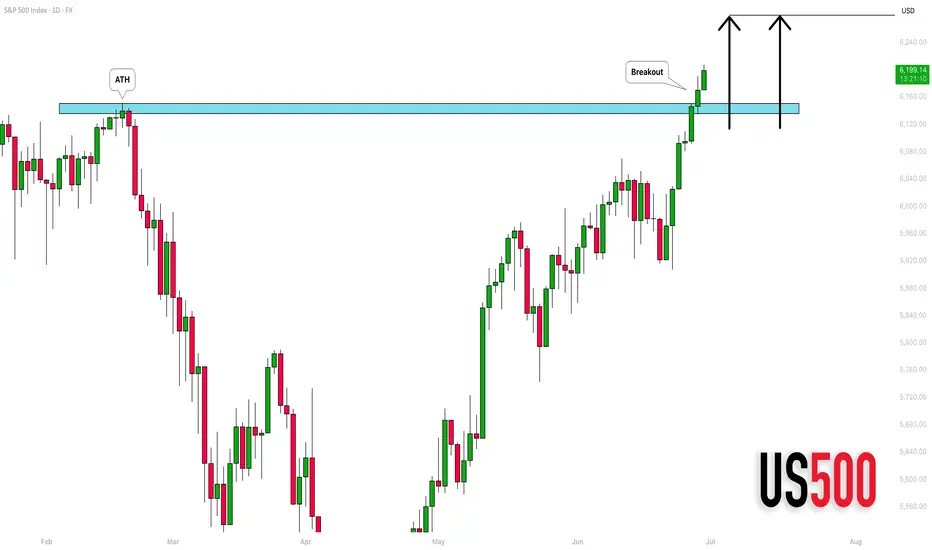
S&P500 INDEX (US500): New ATH & More Growth
S&P500 index updated the all-time high on Friday.
The market successfully broke and closed above an underlined resistance.
More growth is coming and the index is going to reach 6280 level soon.
❤️Please, support my work with like, thank you!❤️
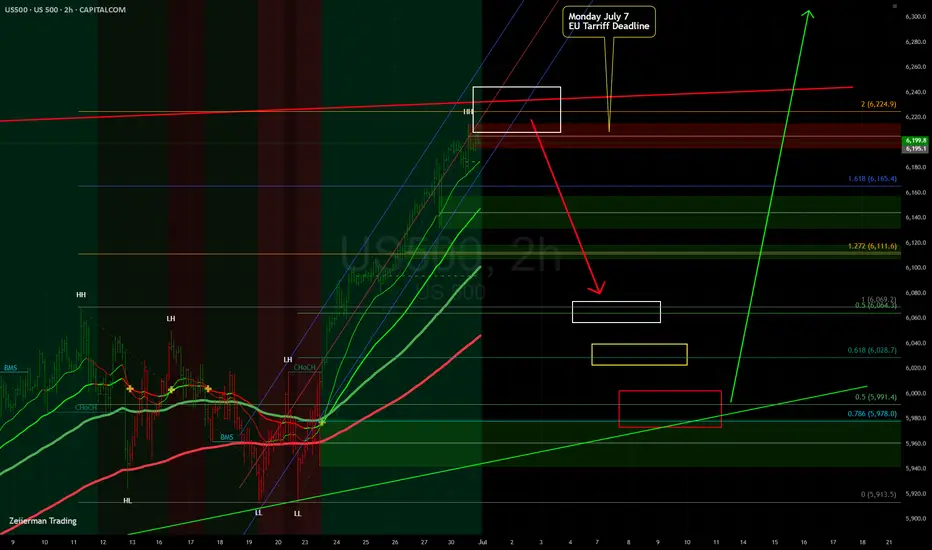
Possible "DIP" into Monday July 7 Tarrif DeadlineHello everyone,
Well we made it. ATH! Well all things must eventually dip. I see a good possibility into next Monday July 7 Tarif deadline plus we are hitting the ATH's prior tops trendline (Red Line)....
I highlight with colored boxes 3 different price targets I think it could dip to before resuming its march higher.
Let's see what happens!
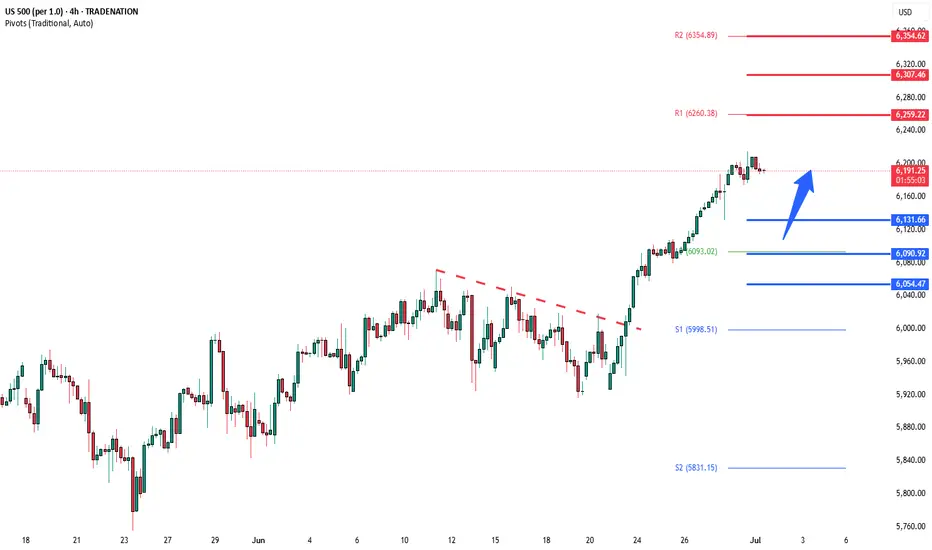
S&P500 bullish ahead of US employment- NFP numbersHouse Republicans moved Trump’s major tax and spending bill closer to a final vote, which could happen before his July 4 deadline. The package includes tax cuts, immigration funding, and the rollback of green energy incentives. Gamblers are raising concerns about a tax increase in the bill that could affect them.
In trade news, the US eased export rules on chip design software to China as part of an ongoing deal. China’s tone has shifted more positively, with a top official saying he’s hopeful about US-China relations and that conflict between the two is “unimaginable.”
At the Fed, Chair Jerome Powell hasn’t said if he’ll step down when his term ends in May, adding uncertainty. Trump, who wants a loyal replacement, has called for his resignation after a federal agency accused Powell of giving misleading testimony about expensive Fed building renovations.
On Wall Street, value investing made a comeback last quarter. Over 60% of active value fund managers beat their benchmarks by buying cheap industrial stocks and avoiding underperforming sectors like utilities and consumer staples.
Conclusion:
US equities are steady but cautious. Uncertainty around Fed leadership and Trump’s economic plans is keeping markets in check, while improving US-China trade relations and a shift toward value stocks are offering support.
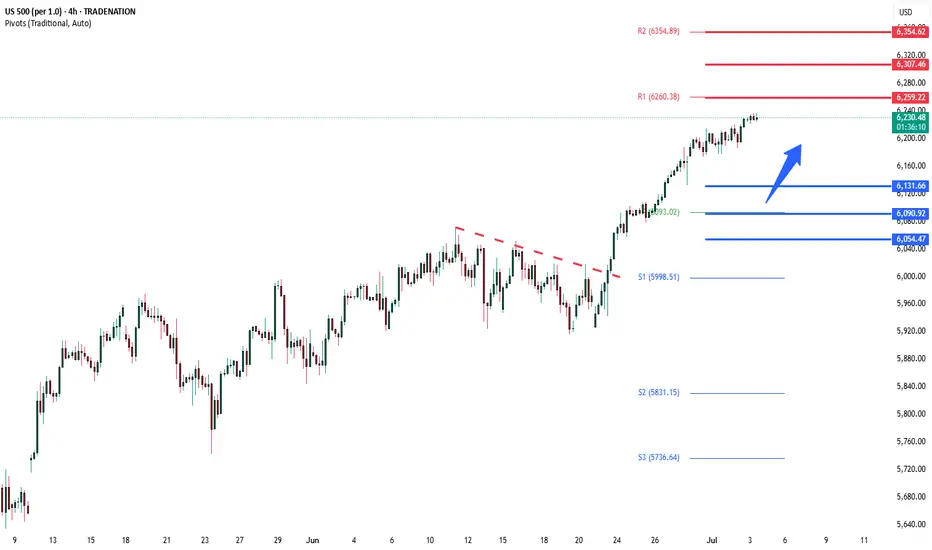
Key Support and Resistance Levels
Resistance Level 1: 6260
Resistance Level 2: 6307
Resistance Level 3: 6355
Support Level 1: 6130
Support Level 2: 6090
Support Level 3: 6055
This communication is for informational purposes only and should not be viewed as any form of recommendation as to a particular course of action or as investment advice. It is not intended as an offer or solicitation for the purchase or sale of any financial instrument or as an official confirmation of any transaction. Opinions, estimates and assumptions expressed herein are made as of the date of this communication and are subject to change without notice. This communication has been prepared based upon information, including market prices, data and other information, believed to be reliable; however, Trade Nation does not warrant its completeness or accuracy. All market prices and market data contained in or attached to this communication are indicative and subject to change without notice.
SPX nearing profit pivotSeems SPX is nearing profit pivot. expect a few more waves higher. Then a larger 8%-10% correction. will likely hold through or with some profit around 6350-ish. This expected wave-02 correction will likely be the last real opportunity to close any remaining short positions.
S&P500 key trading level at 6130Trade Tensions:
Trump has threatened higher tariffs on Japan, criticising its refusal to import U.S. rice.
The EU is open to a trade deal with the U.S. involving a 10% universal tariff on many exports, but seeks lower rates for key sectors like pharmaceuticals and semiconductors.
Markets:
U.S. equity futures are steady after the S&P 500 posted its best quarter since 2023.
Focus remains on trade developments and ongoing disputes in Washington over a major $3.3 trillion tax bill.
Canadian stocks are outperforming, led by gold miners, as investors seek safe-haven hedges amid tariff risks.
U.S. Tax Bill:
Republican leaders are struggling to secure votes.
A controversial AI regulation amendment was rejected.
Yale economists estimate the bill would cost the bottom 20% of earners $560/year, while the top 20% gain $6,055/year on average.
Corporate News:
Apple may use OpenAI or Anthropic’s AI to upgrade Siri, potentially sidelining its own AI models.
Key Support and Resistance Levels
Resistance Level 1: 6260
Resistance Level 2: 6310
Resistance Level 3: 6350
Support Level 1: 6130
Support Level 2: 6090
Support Level 3: 6055
This communication is for informational purposes only and should not be viewed as any form of recommendation as to a particular course of action or as investment advice. It is not intended as an offer or solicitation for the purchase or sale of any financial instrument or as an official confirmation of any transaction. Opinions, estimates and assumptions expressed herein are made as of the date of this communication and are subject to change without notice. This communication has been prepared based upon information, including market prices, data and other information, believed to be reliable; however, Trade Nation does not warrant its completeness or accuracy. All market prices and market data contained in or attached to this communication are indicative and subject to change without notice.
SPX500 | Bulls Need Break Above 6225 to Regain ControlSPX500 | Market Overview
The price has reached the previously mentioned resistance level at 6225.
As long as it trades below 6225, a technical correction is likely, with downside targets at 6161 and 6143. From there, the index would need to stabilize above 6143 to resume a bullish structure.
However, a 1H candle close below 6143 would confirm a deeper bearish move toward 6098.
On the upside, a 1H close above 6225 would reinforce bullish momentum, with potential to reach 6250 and 6287.
Key Technical Levels
Pivot Level: 6191
Support: 6161 / 6143 / 6098
Resistance: 6225 / 6250 / 6287
The fate has already been written, it's in your hands Neo. ;)Fate has already been written and their is no return, get ready ;)
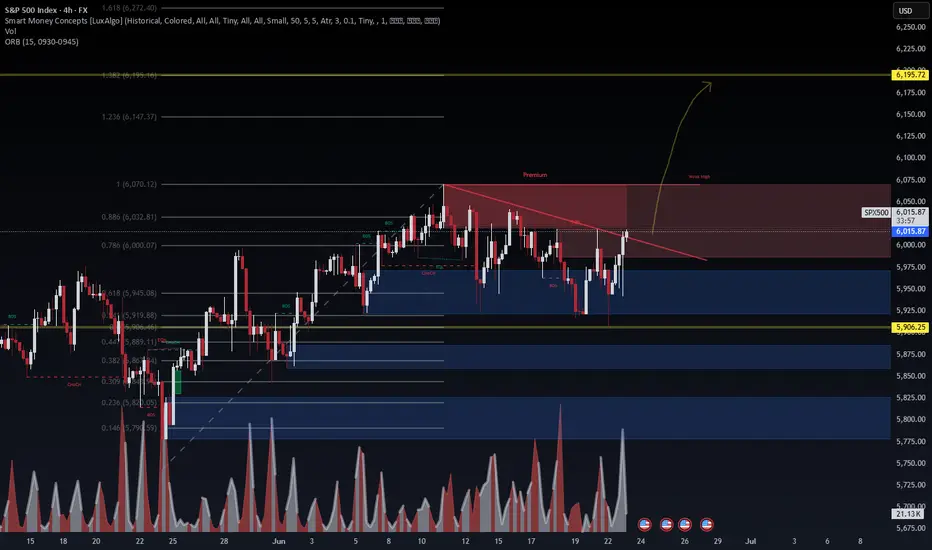
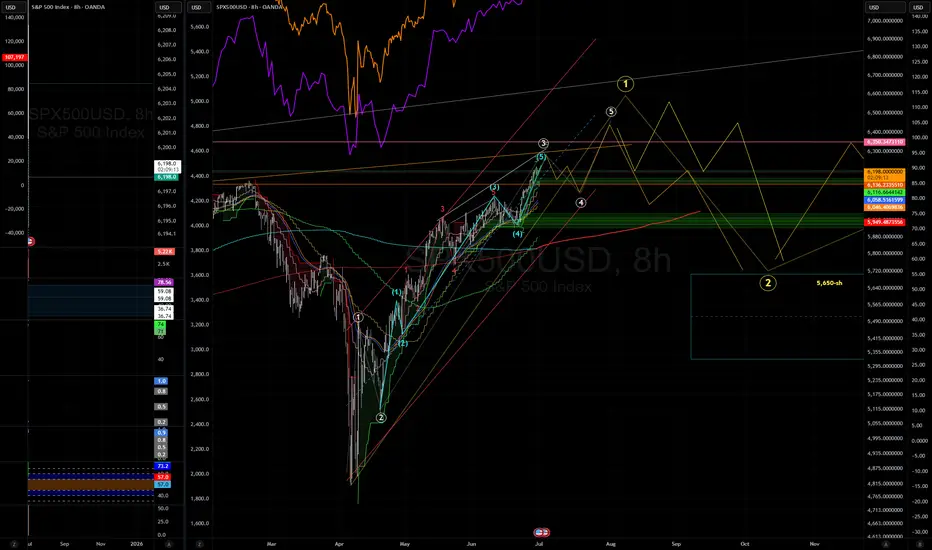
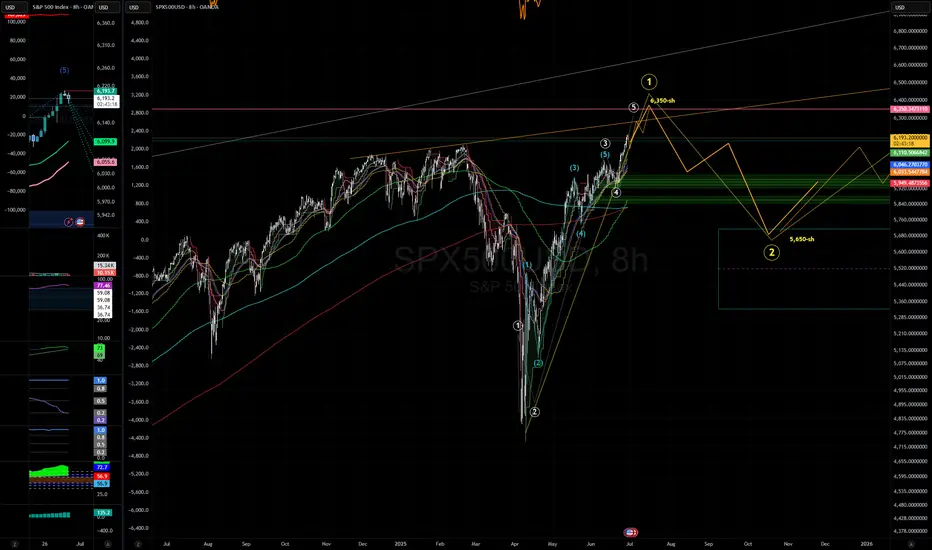
SPX500 Detailed Trading Game Plan🎯 Current Market Context:
Current Price: 6,000 (Approx.)
Trend: Bullish; forming higher highs and higher lows.
Key Technical Observations:
Strong support and trendline respecting bullish structure.
Fibonacci confluence points towards potential upside momentum continuation.
Volume Profile indicating key levels at 5,950–6,000.
🚦 Trading Scenarios & Probabilistic Setups:
🟢 Scenario A (High Probability Long Trade ~65%):
Entry Zone: Current Levels (6,000–5,950) or retest to 5,863 support.
Stop Loss: Below 5,709 (critical structural support).
Targets:
Primary: 6,262 (100% Fibonacci Extension)
Secondary: 6,460 (Key Horizontal Resistance)
Risk-to-Reward: Favorable (~1:3)
🟡 Scenario B (Medium Probability Short Trade ~45%):
Entry Zone: 6,460–6,500 (strong resistance confluence)
Stop Loss: Above 6,600 (clear invalidation)
Targets:
Primary: 6,100 (structural retest)
Secondary: 5,950–5,863 (previous support zone)
Risk-to-Reward: Good (~1:2)
🔴 Scenario C (Low Probability but High Reward Long Trade ~35%):
Entry Zone: Deep retracement at ~5,408–5,106
(Invalidated if price breaks below 5,107.)
Stop Loss: Below 5,107 (firm invalidation)
Targets:
Primary: 5,950 (key resistance)
Extended: 6,460–7,176 (long-term bullish target)
Risk-to-Reward: Excellent (~1:5+), but lower likelihood of triggering.
📊 Probability & Risk Management Summary:
Scenario Probability Risk Reward Potential
A (Long) 65% ✅ Moderate High
B (Short) 45% ⚠️ Moderate Moderate
C (Long Deep) 35% ❗ Lower Very High
⚙️ Recommended Approach:
Primary Strategy: Bullish Continuation (Scenario A) due to current market structure and volume profile confirmation.
Secondary Consideration: Watch closely for Short Setup (Scenario B) only upon clear resistance signals.
Contingency Setup: Deep retracement (Scenario C) provides excellent value entry if fundamentals trigger a major correction.
🛠 Trade Management Tips:
Position Size according to scenario probabilities. Allocate larger sizing to Scenario A, cautious sizing for Scenario B, and small, speculative sizing for Scenario C.
Trailing Stops: As price approaches targets, adjust stops to lock profits progressively.
🗓 Timeline & Key Levels for Reference:
Immediate actionable trades: Scenario A (Long) setup at current levels.
Monitor closely by Mid-August 2025 for Scenario B potential short setup.
Watch closely for deep retracement scenario by November 2025 if substantial correction occurs.
🚨 Important Note: Always adjust your trades dynamically based on evolving macroeconomic and geopolitical news. These probabilities are guidelines—not certainties.
⚠️ Disclaimer:
Trading involves substantial risk and is not suitable for every investor. The information provided is purely for educational and informational purposes and does not constitute financial advice, a recommendation, or solicitation to buy or sell any financial instrument. Always perform your own analysis, consider your financial situation and risk tolerance, and consult with a qualified financial advisor before executing trades. Past performance does not guarantee future results. You alone bear the full responsibility for any investment decision you make.
Stay disciplined, trade wisely, and good luck! 🍀📊

US 500 Index – Uptrend Channels, Support and Resistance CluesPositive price activity continues to materialise within equity indices, with several over recent sessions, successfully posting new all-time high trades.
The US 500 index is no exception, with at the time of writing (7.30am Monday 30th June) a new upside extreme just posted at 6208, see chart below.
However, such moves into new all-time high ground, which effectively is uncharted territory, can offer a challenge to traders. There is obviously difficulty in assessing where next resistance levels might stand. Just because an uptrend price pattern is evident and new all-time highs are being posted, doesn’t guarantee further price strength.
There will be levels where sellers, or resistance, are found again that might create at least a short term sell-off in price, even a more extended phase of price weakness.
However, how perhaps might we be able to judge where these levels may stand, when an asset is trading at price levels previously not seen?
Within technical analysis there is a tool that can potentially help traders gauge where next resistance might be encountered – The Uptrend Channel.
Let’s take look at uptrend channels and the US 500 index, and where possible clues might be offered to where both support and resistance levels may currently stand.
The Uptrend Channel:
We have previously discussed uptrends (and downtrends) in previous reports, so please look at our timeline for further details.
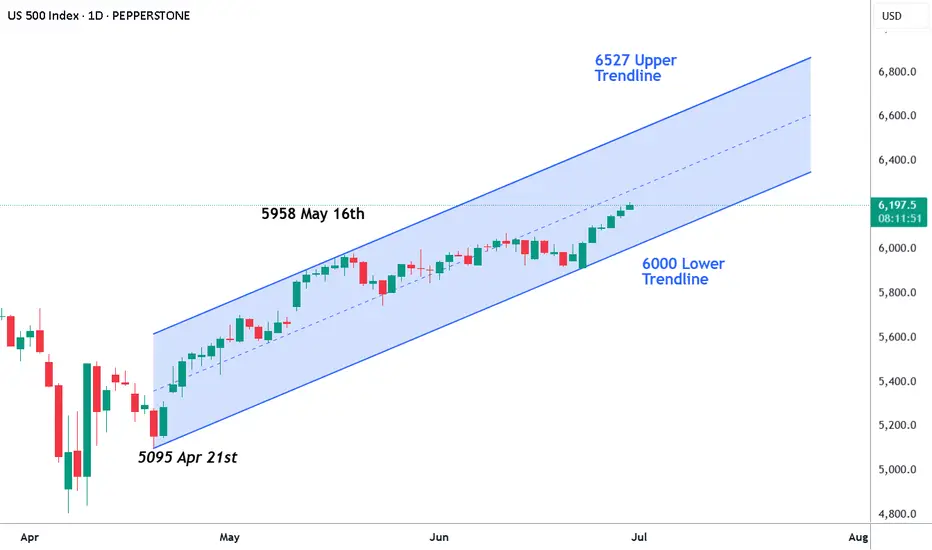
However, the basic definition of an uptrend line, is a straight line connecting previous price lows. In the chart below, we look at the US 500 index and have drawn a straight line connecting the 5095 low, posted on April 21st, with 5913, the June 23rd low.
This uptrend line today (June 30th 2025) stands at 6000, and traders may now be viewing this as a potential support to price weakness, if seen. It’s held on 2 previous occasions, April 21st and June 23rd, and may do so again, if price weakness approaches this line in the future. Please note, this is a rising trendline, so the support level will move higher each day.
Now look at the chart above again, you’ll notice we have also now drawn a trendline parallel to the lower uptrend line, which connects with the 5958 May 16th price high. This line also moves higher each day, as it too represents an uptrend and today stands at 6527.
While much will continue to depend on future market sentiment and price trends, if (and as we know within trading, it is a big if!) prices continue to move higher and post new all-time price highs, traders may be watching this uptrend channel pattern to suggest both potential support and resistance price levels.
They may argue that while support, which today stands at 6000, marked by the level of the lower limits of the uptrend channel, remains intact, potential might be for a more extended phase of price strength. Possible resistance could then be 6527, the current level of the upper limits of the uptrend channel.
Please remember, these levels will change daily, and you will need to refer to your own Pepperstone charts to update these levels on a daily basis, as they will change for each sessions.
Looking Ahead:
Today marks the end of a volatile but impressive second quarter for the US 500 index. It saw a low of 4799 on Monday April 7th in the thick of the trading carnage caused by President Trump’s trade tariffs, but since the 90 day tariff pause was announced on April 9th the index has rallied steadily to register a new all time high at 6208 in Asia this morning. That’s a bounce of 29% in Q2!
The start of Q3 isn’t likely to be without its challenges, however. There are concerns that President Trump’s $4.5 trillion tax bill, that is moving through the Senate currently, could increase the US debt burden to unsustainable levels.
Also, the July 9th tariff deadline is getting closer by the day and only 1 trade deal has been announced during the 90 day pause, despite lots of talk that 10 more deals, including India, Japan and potentially the EU are in the pipeline.
Updates on the health of the US economy this week in the form of Non-farm Payrolls on Thursday (1330 BST) and ISM Services PMI (1500 BST) could be critical if markets expectations for Fed rate cuts later in the year are to materialise, and the next earnings season for US companies begins in the middle of next week as well.
How this all unfolds could help to determine whether the US 500 keeps recording new all time highs or begins to unwind the recent upside moves as risk sentiment sours again.
The material provided here has not been prepared accordance with legal requirements designed to promote the independence of investment research and as such is considered to be a marketing communication. Whilst it is not subject to any prohibition on dealing ahead of the dissemination of investment research, we will not seek to take any advantage before providing it to our clients.
Pepperstone doesn’t represent that the material provided here is accurate, current or complete, and therefore shouldn’t be relied upon as such. The information, whether from a third party or not, isn’t to be considered as a recommendation; or an offer to buy or sell; or the solicitation of an offer to buy or sell any security, financial product or instrument; or to participate in any particular trading strategy. It does not take into account readers’ financial situation or investment objectives. We advise any readers of this content to seek their own advice. Without the approval of Pepperstone, reproduction or redistribution of this information isn’t permitted.
SPX500 Extends Rally on Fed Hopes and China Trade DealS&P 500 Set to Extend Record Highs
U.S. stock futures climbed on Friday, continuing this week’s strong momentum on hopes of eased trade tensions and growing confidence in multiple Fed rate cuts later this year.
Futures tied to the S&P 500 and Nasdaq 100 pointed to fresh record-high openings, while the Dow Jones was set to rise by 150 points.
Adding to the bullish tone, Commerce Secretary Lutnick announced a trade agreement with China, reducing tariff risks and easing concerns over rare earth shortages.
TECHNICAL OUTLOOK – SPX500
The index has broken into new all-time highs (ATH) and stabilized above the 6,143 resistance level, confirming bullish strength.
As long as the price trades above 6,143, the uptrend is likely to continue toward 6,225, with potential short-term pullbacks to 6,143.
A 1H candle close below 6,143 could trigger a deeper correction toward the pivot zone at 6,098.
Key Levels
Resistance: 6,175 → 6,225
Support: 6,098 → 6,041
previous idea:
SPX: new ATH, despite allEconomy, geopolitics, trade tariffs, inflation, Fed moves. It seems that the market got tired of all news during the previous period, and decided to take the optimistic side, despite all. The S&P 500 reached a fresh, new all-time highest level on Friday's trading session, at 6.185. With the latest move, the S&P 500 managed to erase all losses from April this year, when the index tumbled around 20% after the implementation of trade tariffs.
The weekly trade tariffs news brought a termination of talks between the U.S. and Canada. However, what moved the market the most was the news that the US Administration settled a deal on trade tariffs with China. Although details of the deal were not publicly disclosed, still the market reacted very optimistic about it.
At the same time, the latest macro figures for the US are showing that the tariffs are slowly starting to reflect in the U.S. economy. The Fed's favorite inflation gauge, the PCE index increased by 0,1% in May, which was expected. However, the Personal Income and Personal Spending in May missed heavily market estimates. The Personal Income dropped by -0,4% for the month, while Personal Spending dropped by -0,1%. Analysts are pointing that these figures are showing that the US consumers are spending less due to increased prices of goods, after implementation of tariffs. At the same time, there was a slowdown in the U.S. GDP growth rate, final for Q1 was negative for the quarter, at the level of -0,5%.
Tech companies continued to be in the focus of investors' interest. APPL closed the week at $210,08, with a modest weekly gain of 0,24%. MSFT gained 3,87% for the week, closing it at $495,94. Market favourite NVDA surged by 9,74% within a week, closing at $157,75. AMZN also had a good week with a surge of 6,33%. Despite higher volatility, TSLA ended the week at 0,33% higher, underperforming other tech companies included in the index.

Let's see how it goes. www.youtube.com
"The true strength of any government, military, or society lies in its commitment to protect civilians. When that principle is compromised, we lose the very reason these institutions exist. Power must serve humanity, not harm it."