S&P 500 Daily Chart Analysis For Week of June 27, 2025Technical Analysis and Outlook:
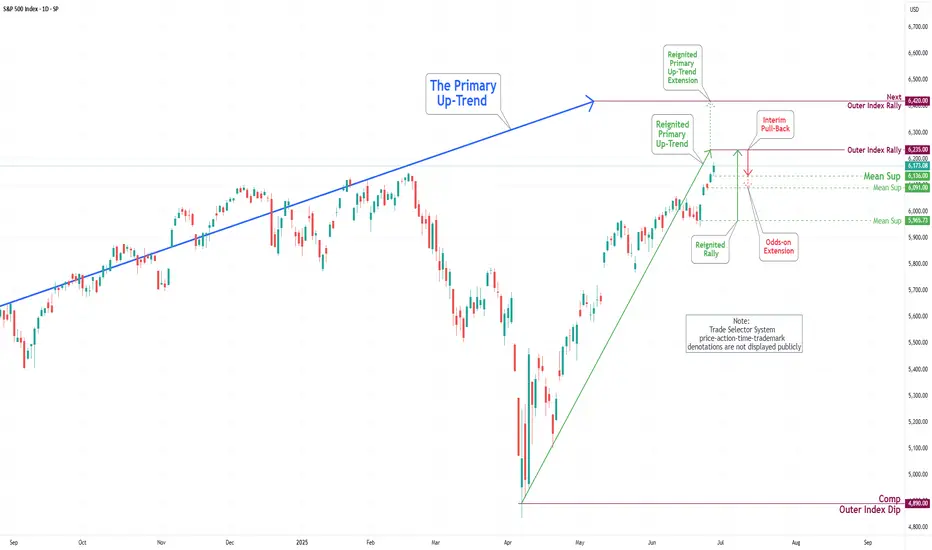
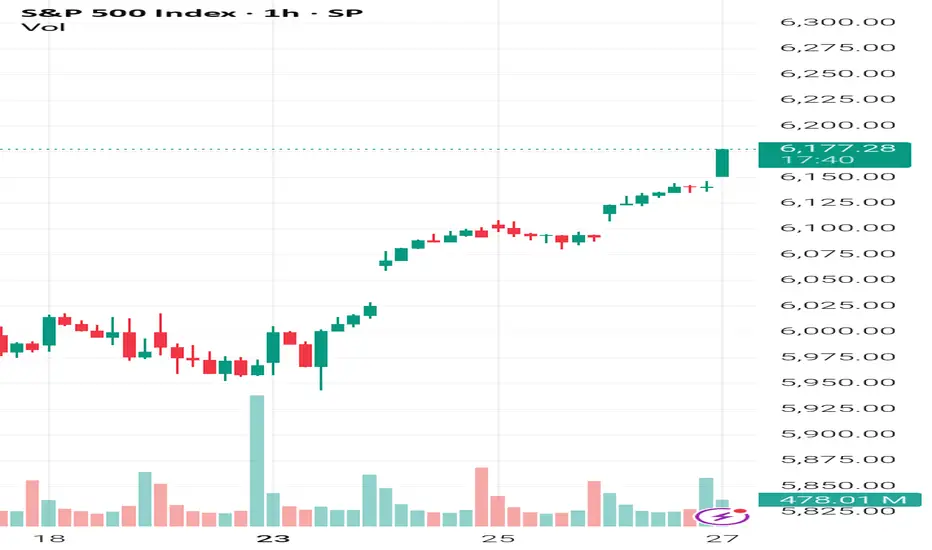
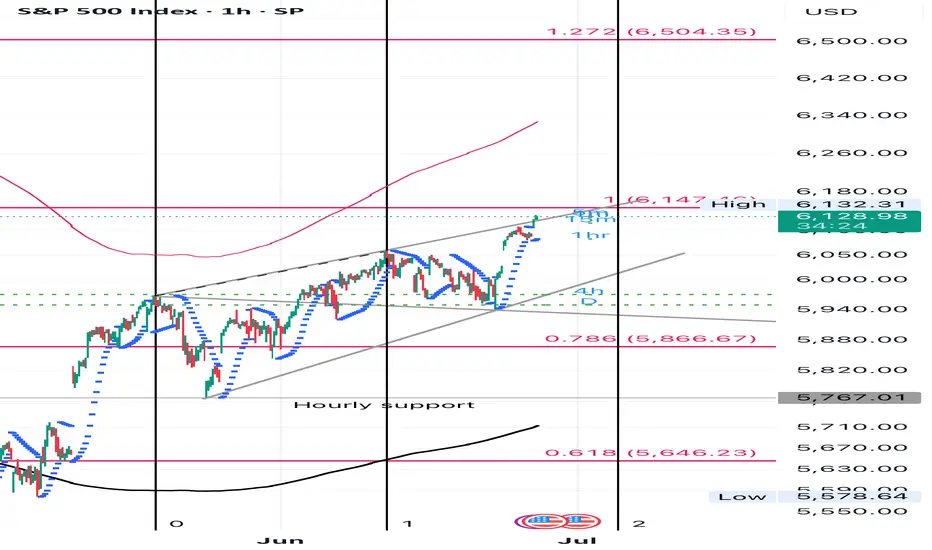
During the current trading week, the S&P 500 Index has predominantly demonstrated an upward trajectory, surpassing the Mean Resistance level of 6046, the Outer Index Rally target of 6073, and the critical Key Resistance threshold of 6150. Currently, the index is exhibiting a bullish trend, indicating potential movement towards the Outer Index Rally objective of 6235. However, it is essential to note that there is a substantial probability that prices may retract from their current levels to test the Mean Support at 6136 before experiencing a resurgence.
SPX500USD trade ideas
V2. US S&P Zones - PMI Manuf, USINTR, Inflation, DXY & QEV2. US S&P Zones - PMI Manuf, USINTR, Inflation, DXY & QE
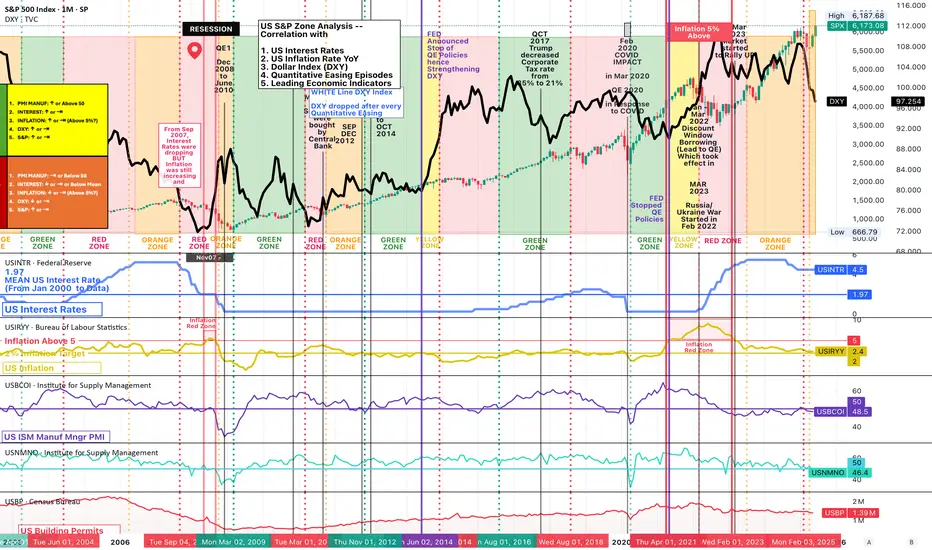
US S&P Zone Analysis -- Correlation with
1. Leading Economic Indicators (PMI Manufacturing Index, PMI Services Index, Building Permits)
2. US Interest Rates (MEAN 1.97 from Jan 2003)
3. US Inflation Rate YoY
4. Dollar Index (DXY)
5. Quantitative Easing Episodes
WHY CHANGE IN APPROACH?
As per Ammar Bhai, Red and other Zones for US and developed markets shall not follow only Interest Rates after 2000. Traditional single impact of Interest Rate is not Enough.
NOTE ABOUT INFLATION ABOVE 5%
It was also noticed that if inflation was about 5% that coincided with Red and Yellow zone and it must be avoided for stock trading.
NEW APPROACH
NEW GREEN ZONE
1. PMI Manuf Index is RISING or ABOVE 50
2. Interest Rates are FALLING or LEVELED or BELOW MEAN (Expansionary Policy in Effect)
3. Inflation is FALLING or AROUND TARGET
4. DXY is FALLING or SIDEWAYS
5. Stock Market RISING
NEW APPROACH for RED ZONE
1. PMI Manuf Index is FALLING or BELOW 50
2. Interest Rates are RISING or LEVELED or ABOVE MEAN (Contractionary Policy in Effect)
3. Inflation is RISING or SIDEWAYS. (Also Check if Inflation rate is above 5%)
4. DXY is RISING
5. Stock Market FALLING or SIDEWAYS
NEW YELLOW ZONE
1. PMI Manuf Index is RISING or ABOVE 50
2. Interest Rates are RISING or LEVELED
3. Inflation is RISING or SIDEWAYS (Also Check if Inflation rate is above 5%)
4. DXY is RISING or SIDEWAYS
5. Stock Market RISING or SIDEWAYS
NEW ORANGE ZONE
1. PMI Manuf Index is SIDEWAYS or BELOW 50
2. Interest Rates are FALLING or LEVELED or BELOW MEAN (Expansionary Policy in Effect)
3. Inflation is FALLING or SIDEWAYS (Also Check if Inflation rate is above 5%)
4. DXY is FALLING or SIDEWAYS
5. Stock Market RISING or SIDEWAYS
Historically whenever Interest Rates are dropping, US market goes down for some months:
US somehow try to control Inflation before bringing the interest rates down.
When Inflation is under control and Growth has not gone down much, then they decrease the interest rates
Because in past whenever Interest rates were decreased, growth also fell for some months and then improved.
Then FED does QE, which bring surplus cash in the market, Which drops Dollar rate, that helps the Stock Market grow.
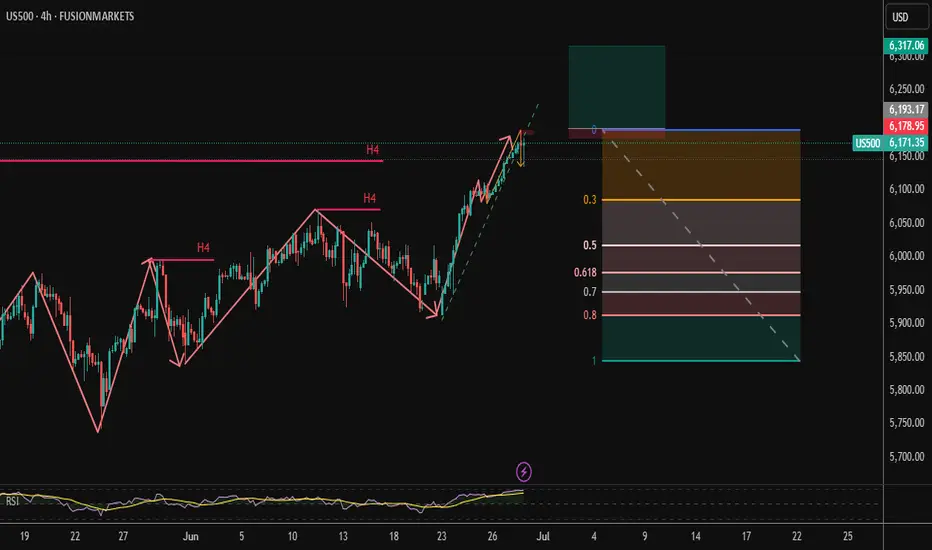
US500 will fly!US500 (H4 time frame) is in up trend and recently broke the highest CTS and touches POI, if it keeps higher and breaks 6,168.13 then go long
This result depends on my own analysis (Am not professional or advisor)
Generally bullish sentiment heading into next weekWednesday's AUD CHF trade finally stopped out. I've been a little surprised by CHF resilience considering the 'risk on' environment. I have read an interesting article suggesting CHF and EUR strength can be attributed to holding relatively high amounts of gold reserves. I'm not sure how much long term credence I'd give that theory but it does make sense.
Meanwhile, the USD turned out to be the currency to short this week as the market starts to price in more rate cuts than thought a few weeks ago. It could be a tricky road ahead for the FED, as softening data, and now today's higher than forecast PCE data means the dreaded 'stagflation' word will be mentioned. But with the VIX well below 20 and the S&P touching all time highs, in the absence of Middle East re-escalation or fresh tariff concerns, I'll begin next week with a mind to continue looking for 'risk on' trades.
For today, I will let Friday's price action do what it's going to do and start fresh next week.
The S&P did it!The S&P 500 has reached a new ATH. The monthly RSI looks strong as well. This could trigger an explosion into the target area.

LONG SPX TILL 6300+Hi,
I am publishing this idea for educational purpose. I beleive break out has done and spx should touch 6300 t0 6400 zone in future soon.
S&P 500 hits fresh records: Levels to watchBreaking its February peak, the S&P 500 has joined the Nasdaq 100 in hitting a new record high this week. The latest gains came on the back of a sharp de-escalation in the Middle East and mounting pressure on the Fed to cut rates.
They question is whether it will kick on from here or we go back lower given that trade uncertainty is still unresolved. Indeed, there’s the upcoming 9 July deadline, when the current reciprocal tariff truce is due to expire. Unless it’s extended—or replaced by something more concrete—we could be in for another wave of trade tensions.
It is also worth remembering the ever-looming US fiscal showdown. Trump’s much-touted spending bill—nicknamed the “One Big Beautiful Bill”—is targeting a Senate vote by the 4th of July. If passed, it could reignite concerns about ballooning deficits and inflationary pressure.
Anyway, from a purely technical analysis point of view, the path of least resistance continues to remain to the upside. Thus, we will concentrate on dip buying strategy than looking for a potential top - until markets make lower lows and lower highs again.
With that in mind, some of the key support levels to watch include the following:
6069 - the mid-June high, which may now turn into support on a potential re-test from above
6000 - this marks the launch pad of the latest rally and marks the 21-day exponential average
5908 - this week's low, now the line in the sand. It wouldn’t make sense for the market to go below this level if the trend is still bullish.
Meanwhile, on the upside:
6169 is the first target, marking the 161.8% Fib extension of the most recent downswing
6200 is the next logical upside target given that this is the next round handle above February’s peak of 6148
By Fawad Razaqzada, market analyst with FOREX.com

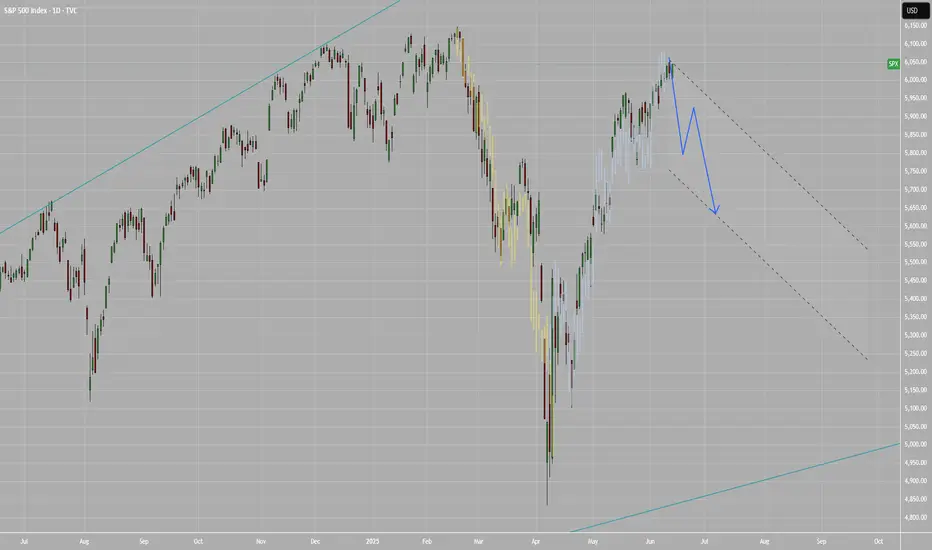
It seems very simple.Based on the market volume chart, as well as its similarity to previous declines, it seems like we are approaching a reliable bottom. This bottom is not far away and could happen right around 5000. We just have to wait for the daily reversal candle.

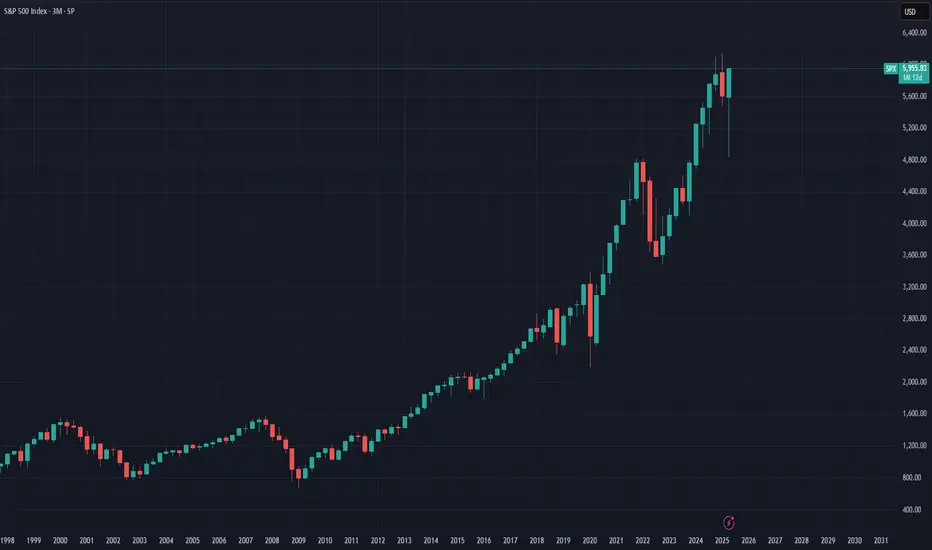
SPX going to all time highsThe quarterly on the SPX is a powerful bullish signal. Nothing stops this train, we are going to all time highs.
July 9th EU-US tariff deal, what will happen to S&P500?Timeline & Context
-The U.S. initially implemented a 10% baseline tariff on most imports (April 5), with potential spike to 50% for EU goods on July 9 unless a deal is struck.
-On June 26, Macron warned that if U.S. keeps a 10% tariff, the EU will impose equivalent retaliatory levies.
-EU offer of “zero-for-zero” (Macron, von der Leyen) remains on the table, though Washington reportedly resists.
How Markets May React
If a 10%–10% deal is struck (U.S. keeps 10%, EU matches):
-Markets will likely breathe a sigh of relief—clearing headline risk.
-Expect a moderate rally, perhaps +1–3% in the S\&P 500, as tariff uncertainty diminishes.
-Economists note past discussion: when the EU delay hit May, S\&P futures jumped ~2%.
If they agree to Macron’s “zero-for-zero” proposal:
-That would be a bullish surprise—tariffs completely lifted.
-Market response could range +3–5%, though EU has indicated U.S. pushback on full zerozero .
-Analysts warn clarity isn’t always calm: the S\&P is already priced above fundamentals—choppy reactions still possible .
If the pause lapses with no EU agreement:
-U.S. could enforce 50% tariffs; EU likely retaliates.
-Risks: recession fears in EU, U.S. inflation spike so stocks will likely fall.
-Bank strategists forecast flat S\&P (5,900), but warn of volatility range 5,600–6,000 based on trade policy surprises.
-Disclaimer: This analysis is for informational and educational purposes only and does not constitute financial advice, investment recommendation, or an offer to buy or sell any securities. Stock prices, valuations, and performance metrics are subject to change and may be outdated. Always conduct your own due diligence and consult with a licensed financial advisor before making investment decisions. The information presented may contain inaccuracies and should not be solely relied upon for financial decisions. I am not personally liable for your own losses, this is not financial advise.

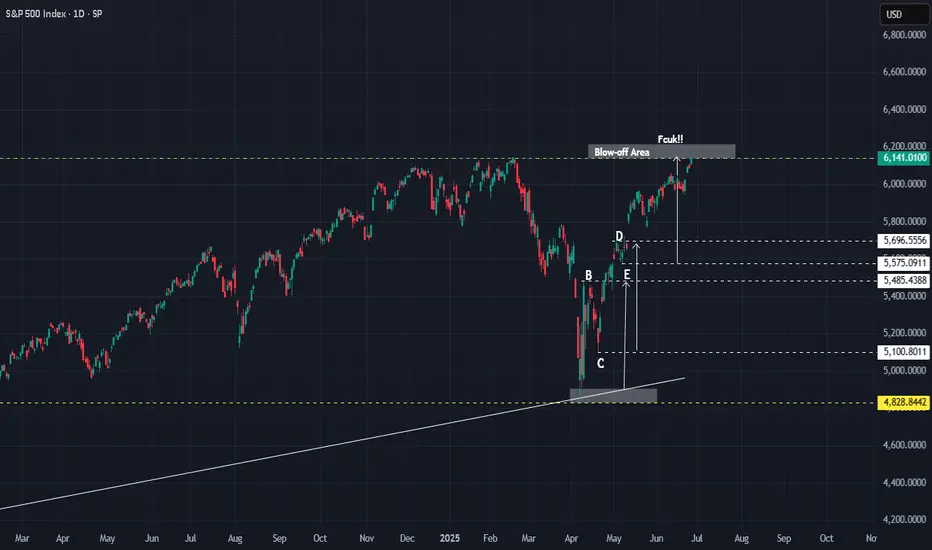
SPX : A reminderJust a follow-up reminder of what was shared on 18 May.
Price is moving as anticipated - soon to enter the blow-off zone.
Be careful. Be bold.
Over on the EURUSD - what can we expect? Actually, I can see that the price is also moving along - a bit challenging to know when to move in, until .........
Good luck.
SPX -TINAUnlimited money sloshing around means no end to upside in the markets. When the Fed finally lowers interest rates, all markets will go crazy. Calling for 7,500. Go big!!

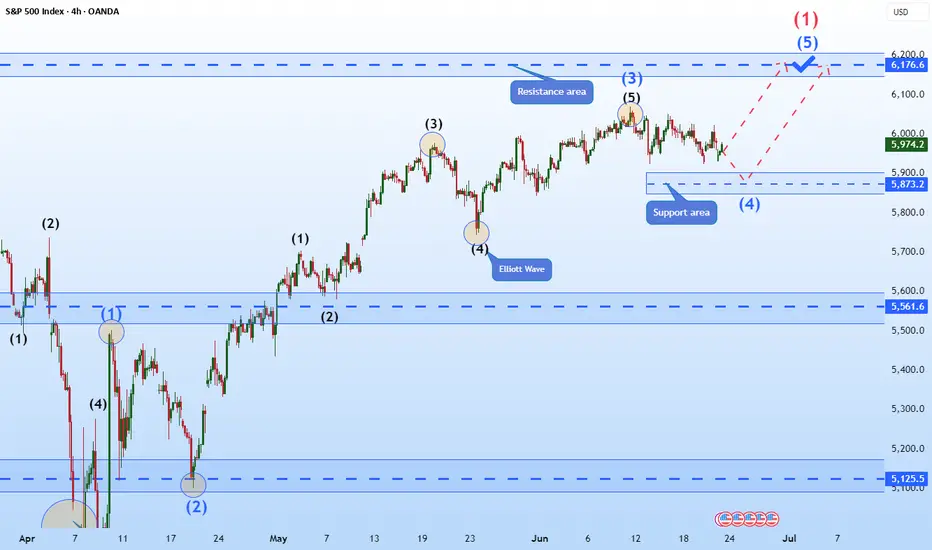
Hellena | SPX500 (4H): LONG resistance area of 6176 (Wave 1).Colleagues, the previous forecast remains essentially unchanged, and the target is still 6176, but I think the forecast can be updated because the price has been flat for quite some time.
I still expect the upward movement to continue in the large wave “1” and in the medium-order wave “5”.
A small correction to the support area of 5873 is possible.
Manage your capital correctly and competently! Only enter trades based on reliable patterns!
S&P500 and Nasdaq Short: Wave 5 <= Wave 3Based on the Elliott Wave rule that wave 3 is not the shortest wave, I gave a projection on where the peak of both S&P500 and Nasdaq could be. Based on these peaks, the stop is set above and the take profit target is where wave 4 was.

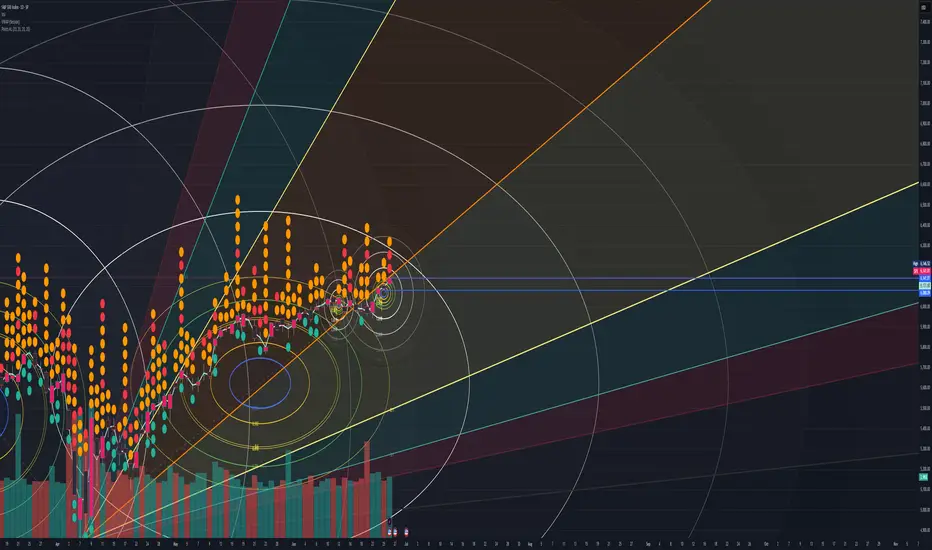
S&P. Has been struggling to keep a full bull/bear run.Setting todays fib circle I think it's going to balance out. especially with the fin levels.
Not just because of july.
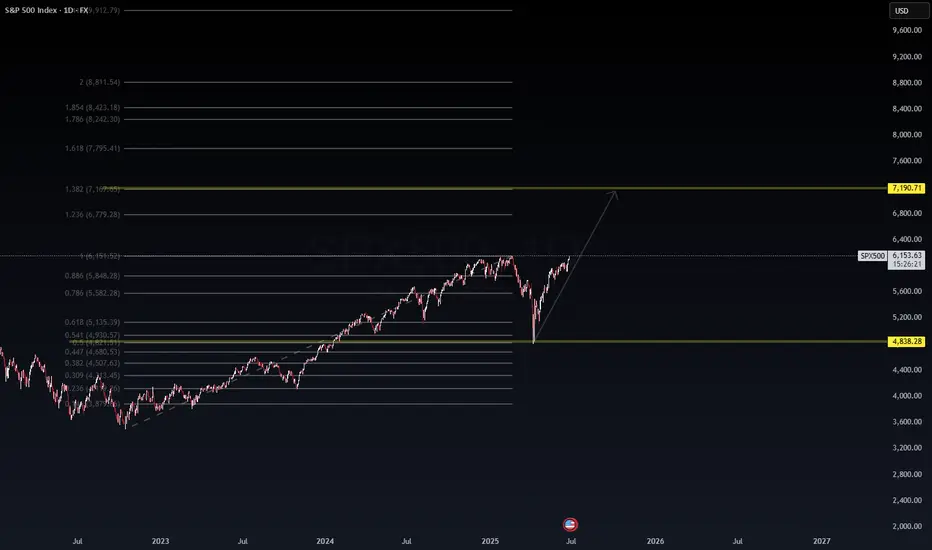
SPX500 Macro Fibonacci Projection – Eyeing 7190+ 🗓️ Posted by Wavervanir International LLC | June 26, 2025
The S&P 500 continues to respect key Fibonacci zones on the macro scale. After a strong recovery from the recent correction near the 0.5–0.618 retracement region (4800–5100), price is now hovering near critical confluence at the 1.0 level (~6150).
We’re tracking a bullish extension path toward 1.382 and 1.618 Fibonacci levels, which gives us a primary upside target zone between 7,190 and 7,795 — aligning with the projected long-term wave expansion. This structure favors a continued institutional accumulation phase, supported by macroeconomic resilience and liquidity conditions.
🔶 Key Levels to Watch:
Major Support: 4838.28 (0.5 Fib Retest)
Immediate Resistance: 6170–6200
Target Range: 7190.71 → 7795.41
🧠 Bias remains bullish unless price breaks back below 5830 with volume.
This is not financial advice. Shared for educational and strategic insights.
Let me know your thoughts, traders!
—
#SPX500 #Fibonacci #WaverVanir #MacroTrends #StockMarket2025 #QuantitativeAnalysis
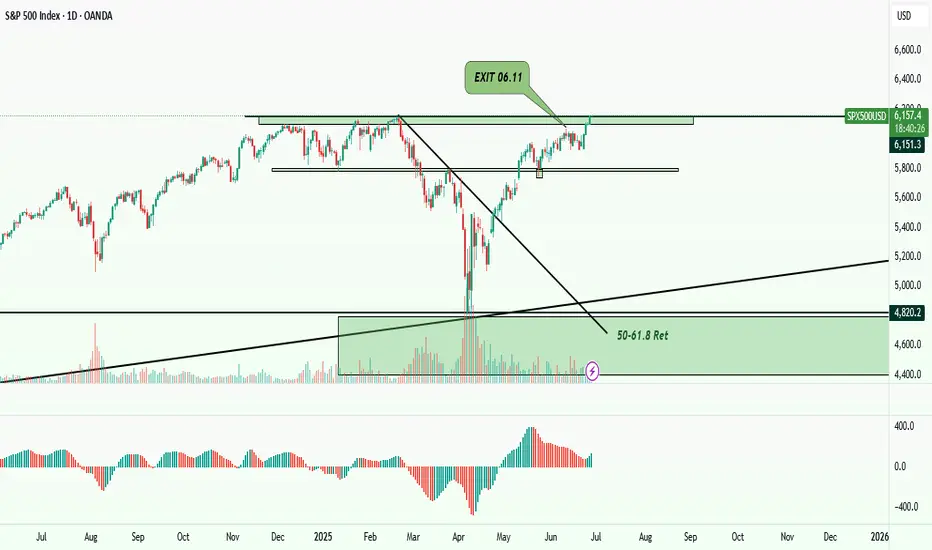
S&P 500 , UPDATE CHART Uptrend
I closed all my open positions when the price was near the All-Time High (ATH) and observed a bearish candle at the end of June 11th. Now, the chart is attempting to break the resistance (S/R) level again. However, I've noticed a divergence between the main chart and the Awesome Oscillator (AO), which leads me to believe we will either see a correction below this level or a pullback after a potential breakout. I am waiting for one of these scenarios to materialize before re-entering with new buying positions.
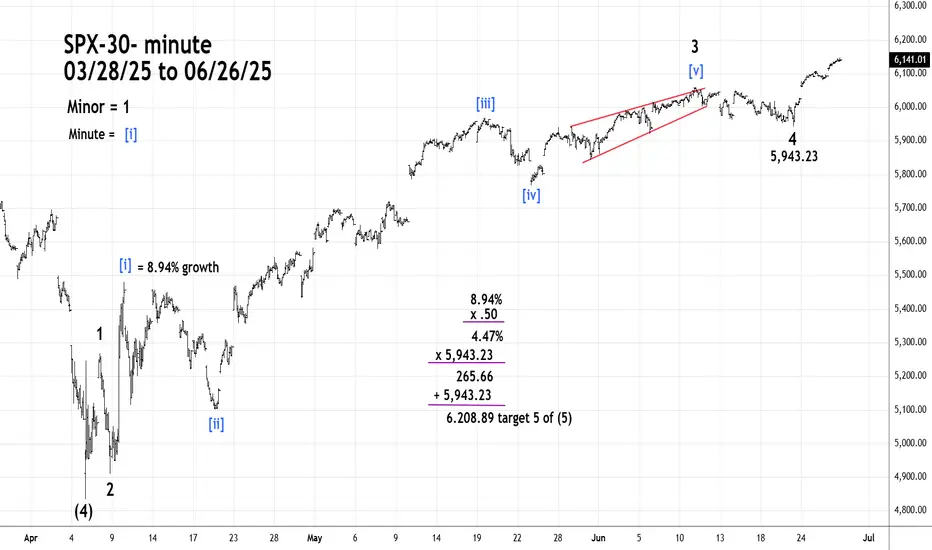
S&P 500 - Fibonacci Resistance Intermediate wave (5) up from the 04/07/25 bottom could be nearing completion.
Minor wave 5 of (5) is close to a Fibonacci relationship with Minor wave 1.
Using leeway around the 6,208 target gives a broad zone of 6,175 to 6,220. The SPX could reach this zone on 06/27/25.
52 W hi Capitalize on the around-the-clock liquidity of S&P 500 futures , and take advantage of one of the most efficient and cost-effective ways to gain market exposure to a broad-based, capitalization-weighted index that tracks 500 of the largest companies of the US economy
they'll losing they pants. we're selling gang
!!!!!!!!! Lol
Is Now a Good Time to Invest in the S&P 500? Is Now a Good Time to Invest in the S&P 500?
The chart shows the S&P 500 in a long-term upward trend, with clear channels indicating zones from "extremely cheap" (bottom green line) to "extremely expensive" (top red line). Currently, the index is trading near the upper part of the channel, in the "expensive" to "extremely expensive" area.
What Does This Mean for Investors?
The current price level suggests the S&P 500 is expensive compared to its historical trend, increasing the risk of a short-term correction.
Historically, buying near the top of such channels has offered less margin of safety and a higher probability of pullbacks in the following months.
Investment idea
It is a good time to start investing gradually (using a dollar-cost averaging strategy, investing a fixed amount each month) rather than making a lump-sum, “all-in” investment with your savings.
This approach allows you to benefit from long-term market growth while reducing the risk of entering at a market peak.
The risks currently outweigh the potential short-term gains, and we could see better prices in the coming months.
In summary:
Now is not the time to go all-in on the S&P 500. Gradually investing each month is a sensible approach, given the elevated risk of a correction and the possibility of better entry points ahead.

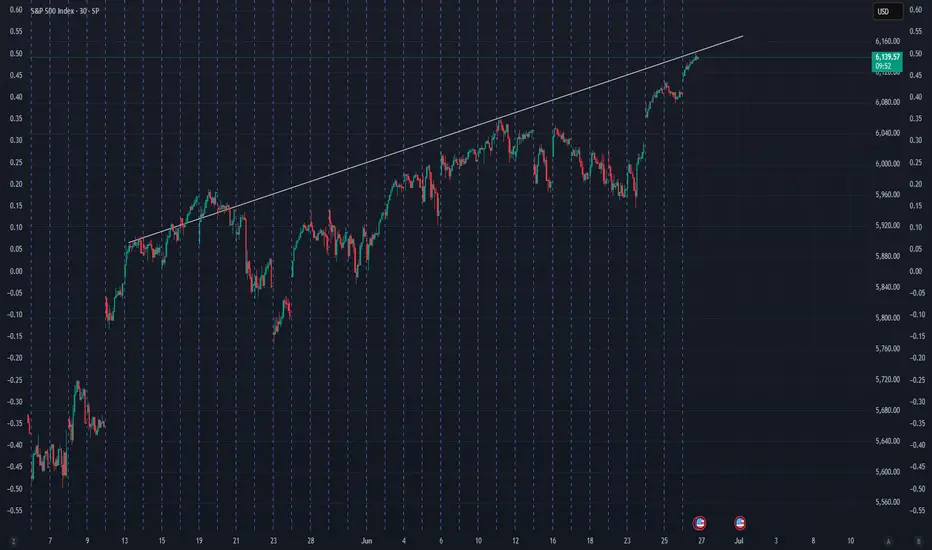
Bearish Wolfewave set upPrice has gone above the 1-3 line.
Short signal is when price enters back below the 1-3 line.
Target will be the 1-4 line.
Alternative targets are the magic lines.
An earlier entry is when the hourly SAR moves above price.
Earlier clues could be seen on the shorter timeframes.
Patterns can fail.
Do your own due diligence.
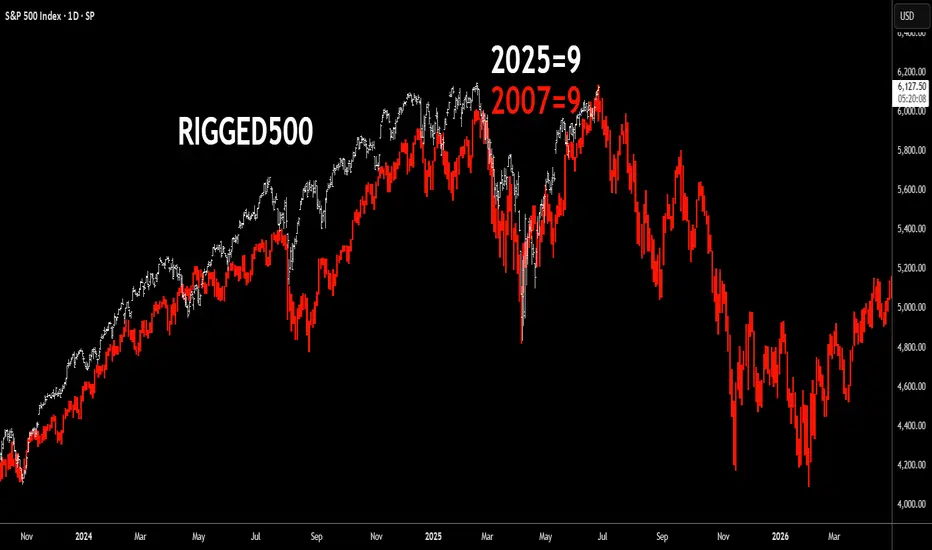
Market crash looming - Fractal Echo of 2007 - 2025 S&P 500 In what other case could the "market" be here if it wasn't centrally rigged?
Geopolitics aside. The 2025 vs. 2007 numerological equivalence ("9" year) shows the power of 9 taking over: the end of a rigged bull market.
Chart overlays the S&P 500 price action from 2023–2025 (white line) with that of the 2006–2008 pre-GFC period (red line), highlighting an uncanny fractal similarity in structure, tempo, and momentum. The visual suggests that 2025 (numerologically marked as a “9” year, like 2007) may be echoing the same setup seen before the 2008 financial crisis: just massively worse.