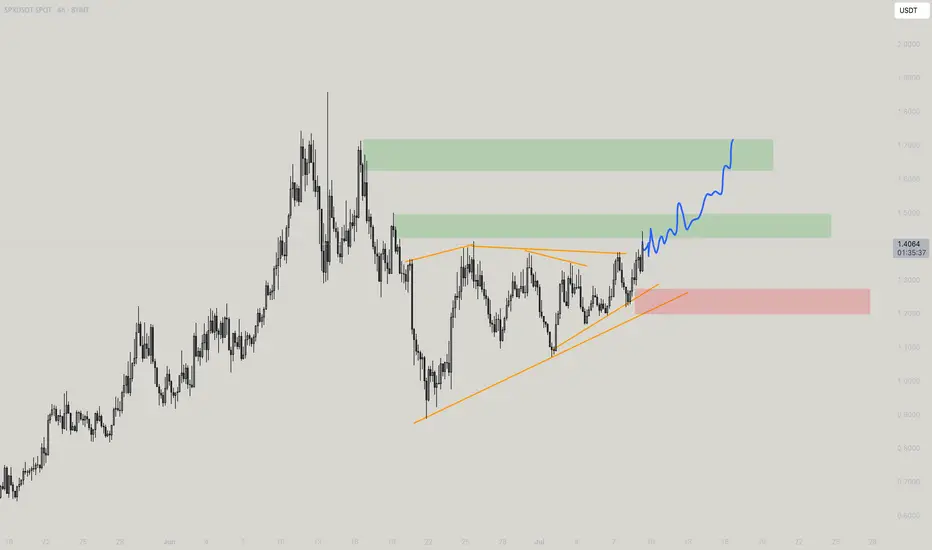
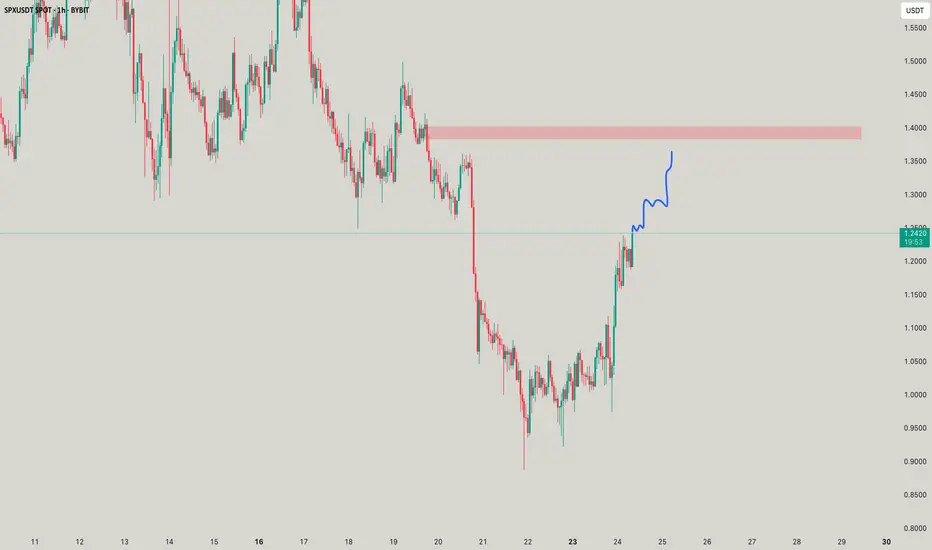
SPX/USDT – Retest Opportunity Within TriangleAs shared in the previous post, SPX was approaching a crucial breakout zone. Price has now retraced and is hovering around the lower trendline, presenting an ideal retest entry opportunity.
Entry (on retest): 1.37 – 1.39
Stop Loss: Below 1.33
Targets:
T1: 1.70
T2: 2.05
T3: 2.54
T4: 3.56
Support Levels: 1.3737 / 1.33
Resistance Levels: 1.70 / 2.05
Price structure remains intact, and consolidation above this range can fuel a strong move. Entering this retest zone keeps risk low with an excellent risk-to-reward ratio
DYOR | Not financial advice
SPXUSDT trade ideas

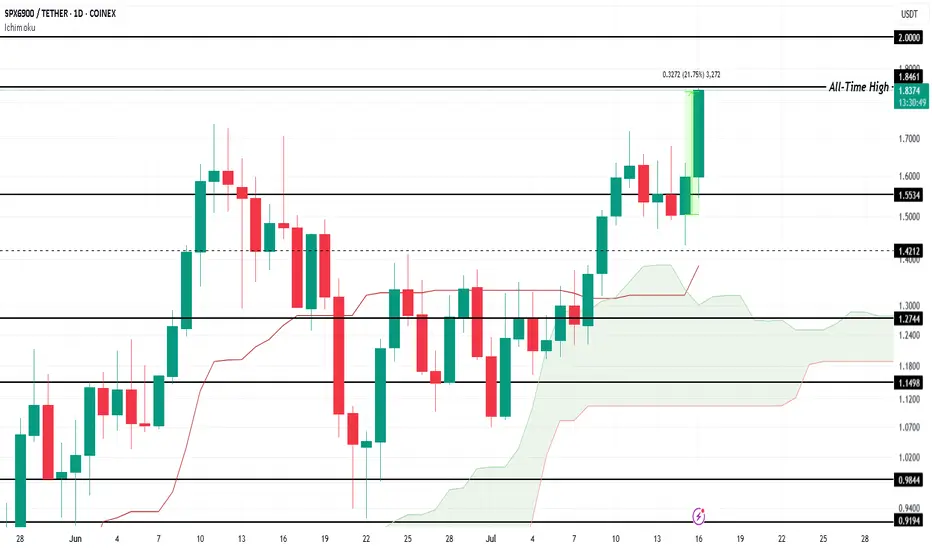
SPX Forms New All-Time High, Price Nears $2.00COINEX:SPXUSDT price has surged by 21.75% over the last 24 hours , reaching a new all-time high (ATH) of $1.84 . At the time of writing, SPX is trading at $1.83, showing promising signs of further upward movement. The altcoin's strong performance reflects growing investor interest and market optimism.
The Ichimoku Cloud, which lies beneath the candlesticks, signals that bullish momentum is currently prevailing for $COINEX:SPXUSDT. This technical indicator suggests that the altcoin could continue its ascent, potentially breaching the $2.00 level in the near future . If the trend persists, SPX could set new price milestones.
However, if COINEX:SPXUSDT experiences significant selling pressure from investors, the altcoin could face a correction. A drop below $1.55 would indicate a shift in momentum and potentially erase some of the recent gains. A failure to maintain key support levels could lead to further downside risks.
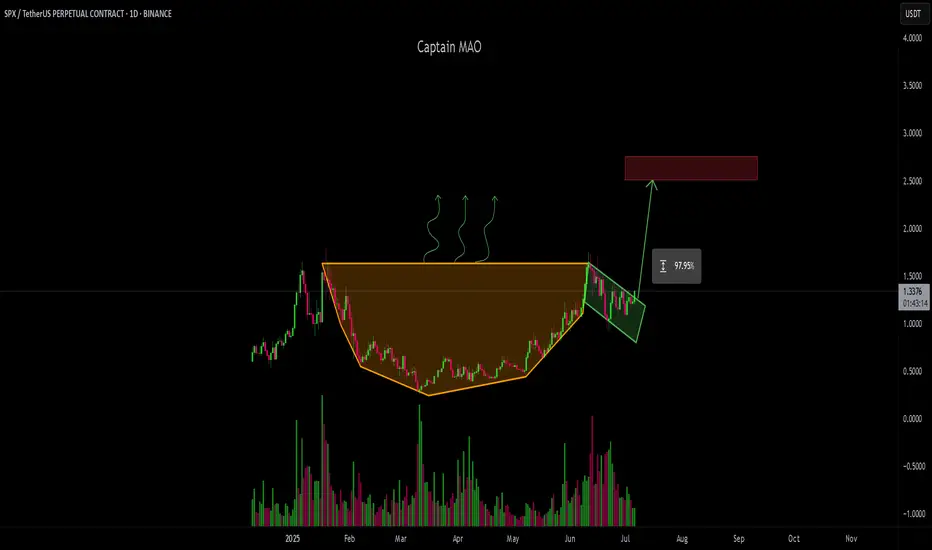
SPX/USDT CUP&Handle On the daily time frame, SPX/USDT has formed a classic Cup and Handle pattern, one of the most reliable bullish continuation setups. The structure shows a smooth rounded base followed by a brief consolidation forming the handle.
Now, the price is attempting a breakout from the handle zone, signaling momentum for the next leg up. A daily candle close above the handle resistance will confirm the pattern breakout and likely trigger strong upside movement.
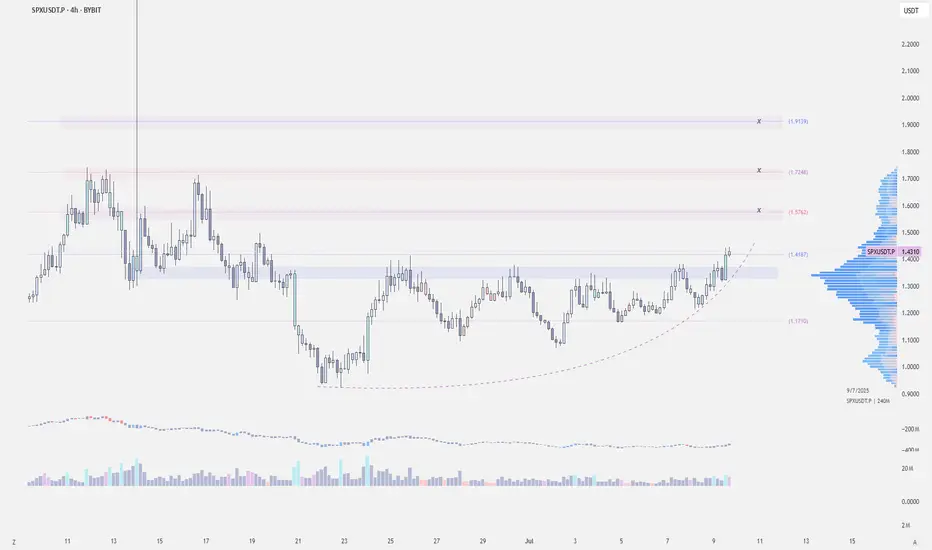
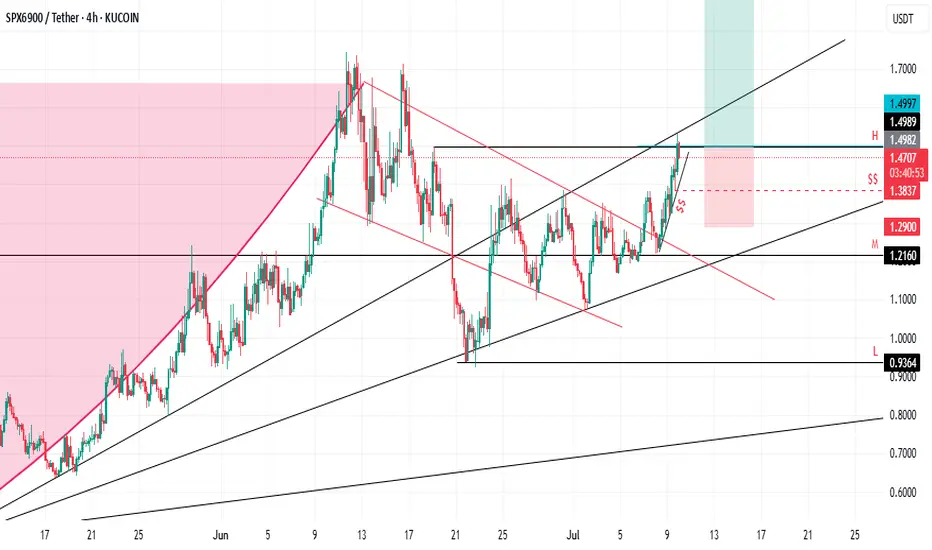
$SPX - Short-Term OutlookMEXC:SPXUSDT | 4h
Price is now trading above its previous resistance 1.40
We may fill the gap around 1.39s, but this one looks solid so long as we stay above 1.36
Local Support: 1.40-1.38
TPs:
1.54 to 1.58
1.67 to 1.72
1.86 to 1.92
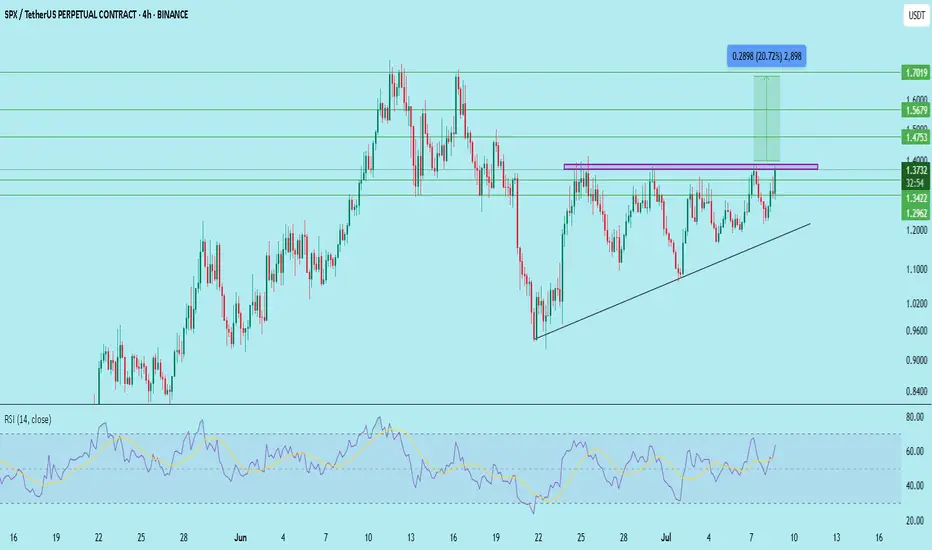
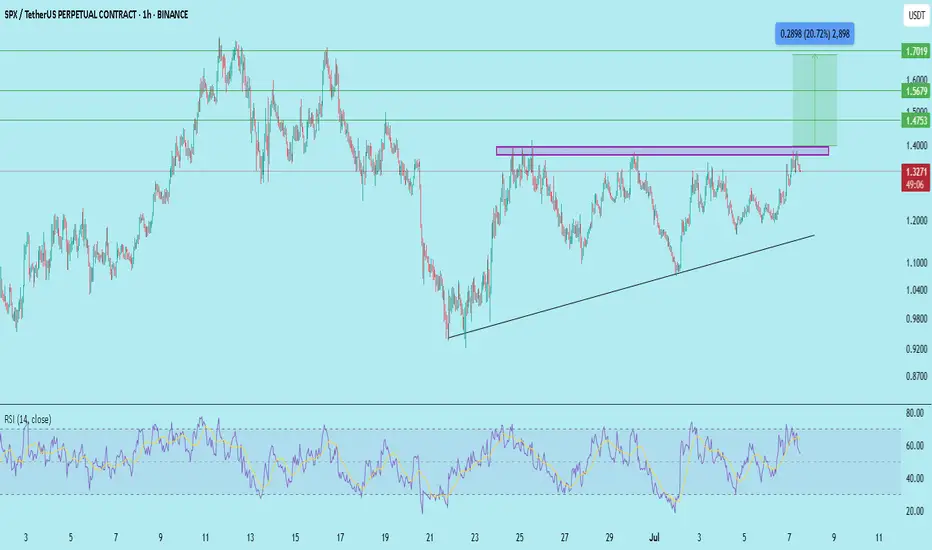
SPXUSDT Approaching Breakout Zone – 20% Potential Move?SPXUSDT is gearing up for a potential breakout after consolidating in an ascending triangle. Price is once again testing the key horizontal resistance at $1.38, which has held for several days.
Structure:
Ascending triangle on the 4H timeframe – typically bullish
Multiple rejections at the $1.38 level indicate a strong breakout if flipped
RSI is around 63, signaling growing momentum
Trade Setup (If Breakout Confirms):
Entry: Candle closes above $1.38 resistance
Stop Loss: Below $1.3422 support zone
Targets:
$1.4753
$1.5679
$1.7019
Potential upside of ~20% if momentum holds.
Support & Resistance:
Immediate Support: $1.3422 & $1.2962
Major Resistance: $1.38 → $1.4753 → $1.5679 → $1.7019
A breakout from this structure can trigger a strong bullish move. Watch for confirmation and volume.
DYOR. Not financial advice.
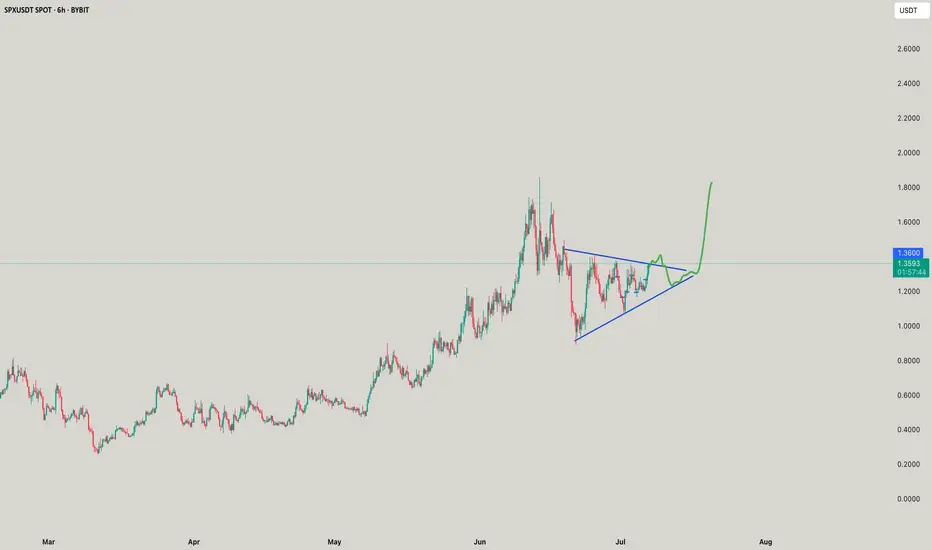
SPX/USDT – Breakout WatchSPX is currently testing a major horizontal resistance zone around 1.34–1.36, after a consistent series of higher lows forming an ascending triangle.
Trade Setup:
Entry (after breakout and retest): 1.34–1.36
Targets:
First target: 1.475
Second target: 1.567
Final target: 1.701
Stop Loss: Below 1.29
Structure: Ascending triangle showing compression and bullish pressure
RSI: Trending up, signaling possible continuation
This setup requires patience — the ideal long entry is after a breakout with successful retest. Rushing in early can be risky.
Do your own research. Not financial advice.
SPX LONG📘 Daily Trade Journal – Thursday, July 17
1. Trade Overview
- Asset:-SPX - Direction:** Long
- Entry Time:** After 10:00 p.m. (Vietnam Time)
- Timeframes Used:** 1H, 30m
- Bias Origin:** Bullish market structure continuation with recent change of character
---
2. Trade Idea (Before Entry)
I came to the charts shortly after 10:00 p.m. PopCat had just wicked into the 0.618 Fibonacci level. I considered it a chase, so I passed on it—didn’t get the retracement I wanted.
ETH and Solana were not retracing into the OTE zones either.
Pengu appeared more bearish—potentially forming a daily lower high, indicating slowing upside momentum. I ruled that one out too.
I ended up selecting **SPX**, trading it for the first time. Despite that, I stayed focused on structure and levels:
1H timeframe had a bullish **external break of structure.
30m timeframe showed a temporary bearish retracement, but then a bullish change of character followed.
This change of character swept the previous day’s high, which was a concern since that level was also my target, and it had already been touched—possibly by London.
Despite this, I decided to take the trade based on:
* Anchored Fibonacci from today's early session low to the current high
* Overall structure still being bullish
* Expecting a possible sweep of today’s **intraday high** and maybe even another test above **yesterday’s high**
---
### 3. **Entry Details**
* **Entry Price:** \
* **Risk Taken:** \
* **Stop Loss Placement:** Below the retracement swing low / point of invalidation
* **Confluences Used:**
* ✅ Fibonacci retracement
* ✅ Change of Character
* ❌ No AVWAP, trendlines, or order blocks used
---
### 4. **Exit Details**
*(To be completed when the trade closes)*
* **Exit Time:** \
* **Exit Price:** \
* **Reason for Exit:** \
---
### 5. **Outcome**
*(To be completed when the trade closes)*
* **P\&L:** \
* **Partial or Full Exit:** \
* **Session of Exit:** \
---
### 6. **Self-Assessment**
* ✅ **What went right?**
* Didn’t force a trade on assets that didn’t return to key levels.
* Stayed open to switching assets when familiar names didn’t provide ideal setups.
* Executed a setup based on structure, not emotional attachment.
* ❌ **What could be improved?**
* SPX target had already been swept—may need to reevaluate entering **after** key liquidity has already been taken.
* More clarity needed when trading unfamiliar assets for the first time (like SPX).
* 📋 **Did I follow my trading plan?**
* Yes. I stayed within my timeframe, followed structure, used Fibonacci, respected the process.
* 📈 **Would I take this trade again, exactly the same way?**
* Yes, with caution. Would want stronger confirmation if the target liquidity has already been touched. Otherwise, setup fits criteria.
* 🔎 **How would I rate this trade out of 10?**
* \
---
🧠 Notes for Improvement
Today, I didn’t fixate on one asset, which may be a strength.
Need to define a clearer protocol for **target levels that have already been swept**—whether to stand aside or expect continuation.
Emotionally balanced today. No FOMO trades. If this one plays out, great. If not, it’s still within plan.
---
💤 Closing Note
This is Day 3 of live journaling and publishing. One clean setup executed. No overtrading. I’ll let the market decide the outcome and stick to my commitment: one session, one plan, one trade idea. Back tomorrow—same window.
#SPXUSDT ( the ceiling )It seems to be making a good situation.
It has broken the ceiling a bit and
By stabilizing above this ceiling, it can see a good jump in the future.
So don't forget to watch

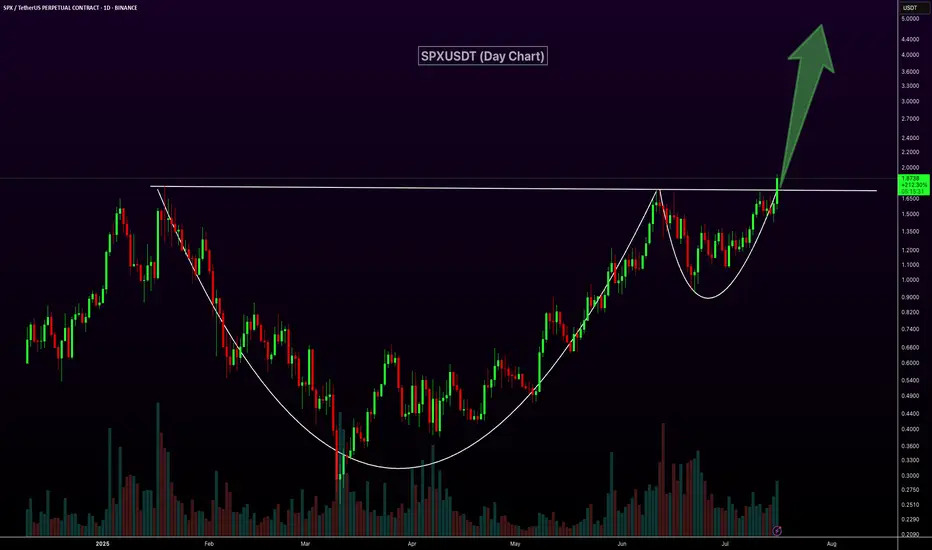
SPXUSDT Forms Classic Cup and HandleSPXUSDT daily chart is showcasing a strong Cup and Handle breakout with high volume, a classic bullish continuation pattern. After a well-formed, rounded base, price has cleanly broken above the neckline resistance around the $1.80 level, supported by strong momentum and a sharp bullish candle. This breakout signals the potential for a significant upside move, with the next leg likely to push toward much higher price levels.
SP:SPX MEXC:SPXUSDT
SPX Swing SetupSPX will rise, Some understand many will #CULT, Since the FDV for 2025 is uprising and the agenda is to invest in communities not in any financial institute, Strong communities are running behind to make the algorithm into real manifestation. #SPX6900
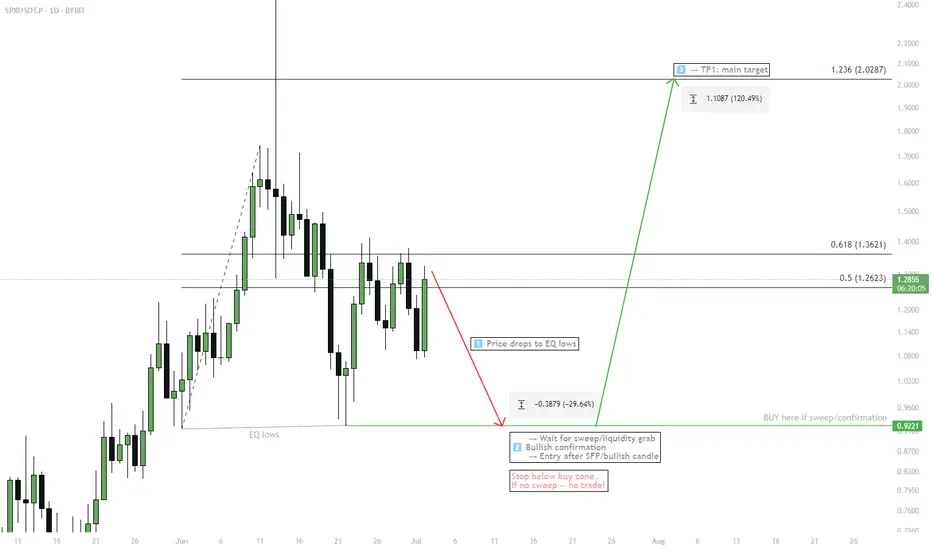
SPX6900 — Dream Scenario1. Wait for price to sweep EQ lows (buy zone)
2. Enter long only after SFP / bullish confirmation
3. Target: 2.13+
4. Stop: below buy zone
If no sweep — no trade!
This SPX will outlive the American index?Well not to say loooks good for scalp if holds the green line or the boxooxox!
SPX - Space X?SPX means SpaceX? LOL NOO, but this coin has traits of the rockets. to move up, as stated
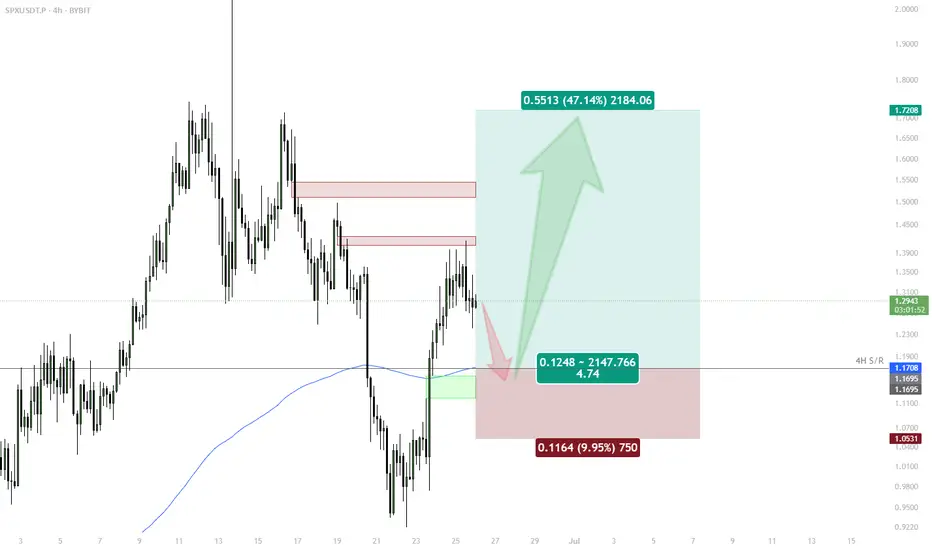
SPX6900 Bidding 4H S/R + FVG Zone — Looking for New Highs✅ 4H S/R + FVG provides strong support and bid opportunity
✅ 200EMA adds further confluence to the setup
✅ Invalidation = 1h closes/consolidates below $1.14
Active Setup:
Long Entry: In $1.08–$1.14 zone (confirmation: reclaim or bullish trigger in area)
Target: $1.72 (new highs/ATH)
Manual Invalidation: Cut if 1h candles close and consolidate below $1.14
🔔 Triggers & Confirmations:
Only bid on strong reaction or reversal in FVG/S/R zone
Exit if 1h PA settles below $1.14 (red pattern bars area)
🚨 Risk Warning:
Aggressive longs — keep risk tight, cut quickly if invalidated
SPX - Space X?I dont know whats the full form, but its just flowing and when it flows - we say LET IT FLOWW!
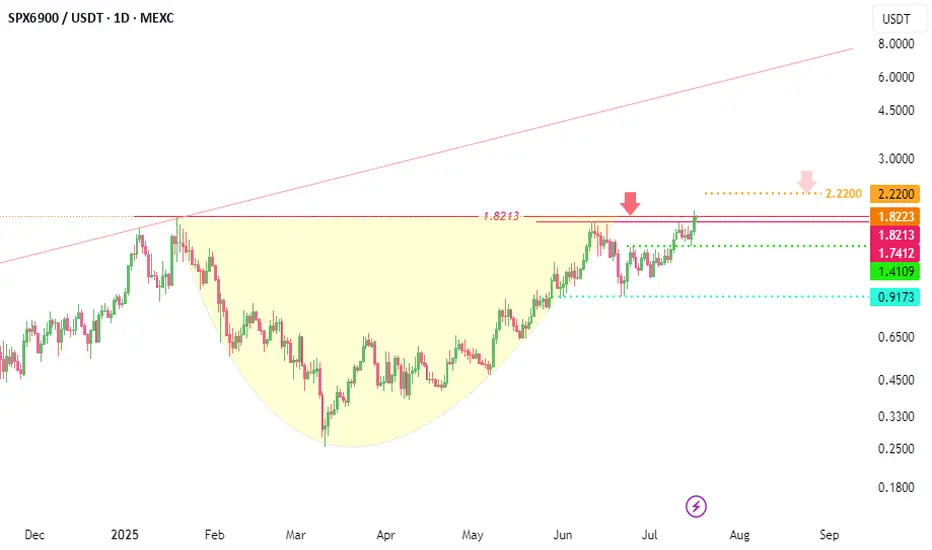
SPX 6900 Forms Bullish Pennant After 18% Rally — $2.20 in SightSPX 6900 has surged 18.20% on the day, continuing a strong bullish market structure that began at the $0.25 low. Since then, price has consistently posted higher highs and higher lows, reclaiming major volume levels and flipping resistance into support.
The latest pivot came from a clean reaction off the 0.618 Fibonacci retracement, propelling price into the ATH region. Now, SPX appears to be forming a bullish pennant, with converging support and resistance signaling a potential breakout setup.
Volume remains elevated, which confirms healthy trend participation. The $1.42 level is now acting as a key support zone, aligned with the value area high and a daily level. As long as this region holds, the current consolidation is likely a continuation pattern.
A confirmed breakout from this pennant structure would project a move toward the $2.20 Fibonacci extension, taken from the previous swing low to high.
Key Levels:
Support: $1.42
Resistance: ATH / Breakout Zone
Target: $2.20 (Fibonacci Extension)
SPX | HTF Breakout Confirmed, Watching for Pullback EntryHTF still bullish — watching W iFVG & weekly OB below as major bid zone.
Breakout to 2.13 next if structure holds.
Lose W OB? Full reset.
Best R:R for swings if we get a flush into 0.75–0.95.

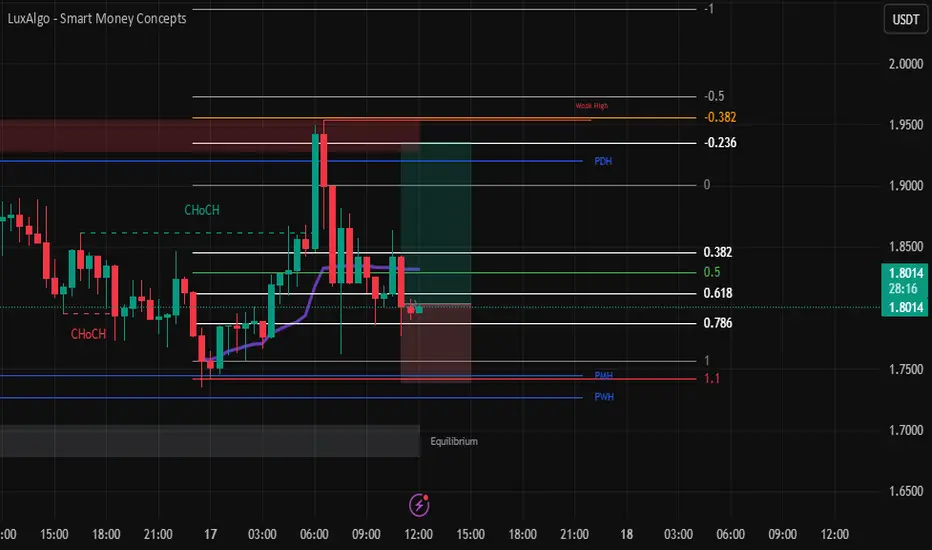
SPX/USDT — Change of Character Signals Bearish Move Incoming The structure has shifted with a clear CHoCH (Change of Character), suggesting that bullish momentum is weakening. Price recently pulled back into a supply zone around 1.6140–1.6910, setting up a potential short opportunity.
🔍 Technical Breakdown:
Price broke below recent higher low = CHoCH confirmed
Bearish BOS followed by retracement into premium zone (FVG/Supply)
Expecting rejection and continuation to downside if price fails to reclaim 1.6140
🔧 Trade Plan:
Entry Area: 1.6140
Stoploss: Above 1.6910
Targets:
• TP1: 1.5290
• TP2: 1.4630
• TP3: 1.3500
This setup aligns with internal structure + supply zone + CHoCH. Wait for confirmation candle or bearish engulfing in entry area before executing.

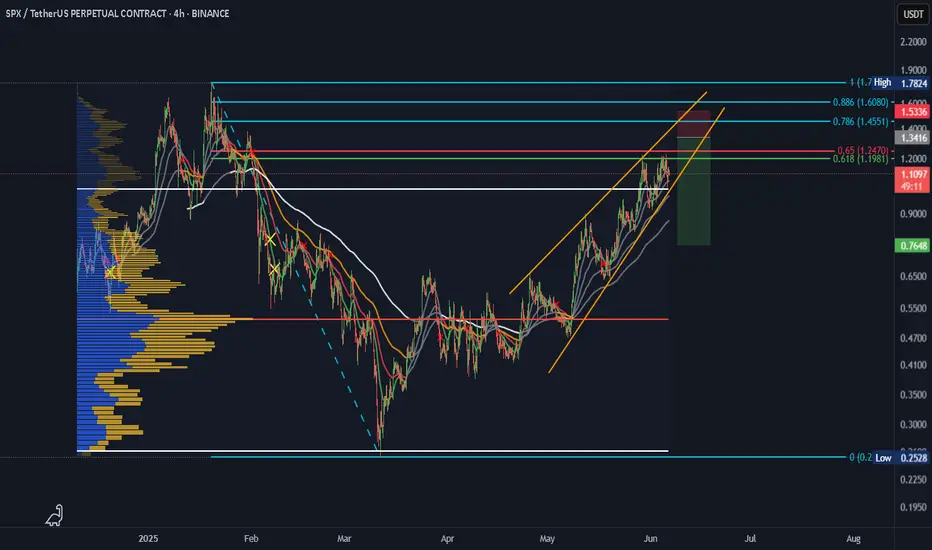
SPX SHORT SETUP SPX SHORT SETUP
ENTRY : 1.3416
PROFIT : 0.7648
STOP : 1.5336
ALL trading ideas have entry point + stop loss + take profit + Risk level.
hello Traders, here is the full analysis for this pair, let me know in the comment section below if you have any questions, the entry will be taken only if all rules of the strategies will be satisfied. I suggest you keep this pair on your watchlist and see if the rules of your strategy are satisfied. Please also refer to the Important Risk Notice linked below.
Disclaimer
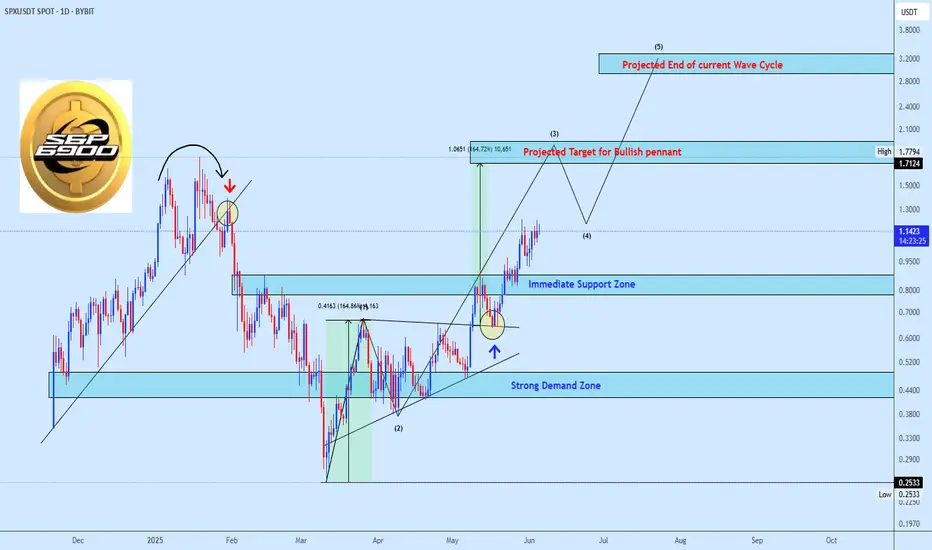
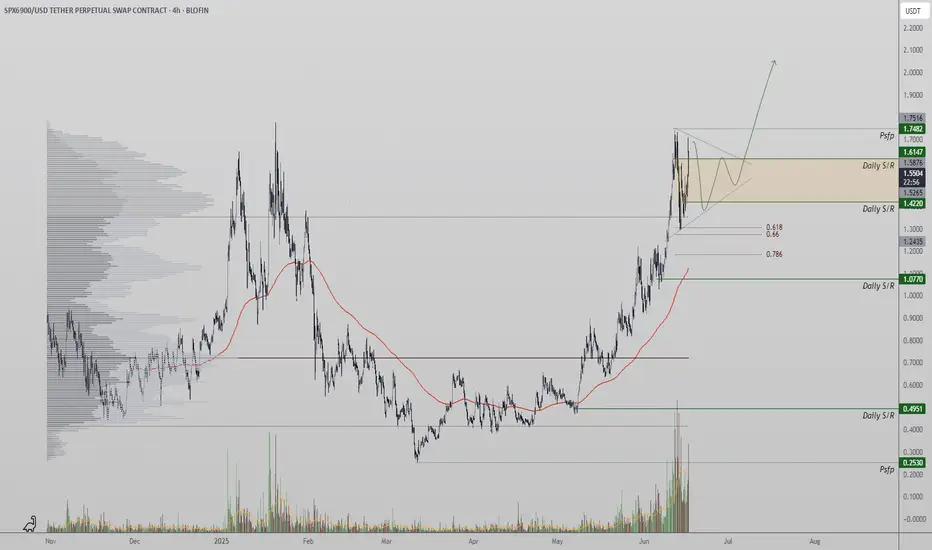
SPXUSDT Wave Structure and Bullish OutlookAfter a clean break from the descending structure, SPXUSDT established a solid base within the strong demand zone, followed by a bullish pennant breakout.
The wave count suggests the current move is targeting the $1.77 zone as wave (3) before a minor correction for wave (4), with the projected end of this bullish cycle aiming around $3.20. Immediate support remains at $1.14, and invalidation only occurs on a break below the previous base. Structure remains bullish unless proven otherwise.